Project 2 - Rankine cycle Simulator
MAIN CODE:-
% Rankine Cycle Simulator
% points of the rankine cycle
clear all
close all
clc
% inputs for calculating Rankine cycle
p1 = input('Enter the inlet pressure of turbine: ')
p2 = input('Enter the outlet pressure from turbine: ')
t1 = input('Enter the steam inlet temperature: ')

% pressure of state points
p4 = p1;
p3 = p2;

% Cycle information
fprintf('Process 1-2 : Isentropic expansion process (Turbine)n')
fprintf('Process 2-3 : isobaric heat rejection process (Condensor)n')
fprintf('Process 3-4 : Isentropic compression process (Pump)n')
fprintf('Process 4-1 : Isobaric heat addition process (Boiler)n')

%calculating the dryness fraction of state points
s1 = XSteam('s_pt',p1,t1); % state point 1
s2 = s1; % state point 2
sf2 = XSteam('sL_p',p2);
sg2 = XSteam('sV_p',p2);
sfg2 = sg2 - sf2;
x2 = (s1 - sf2)/sfg2;


if (x2 > 1)
t2 = XSteam('T_ps',p2, s2);
t_2 = XSteam('Tsat_p',p2);
t3 = t_2;
Td = linspace(t2,t_2,50);
s_2 = XSteam('sV_T',t_2);
s3 = XSteam('sL_T',t3);
s4 = s3;
else
t2 = XSteam('Tsat_p',p2);
t_2 = t2;
t3 = t2;
s3 = sf2; % State pont 3
s4 = s3; % state point 4

end

%calculating the enthalpy of state points
h1 = XSteam('h_pt',p1,t1); % state point 1
hf2 = XSteam('hL_p',p2); % state point 2
hg2 = XSteam('hV_p',p2);
hfg2 = hg2 - hf2;
h2 = hf2 + x2*hfg2;
h3 = hf2; % state point 3
v3 = XSteam('vL_p',p3); %specific volume
h4 = v3* (p1-p2)*100 + h3; % state point 4
cp = XSteam('Cp_ps',p3, s3);
cv = XSteam('Cv_ps',p3, s3);
k = 1 - (cv/cp);
t4 = t3*((p4/p3)^k);

t5 = XSteam('Tsat_p',p1);
t6 = t5;

s5 = XSteam('sL_T',t5);
s6 = XSteam('sV_T',t6);

% Turbine work
Wd_tb = h1 - h2;

% Pump work
Wd_pm = h4 - h3;

% Net work, Back work ratio and thermal effeciency of rankie cycle
W_net = Wd_tb - Wd_pm;
bwr = (h1 - h4)/(h2 - h3);
effeciency = W_net/(h1 - h4);
effeciency = effeciency*100

% state point 1 parameters
fprintf('nttResultsn')
fprintf('nState point-1')
fprintf('nP1 = %f',p1)
fprintf('nT1 = %f',t1)
fprintf('nS1 = %f',s1)
fprintf('nH1 = %f',h1)

% state point 2 parameters

fprintf('nnState point-2')
fprintf('nP2 = %f',p2)
fprintf('nT2 = %f',t2)
fprintf('nS2 = %f',s2)
fprintf('nH2 = %f',h2)
fprintf('nX = %f',x2)

% state point 3 parameters

fprintf('nnState point-3')
fprintf('nP3 = %f',p3)
fprintf('nT3 = %f',t3)
fprintf('nS3 = %f',s3)
fprintf('nH3 = %f',h3)

% state point 4 parameters

fprintf('nnState point-4')
fprintf('nP4 = %f',p4)
fprintf('nT4 = %f',t4)
fprintf('nS4 = %f',s4)
fprintf('nH4 = %f',h4)

% Performance parameters of Rankine Cycle

fprintf('nn Performance of Rankine cycle')
fprintf('nTurbine work = %f',Wd_tb)
fprintf('nPump = %f',Wd_pm)
fprintf('nBack Work ration = %f',bwr)
fprintf('nThermal effeciency = %f',effeciency)

% Plotting of the graph
% Data - boiler sensible heat addition at superheated condition

T = linspace(t6,t1,500);
for i = 1:length(T)
    S(i) = XSteam('s_pT',p1,T(i));
    H(i) = XSteam('h_pT',p1,T(i));
end

% Data - saturation temprature curve
maxt = linspace(1,t1,500);
for j = 1:length(maxt)
    satlS(j) = XSteam('sL_T',maxt(j));
    satvS(j) = XSteam('sV_T',maxt(j));
    satlH(j) = XSteam('hL_T',maxt(j));
    satvH(j) = XSteam('hV_T',maxt(j));
end

% T-S Diagram for Rankine cycle
subplot(1,2,1)

% plot - saturation curves
plot(satlS,maxt,'Color','r')
hold on
plot(satvS,maxt,'Color','r')
plot(4.4230,272.6,'o','MarkerFaceColor','r','MarkerSize',6)
% plot - Curve for points t5 and t6
line([s5 s6],[t5 t6],'Color','k','LineWidth',2)
% plot - Curve for points t6 and t1
plot(S,T,'Color','k','LineWidth',2)
% plot - Curve for points t1 and t2
line([s1 s2],[t1 t2],'color','k','linewidth',2)

if(x2 > 1)
    % Data - constant pressure curve at boiler inlet if present
    for i = 1:length(Td)
        Sd(i) = XSteam('s_pT',p2,Td(i));
        Hd(i) = XSteam('h_pT',p2,Td(i));
    end

    % plot - Curve for points t2 and t_2 (if present)
    plot(Sd,Td,'color','k','linewidth',2)
    % plot - line for t_2 and t3 (if present)
    line([s_2 s3],[t_2 t3],'color','k','linewidth',2)
else
    line([s2 s3],[t2 t3],'color','k','linewidth',2)
end

% plot - Curve for the points t3 and t4
line([s3 s4],[t3 t4],'Color','k','linewidth',2)

% plot - Constant pressure heat addition curve till saturation liquid line
line([s4 s5],[t4 t5],'color','k','linewidth',2)

% labelling of graph
title('T-S Diagram of Rankine cycle')
xlabel('Entropy(KJ/K)')
ylabel('Temprature degC')

% Marking the state points
text(s1,t1,"1");
text(s2,t2,"2");

if (x2 > 1)
    text(s_2,t_2,"2");
end
text(s3,t3,"3");
text(s4,t4,"4");

% H-S diagram for rankine cycle
subplot(1,2,2)
% plot for saturation curves of liquid and vapour
plot(satlS,satlH,'Color','r','LineWidth',2)
hold on
plot(satvS,satvH,'Color','r','LineWidth',2)

% plot - isentropic expansion line
line([s1 s2],[h1 h2],'color','k','linewidth',2)

if (x2 > 1)
    h_2 = Xsteam('h_ps',p2,s_2);
    % plot - constant pressure heat addition ,if outlet steam is superheated
    plot(Sd,Hd,'Color','k','LineWidth',2)

    % Data - constant pressure heat rajection curve enthalpy values
    entropy = linspace(s_2,s3,100);
    for k = 1:length(entropy)
        enthalpy(k) = Xsteam('h_ps',p2,entropy(k));
    end

    % Plot - Constant pressure heat rejection curve
    plot(entropy,enthalpy,'Color','k','LineWidth',2)
else
    % Data - constant pressure heat rejection curve enthalpy values if
    % steam is wet or dry saturated vapour
    entropy = linspace(s2,s3,100);
    for k = 1:length(entropy)
        enthalpy(k) = XSteam('h_ps',p2,entropy(k));
    end

    % Plot - constant pressure heat rejection curve
    plot(entropy,enthalpy,'Color','k','LineWidth',2)
end

% Plot - Isentropic copression line
line([s3 s4],[h3 h4],'color','k','linewidth',2)

% data - Constant pressure heat addition curve enthalpy values
entropy1 = linspace(s4,s1,100);
for l =  1:length(entropy1)
    enthalpy1(1) = XSteam('h_ps',p1,entropy1(1));
end
% plot - constant pressure heat addition curve
plot(entropy1,enthalpy1,'Color','k','LineWidth',2)


% Labelling of graph
title('H-S Diagram of Rankine Cycle')
xlabel('Entropy(KJ/Kg K')
ylabel('Enthalpy KJ/Kg')

% Marking the state points
text(s1,h1,"1");
text(s2,h2,"2");

if (x2 > 1)
    text(s_2,h_2,"2");
end
text(s3,h3,"3");
text(s4,h4,"4");
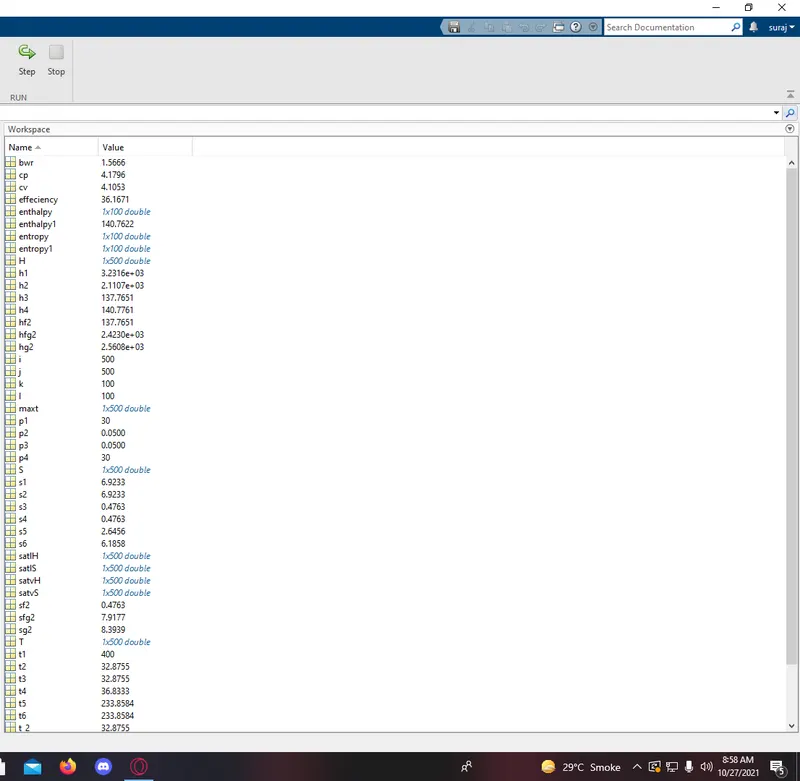
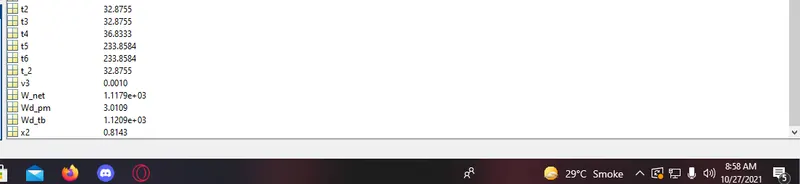
RESULTS:-