Rankine Cycle Simulator
AIM: To create a Rankine Cycle Simulator from the given input and read the data from the standard thermodynamic library of steam table.
OBJECTIVES:
1. To create a Rankine Cycle simulator in MATLAB.
2. To calculate the state point using function XSteam.
3. To plot the T-S and H-S curve for given input in Rankine Cycle.
4. To get output in the command window for each state point in cycle.
GOVERNING EQUATIONS:
In general, the efficiency of a simple rankine cycle can be written as

Each of the next four equations is derived from the energy and mass balance for a control volume.  defines the thermodynamic efficiency of the cycle as the ratio of net power output to heat input. As the work required by the pump is often around 1% of the turbine work output, it can be simplified.




When dealing with the efficiencies of the turbines and pumps, an adjustment to the work terms must be made:

Where,
 |
Heat flow rate to or from the system (energy per unit time) |
 |
Mass flow rate (mass per unit time) |
 |
Mechanical power consumed by or provided to the system (energy per unit time) |
|
Thermodynamic efficiency of the process (net power output per heat input, dimensionless) |
 |
Isentropic efficiency of the compression (feed pump) and expansion (turbine) processes, dimensionless |
 |
The "specific enthalpies" at indicated points on the T–s diagram |
 |
The final "specific enthalpy" of the fluid if the turbine were isentropic |
 |
The pressures before and after the compression process |
BODY OF THE CONTENT:
The Rankine Cycle is an idealized thermodynamic cycle describing the process by which certain heat engines, such as steam turbines or reciprocating steam engines, allow mechanical work to be extracted from a fluid as it moves between a heat source and heat sink. The Rankine cycle is named after William John Macquorn Rankine, a Scottish polymath professor at Glasgow University.
Heat energy is supplied to the system via a boiler where the working fluid (typically water) is converted to a high pressure gaseous state (steam) in order to turn a turbine. After passing over the turbine the fluid is allowed to condense back into a liquid state as waste heat energy is rejected before being returned to the boiler, completing the cycle. Friction losses throughout the system are often neglected for the purpose of simplifying calculations as such losses are usually much less significant than thermodynamic losses, especially in larger systems.
THE FOUR PROCESSES IN THE RANKINE CYCLE
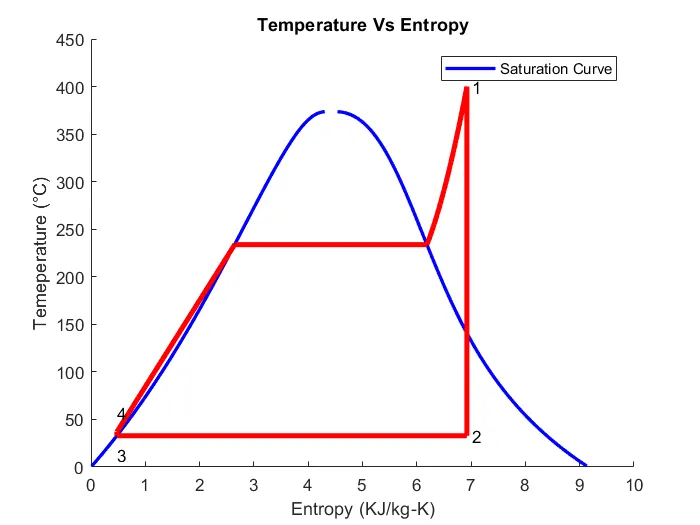
There are four processes in the Rankine cycle. The states are identified by numbers (in brown) in the T–s diagram.
- Process 1–2: The working fluid is pumped from low to high pressure. As the fluid is a liquid at this stage, the pump requires little input energy.
In other words, Process 1-2 is [Isentropic compression]
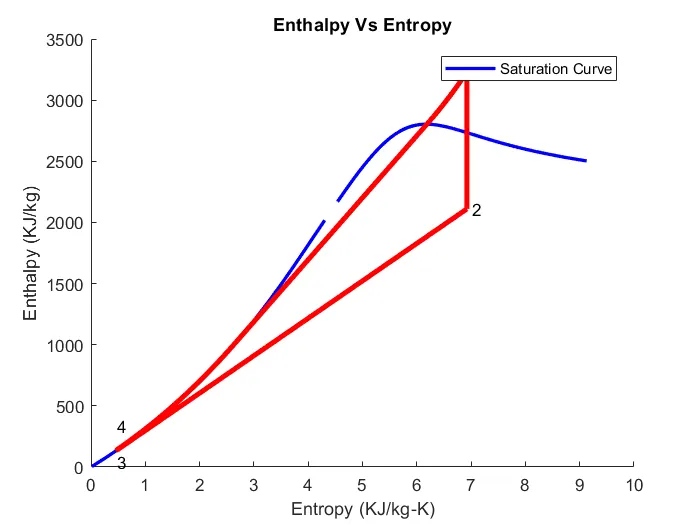
- Process 2–3: The high-pressure liquid enters a boiler, where it is heated at constant pressure by an external heat source to become a dry saturated vapour. The input energy required can be easily calculated graphically, using an enthalpy–entropy chart (h–s chart, or Mollier diagram), or numerically, using steam tables or software.
In other words, Process 2-3 is [Constant pressure heat addition in boiler]
- Process 3–4: The dry saturated vapour expands through a turbine, generating power. This decreases the temperature and pressure of the vapour, and some condensation may occur. The output in this process can be easily calculated using the chart or tables noted above.
In other words, Process 3-4 is [Isentropic expansion]
- Process 4–1: The wet vapour then enters a condenser, where it is condensed at a constant pressure to become a saturated liquid.
In other words, Process 4-1 is [Constant pressure heat rejection in condenser]
In an ideal Rankine cycle the pump and turbine would be isentropic, i.e., the pump and turbine would generate no entropy and hence maximize the net work output. Processes 1–2 and 3–4 would be represented by vertical lines on the T–s diagram and more closely resemble that of the Carnot cycle. The Rankine cycle shown here prevents the state of the working fluid from ending up in the superheated vapor region after the expansion in the turbine, which reduces the energy removed by the condensers.
The actual vapor power cycle differs from the ideal Rankine cycle because of irreversibilities in the inherent components caused by fluid friction and heat loss to the surroundings; fluid friction causes pressure drops in the boiler, the condenser, and the piping between the components, and as a result the steam leaves the boiler at a lower pressure; heat loss reduces the net work output, thus heat addition to the steam in the boiler is required to maintain the same level of net work output.
Below is a simplest schematic representing a Rankine Cycle
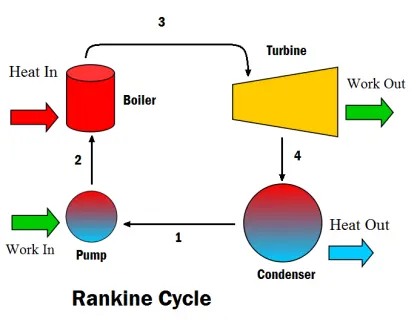
Code in MATLAB for the Rankine Cycle Simulator is as follows,
clear all
close all
clc


% Comments to display
disp('RANKINE CYCLE SIMULATOR')
disp('Processes in the Rankine Cycle')
disp('1-2 is the Isentropic Expansion Process in the Turbine')
disp('2-3 is the Constant Pressure Heat Rejection Process in the Condenser')
disp('3-4 is the Isentropic Compression Process in the Pump')
disp('4-1 is the Constant Pressure Heat Addition Process in the Boiler')


% Input data
p_1 = input('Value of pressure at the inlet of the Turbine, p_1(in bar) =  ')
T_1 = input('Value of temperature at the inlet of the Turbine, T_1(in °C) = ')
p_2 = input('Value of pressure at the inlet of the Condenser, p_2(in bar) = ')


% State Point - 1
h_1 = XSteam('h_pT',p_1,T_1);           % Extracting Enthalpy from XSteam at p_1 and T_1
s_1 = XSteam('s_pT',p_1,T_1);           % Extracting Entropy from XSteam at p_1 and T_1


% State Point - 2
s_2 = s_1;                              % Entropy is equal at both the points beacause of the Isentropic Expansion Process
s_f_2 = XSteam('sL_p',p_2);             % Saturated Liquid Entropy at p_2
s_g_2 = XSteam('sV_p',p_2);             % Saturated Vapour Entropy at p_2
x_2 = (s_2 - s_f_2)/(s_g_2 - s_f_2);    % Vapour Fraction or Quality of Steam at State Point - 2
h_f_2 = XSteam('hL_p',p_2);             % Saturated Liquid Enthalpy at p_2
h_g_2 = XSteam('hV_p',p_2);             % Saturated Vapour Enthalpy at p_2
h_2 = h_f_2 + (x_2 * (h_g_2 - h_f_2));  % Enthalpy at State Point - 2


% State Point - 3
p_3 = p_2;                              % Pressure is equal at both the points because of the Constant Pressure Heat Rejection Process
h_3 = XSteam('hL_p',p_3);               % Enthalpy at p_3
s_3 = XSteam('sL_p',p_3);               % Entropy at p_3


% State Point - 4
s_4 = s_3;                              % Isentropic Compression Process
p_4 = p_1;                              % Constant Pressure Heat Rejection


% Workdone in the Turbine
W_T = (h_1 - h_2);


% Workdone required for running the Pump
v_3 = XSteam('vL_p',p_3);              % Specific Volume at p_3
W_P = v_3 * (p_4 - p_3) * 100;         % Workdone required for running the Pump
h_4 = h_3 - W_P;                       % Enthalpy at State Point - 4


% Net Workdone output from the Rankine Cycle
W_NET = W_T - W_P;


% Heat added to the system
Q_IN = h_1 - h_4;


% Heat rejected from the system
Q_OUT = h_2 - h_3;


% Thermal Efficiency of the Rankine Cycle
T_EFF = (W_NET/Q_IN) * 100;


% Specific Steam Consumption
S_S_C = (3600/W_NET);


% Back Work Ratio
B_W_R = W_P/W_T;


% Calculation of Temperature at all state Points 2, 3 and 4
T_3 = XSteam('Tsat_p',p_3); % Saturation Temperature at Pressure 3
T_2 = T_3; % Becuase of Constant Pressure Heat addition
Cp4 = XSteam('Cp_ps',p_4,s_4); % Specific Isobaric Heat Capacity
Cv4 = XSteam('Cv_ps',p_4,s_4); % Specific Isochoric Heat Capacity
k = Cp4/Cv4;
T_4 = T_3/((p_3/p_4)^((k-1)/k)); % Temperature at State Point - 4


% Calculation of other constants for Saturated Liquid and Vapour
T_6 = XSteam('Tsat_p', p_1); % Saturated Temperature at Pressure 1
s_5 = XSteam('sL_p', p_1); % Saturated Liquid Entropy at Pressure 1
s_6 = XSteam('sV_p', p_1); % Saturated Vapour Entropy at Pressure 1
h_5 = XSteam('hL_p', p_1); % Saturated Liquid Enthalpy at Pressure 1
h_6 = XSteam('hV_p', p_1); % Saturated Vapour Enthalpy at Pressure 1
T_5 = T_6;


%Plotting of the Saturation Line
T = linspace(1,560,1000);
for i = 1:length(T)
 s_f(i) = XSteam('sL_T' ,T(i)); % Saturated Liquid Entropy
 s_g(i) = XSteam('sV_T' ,T(i)); % Saturated Vapour Entropy
 h_f(i) = XSteam('hL_T' ,T(i)); % Saturated Liquid Enthalpy
 h_g(i) = XSteam('hV_T' ,T(i)); % Saturated Vapour Enthalpy

end


% Plotting T-S diagram for the Rankine Cycle
figure(1)
hold on
plot(s_f,T,'color','b','linewidth',2)
plot(s_g,T,'color','b','linewidth',2)
plot([s_1 s_2],[T_1 T_2], 'color', 'r', 'linewidth',3)
plot([s_2 s_3],[T_2 T_3], 'color', 'r', 'linewidth',3)
plot([s_3 s_4],[T_3 T_4], 'color', 'r', 'linewidth',3)
plot([s_4 s_5],[T_4 T_5], 'color', 'r', 'linewidth',3)
plot([s_5 s_6],[T_5 T_6], 'color', 'r', 'linewidth',3)
s1 = linspace(s_6,s_1,1000);
for j = 1:length(s1)
 Tc(j) = XSteam('T_ps',p_1,s1(j));
end
plot(s1,Tc,'color','r','linewidth',3)
text(s_1 + 0.1, T_1, '1')
text(s_2 + 0.1, T_2, '2')
text(s_3, T_3 - 20, '3')
text(s_4, T_4 + 20, '4')
title('Temperature Vs Entropy')
xlabel('Entropy (KJ/kg-K)')
ylabel('Temeperature (°C)')
legend('Saturation Curve')


% Plotting H-S diagram for the Rankine Cycle
figure(2)
hold on
plot(s_f,h_f,'color','b','linewidth',2)
plot(s_g,h_g,'color','b','linewidth',2)
plot([s_1 s_2],[h_1 h_2],'color','r','linewidth',3)
plot([s_2 s_3],[h_2 h_3],'color','r','linewidth',3)
plot([s_3 s_4],[h_3 h_4],'color','r','linewidth',3)
hc = linspace(h_4,h_5,100);
for k = 1:length(hc)
 s_c(k) = XSteam('s_ph',p_1,hc(k));
end
plot(s_c,hc,'color','r','linewidth',3)
plot([s_5 s_6],[h_5 h_6],'color','r','linewidth',3)
for l = 1:length(s1)
 h_c(l) = XSteam('h_ps',p_1,s1(l));
end
plot(s1,h_c,'color','r','linewidth',3)
text(s_1 + 0.1,h_1,'1')
text(s_2 + 0.1,h_2,'2')
text(s_3,h_3 - 100,'3')
text(s_4,h_4 + 200,'4')
title('Enthalpy Vs Entropy')
xlabel('Entropy (KJ/kg-K)')
ylabel('Enthalpy (KJ/kg)')
legend('Saturation Curve')


% Displaying Results of the Rankine Cycle
disp('RESULTS OF THE RANKINE CYCLE');
fprintf('At State Point - 1:n');
fprintf('p_1: %8.3f barn', p_1);
fprintf('T_1: %8.3f °Cn', T_1);
fprintf('h_1: %8.3f KJ/kgn', h_1);
fprintf('s_1: %8.3f KJ/kgKnn', s_1);
fprintf('At State Point - 2:n');
fprintf('p_2: %8.3f barn', p_2);
fprintf('T_2: %8.3f °Cn', T_2);
fprintf('h_2: %8.3f kJ/kgn', h_2);
fprintf('s_2: %8.3f kJ/kgKn', s_2);
fprintf('x_2: %8.3fnn', x_2);
fprintf('At State Point - 3:n');
fprintf('p_3: %8.3f barn', p_3);
fprintf('T_3: %8.3f °Cn', T_3);
fprintf('h_3: %8.3f kJ/kgn', h_3);
fprintf('s_3: %8.3f kJ/kgKnn', s_3);
fprintf('At State Point - 4:n');
fprintf('p_4: %8.3f barn', p_4);
fprintf('T_4: %8.3f °Cn', T_4);
fprintf('h_4: %8.3f KJ/kgn', h_4);
fprintf('s_4: %8.3f kJ/kgKnn', s_4);
fprintf('Turbine Work: %8.3f kJ/kgn', W_T);
fprintf('Pump Work: %8.3f kJ/kgn', W_P);
fprintf('Work Net: %8.3f kJ/kgn', W_NET);
fprintf('Efficiency: %8.3f percentn', T_EFF);
fprintf('Specific Steam Consuption: %8.3f kJ/kWhn', S_S_C);
fprintf('B_W_R: %8.3f °Cn', B_W_R);
Explanation of the above code
1. Initially the XSteam data is used to extract steam and liquid properties of enthaly, entropy at specific pressure and temperatures for saturated liquid, saturated vapour conditions etc.
2. The program requires the input pressure (p_1 in bar) at state point 1 ( Turbine Inlet) ,temperature at same point (in degree celcius) and pressure at Condenser Inlet (point 2).
3. After this, with the help of these inlets & from XSteam data, the program calculates all the 4 state points of the Rankine cycle.
4. Now the XSteam data works as, h1 = XSteam('h_pT' , p1 , T1) it returns the enthalpy of water at given pressure and temperature in bar and degree celcius respectively.
5. As we extract the data, we use thermodynamic relation to further find the state points and extract their data from XSteam
which are mentioned after studying the Rankine cycle.
6. Here sf and sg, hf and hg, where f and g stands for saturated liquid and saturated vapour respectively are calculated after
studying the plots of the Rankine Cycle and extracting data from XSteam file.
7. Further, the net work, work done by turbine, work done to run the pump, heat in and heat out are calculated using standard thermodynamic relations
8. Eventually the efficiency and specific steam consumption of the Rankine cycle is calculated from thermodynamic relations and mentioning them in program using relations.
9. T, s and h are extracted at vapour and liquid line for plotting purpose , after 4th point for the variation you observe in the
plot .
10. Saturation curve is plotted in red for saturated liquid and saturated gas in T-s diagram and h-s diagram.
11. Plots of T vs s and h vs s are created from all the points obtained from the program using the plot command and mentioning all the lables, linewidth, color and the title to the plots.
12. The plot changes as the user input changes for the above mentioned inputs.
13. Results are displayed in the command window by using sprint command.
OUTPUTS OF THE CODE:
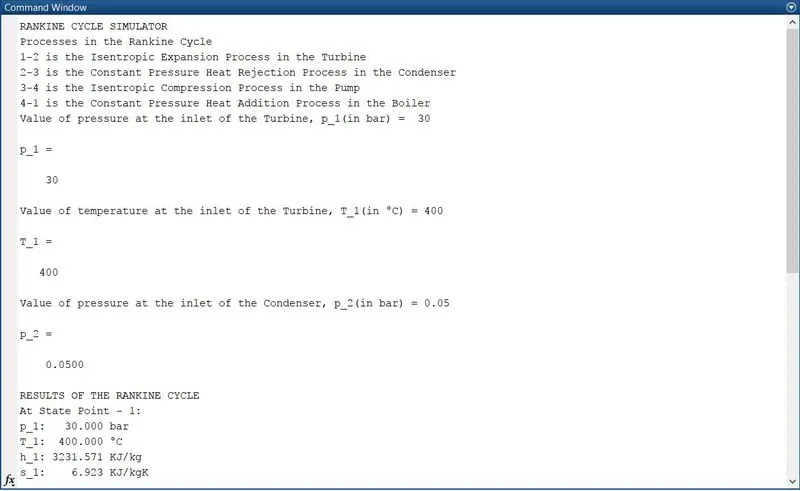
Required Inputs for this project are as follows,
Turbine Inlet temperature = 400° C
Turbine Inlet Pressure = 30 bars
Turbine Outlet Pressure = 0.05 bars = Condenser Inlet Pressure
Considering all the above inputs the plots generated by the code are as follows,
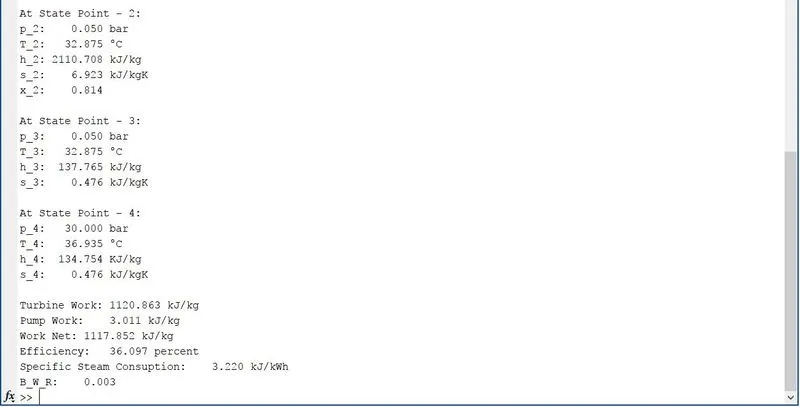
The ouput from the Command Window
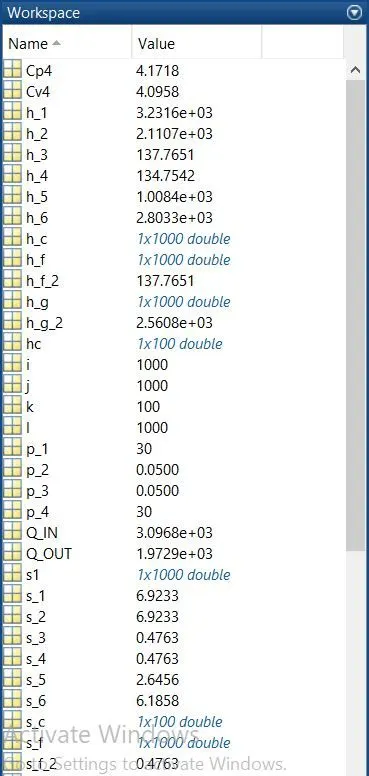
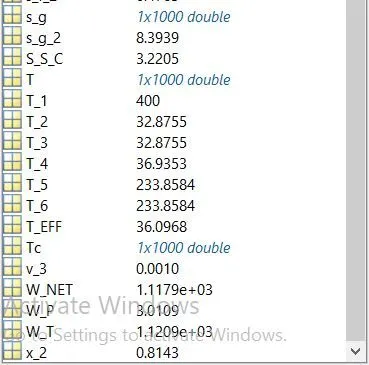
The ouput from the Workspace
CONCLUSION: Eventually, in this project we have succesfully created a code that simulates the Rankine Cycle and also we have succesfully ran the code producing the intended results, which are plots. We have used the input values provided in the challenge to produce the intended results which are as follows,
Turbine Work: 1120.863 kJ/kg
Pump Work: 3.011 kJ/kg
Work Net: 1117.852 kJ/kg
Efficiency: 36.097 percent
Specific Steam Consuption: 3.220 kJ/kWh
Back Work Ratio: 0.003