Project 2 - Development of TFT Cluster Speedometer Software Component
V&V Workflow for TFT Cluster Speedometer Software Component
Aim:
The aim of the Verification and Validation (V&V) workflow for the TFT Cluster Speedometer Software Component was to thoroughly validate and verify the Simulink model, ensuring its correctness, compliance with requirements, and reliability in real-world scenarios.
Theory:
Verification:
The process of evaluating a system or component during or at the end of the development process to determine whether it satisfies the specified requirements.
Validation:
The process of evaluating a system or component during or at the end of the development process to determine its effectiveness and suitability.
Procedure:
<!-- [if !supportLists]-->1. <!--[endif]-->Simulink Model Development:
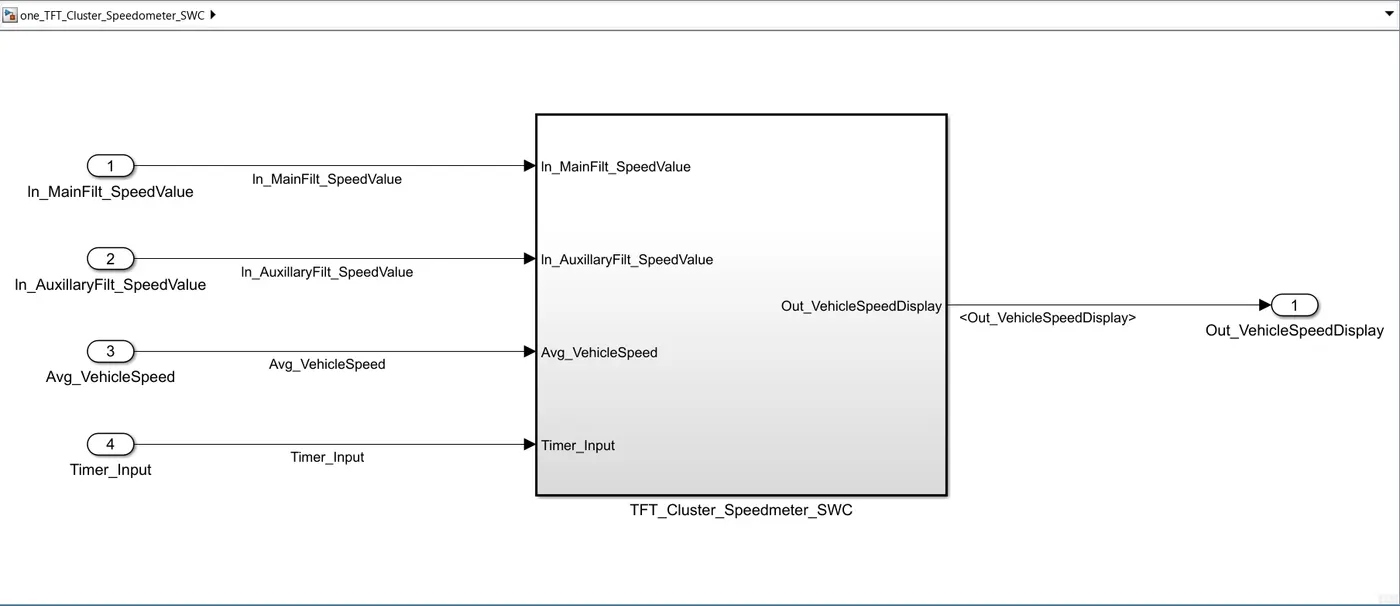
The Simulink model was developed based on the provided requirements for the TFT Cluster Speedometer Software Component.
The model includes components for calculating TFT Display Speed, main data filtering, auxiliary data filtering, and TFT speed output. And the Simulink model named “one_TFT_Cluster_Speedometer_SWC.slx” attached below
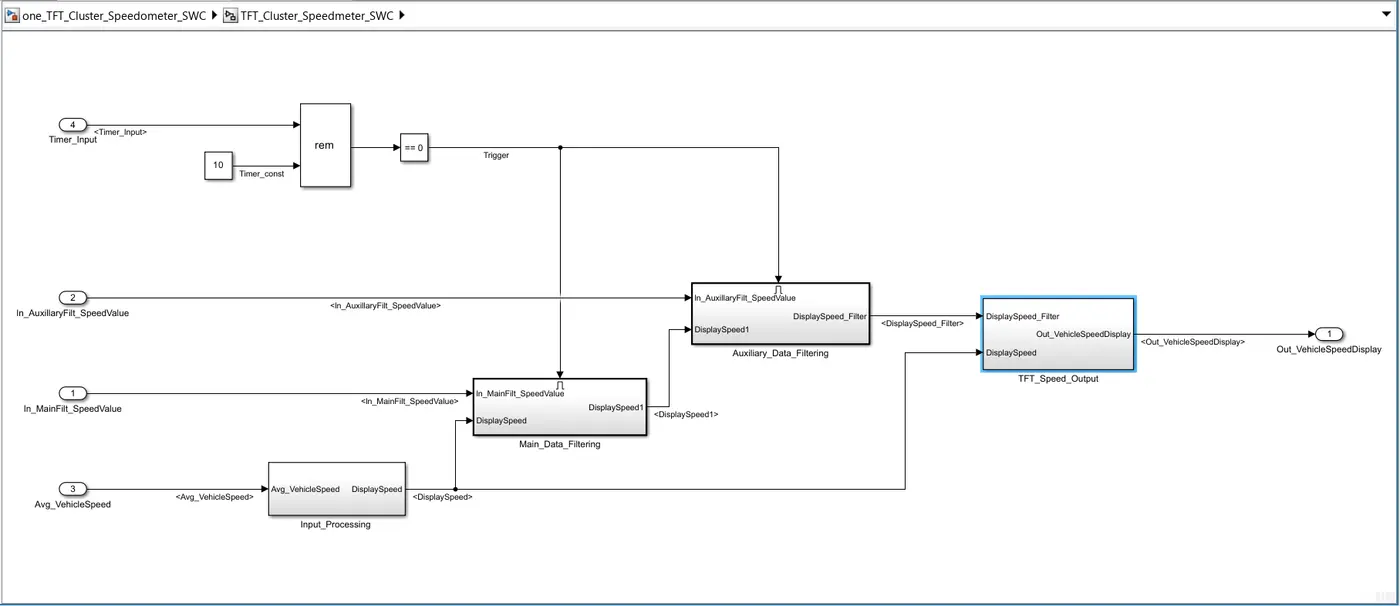
1.1 Calculating TFT Display Speed:
Average Vehicle Speed would be displayed only if its between 2 kmph & 250 kmph. Any value outside this range will be discarded by its lower limit & upper limit
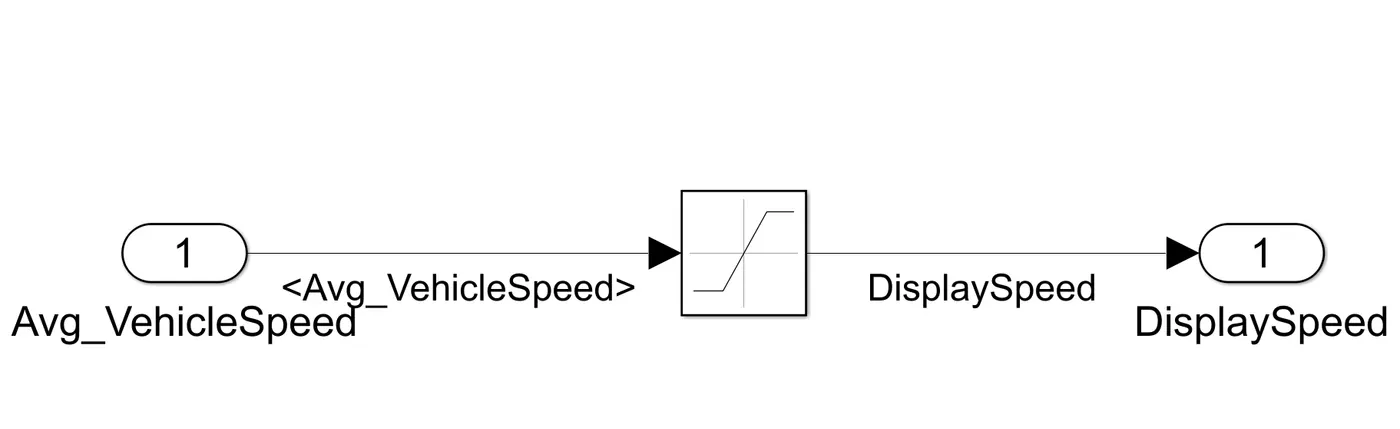
When Average Vehicle Speed is < 2 xss=removed>
When Average Vehicle Speed is in between 2 kmph & 250 kmph, DisplaySpeed = Average Vehicle Speed
When Average Vehicle Speed is > 250 kmph, DisplaySpeed = 250 kmph
1.2 Main Data Filtering:
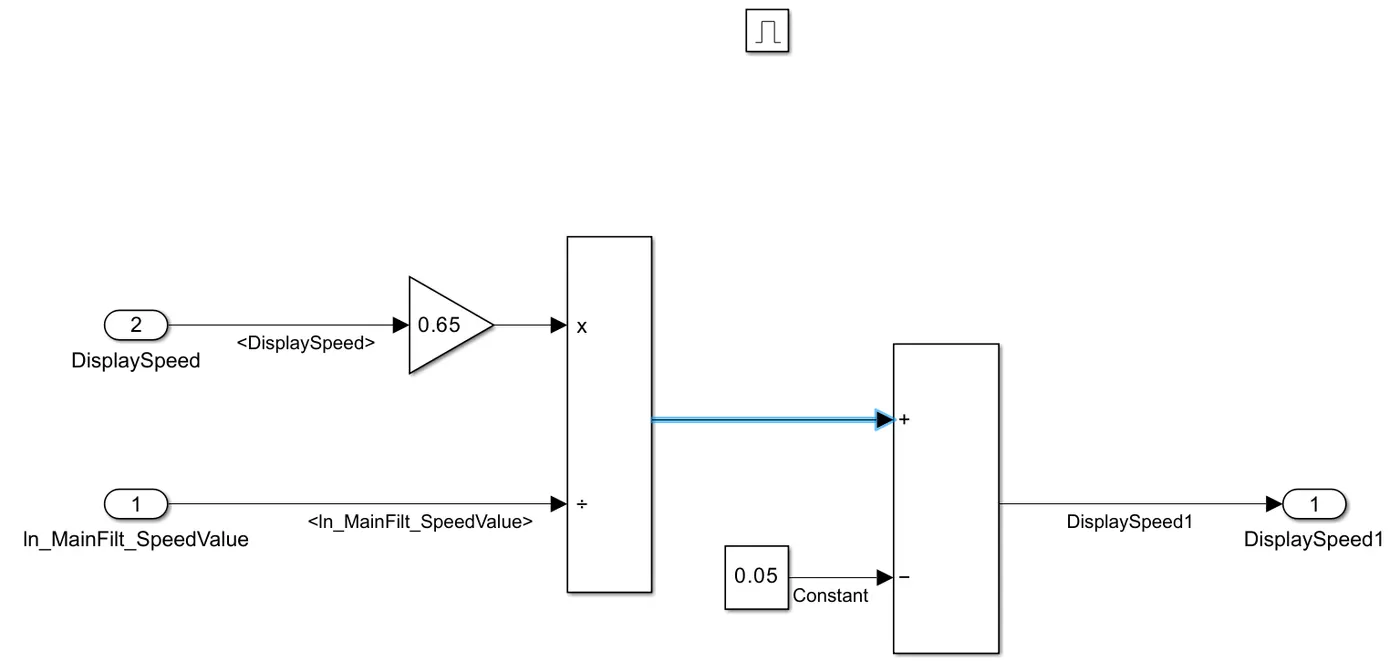
Main Data Filtering subsystem will be activated for every 10th millisecond
DisplaySpeed1 (t) = ((DisplaySpeed (t) x 0.65)/ Main Filter Speed Value) 0.05
1.3 Auxiliary Data Filtering:
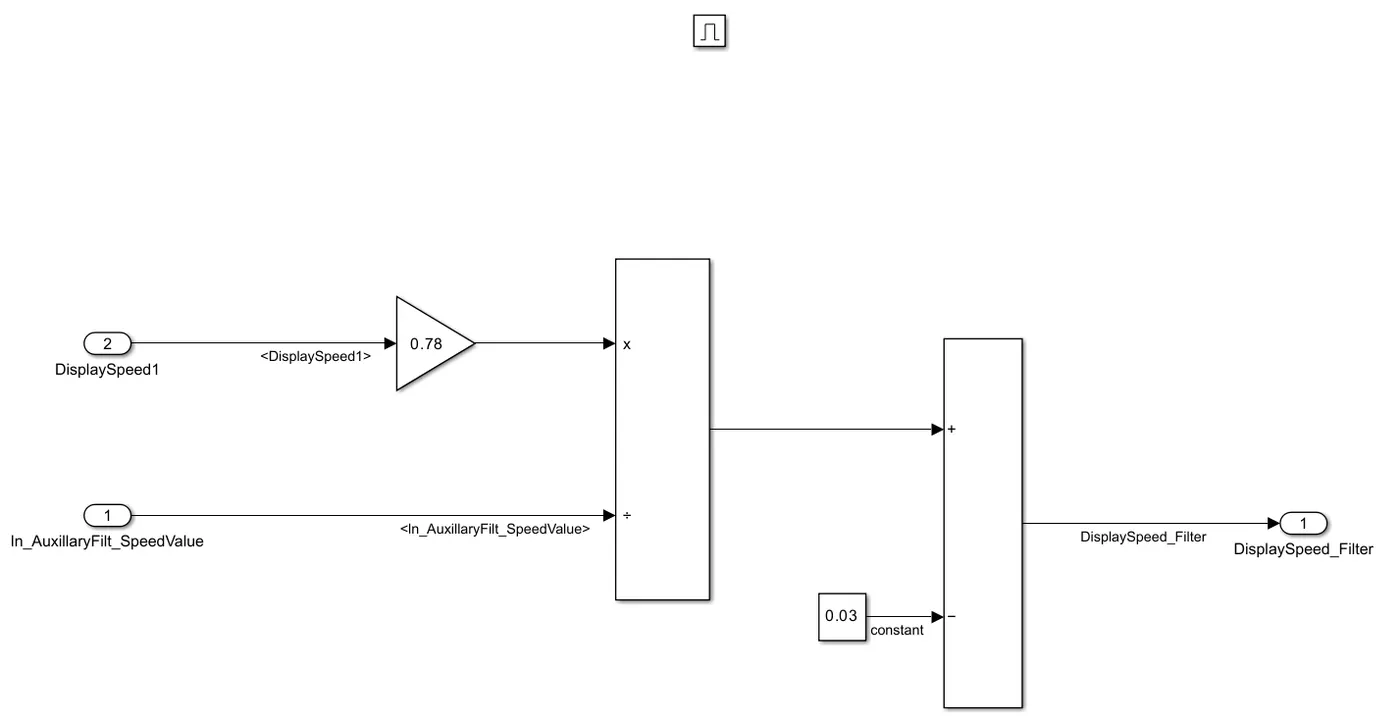
Auxiliary Data Filtering subsystem will be activated for every 10th millisecond
DisplaySpeed_Filter (t) = ((DisplaySpeed1 (t) x 0.78)/ Auxillary Filter Speed Value) - 0.03
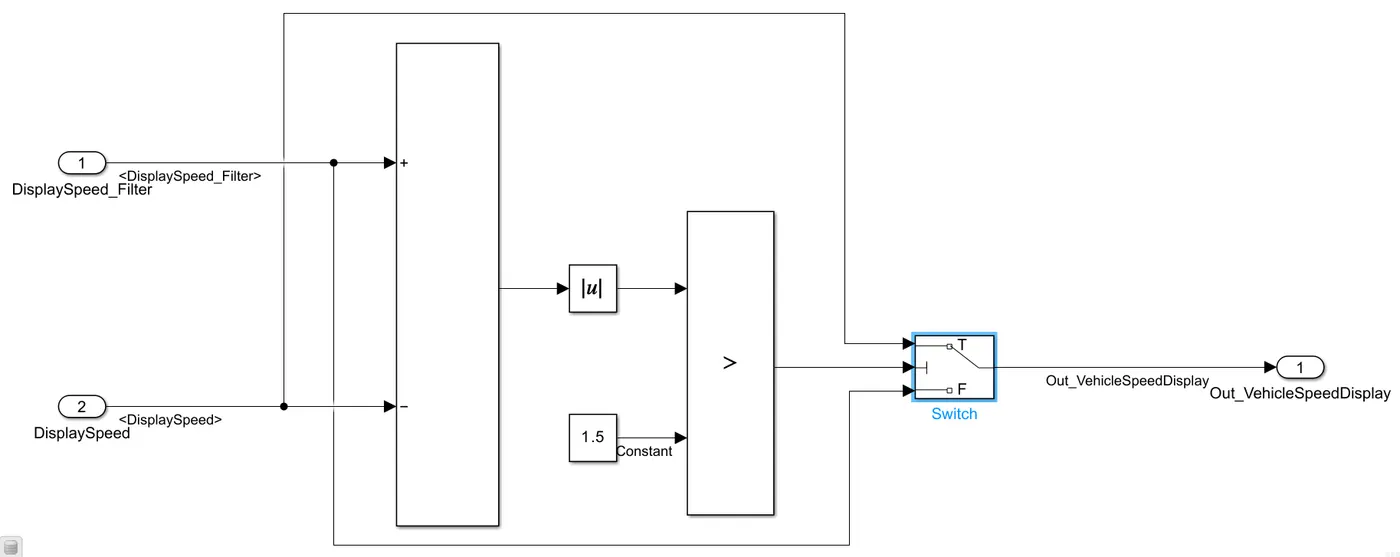
1.4 TFT Speed Output:
If |(DisplaySpeedFilter - DisplaySpeed)| > 1.5
{
Vehicle Speed Display = DisplaySpeed
}
else
{
Vehicle Speed Display = DisplaySpeed Filter
}
Verification and Validation Steps:
<!-- [if !supportLists]-->2. <!--[endif]-->SLDD (Simulink Data Dictionary) File:
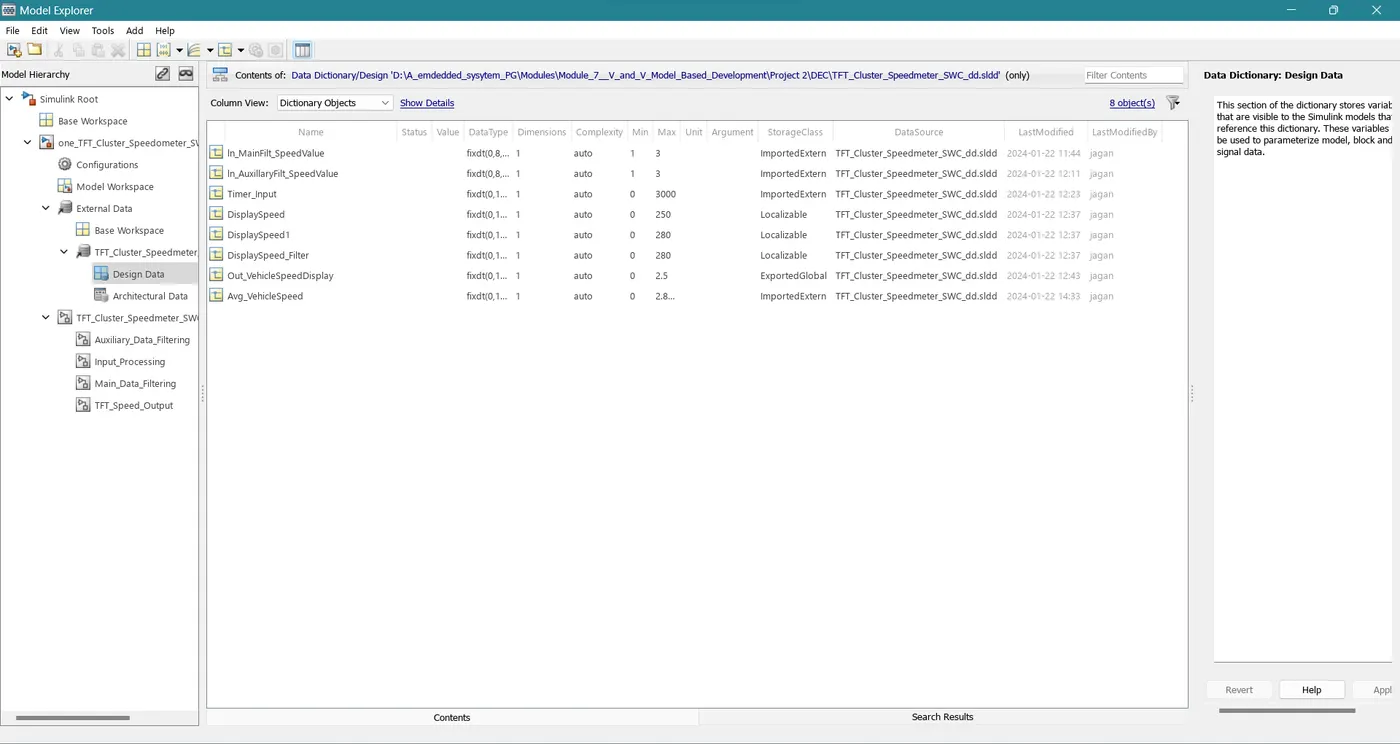
The SLDD file provides a comprehensive description of the Simulink model, detailing its architecture, components, and functionality. And the Simulink Data Dictionary file named “TFT_Cluster_Speedmeter_SWC_dd.sldd” attached below
<!-- [if !supportLists]-->3. <!--[endif]-->Requirement Tagging Report:
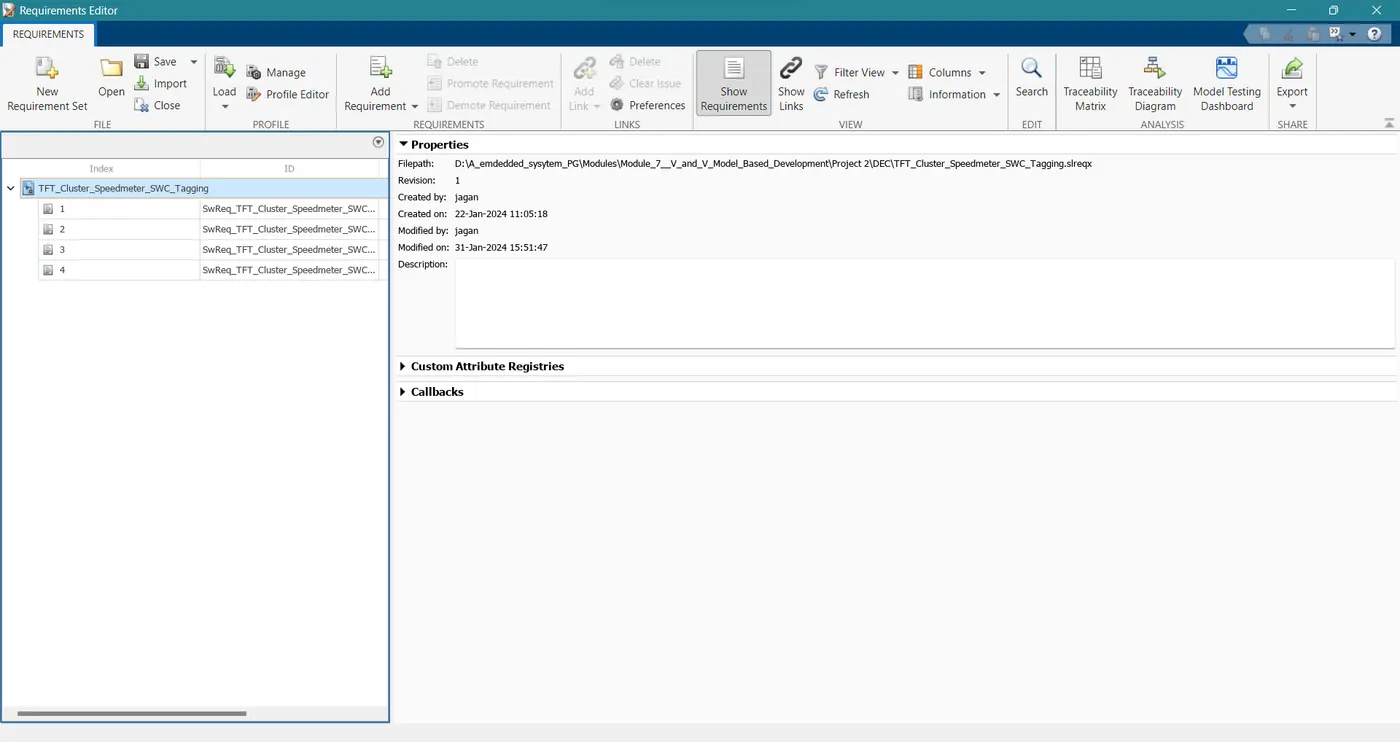
Each component of the model was tagged with relevant requirements to ensure traceability and verification against specified criteria. And the Requirement Tagging Report file named “3_TFT_Cluster_Speedmeter_SWC_ Requirement_Tagging_Report.pdf” attached below
<!-- [if !supportLists]-->4. <!--[endif]-->Fixed-Point Tool Application:
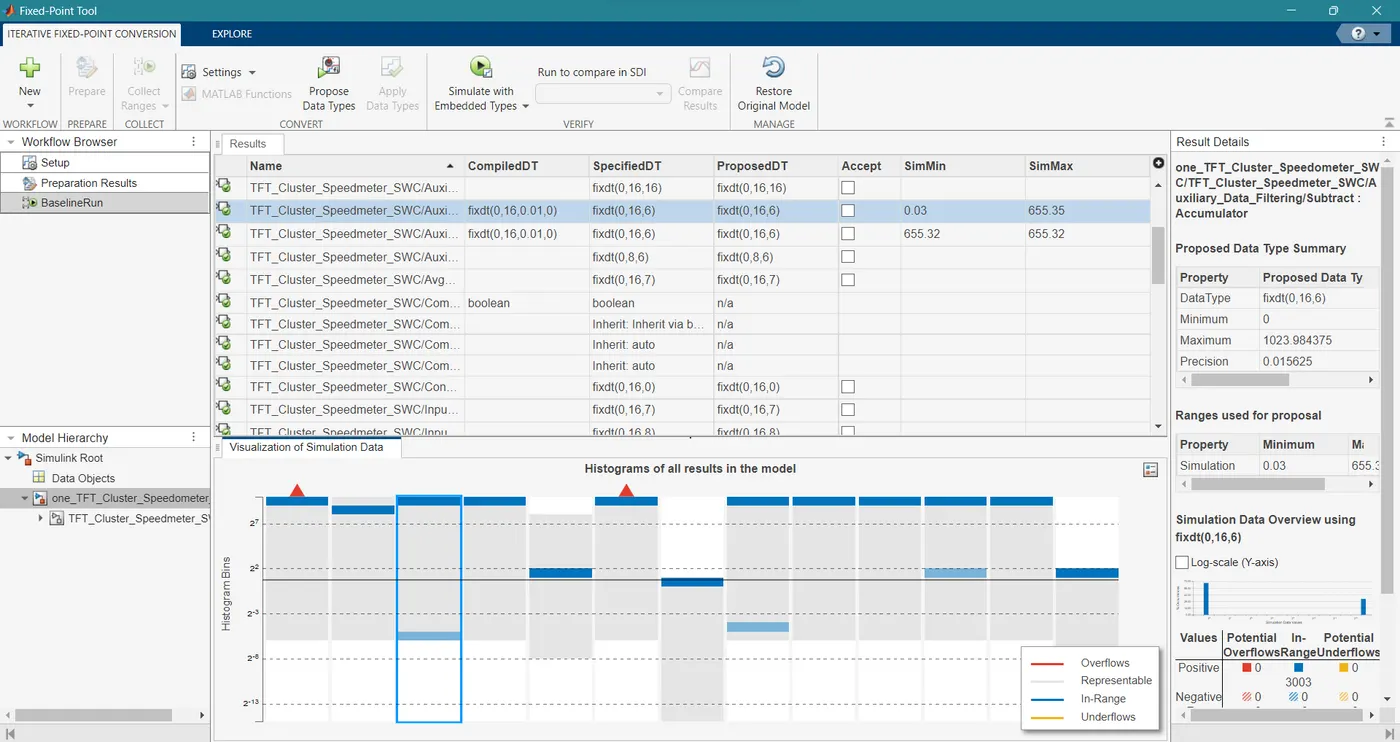
The Fixed-Point Tool was applied to ensure that numerical representations in the model adhere to fixed-point data types, optimizing precision and performance.
<!-- [if !supportLists]-->5. <!--[endif]-->Model Advisor - JMAAB Compliance Report:
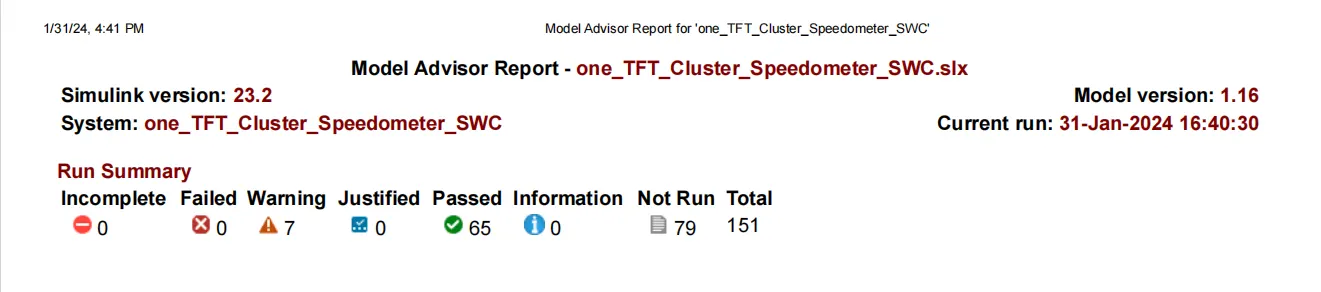
The Model Advisor was used to assess compliance with the Joint Industry Council (JMAAB) standards, ensuring best practices in model development. And the Model Advisor - JMAAB Compliance Report file named “5_Model_advisor_JMAAB_compliance_report.pdf” is attached below
<!-- [if !supportLists]-->6. <!--[endif]-->SLDV (Simulink Design Verifier) Design Error Detection Report:
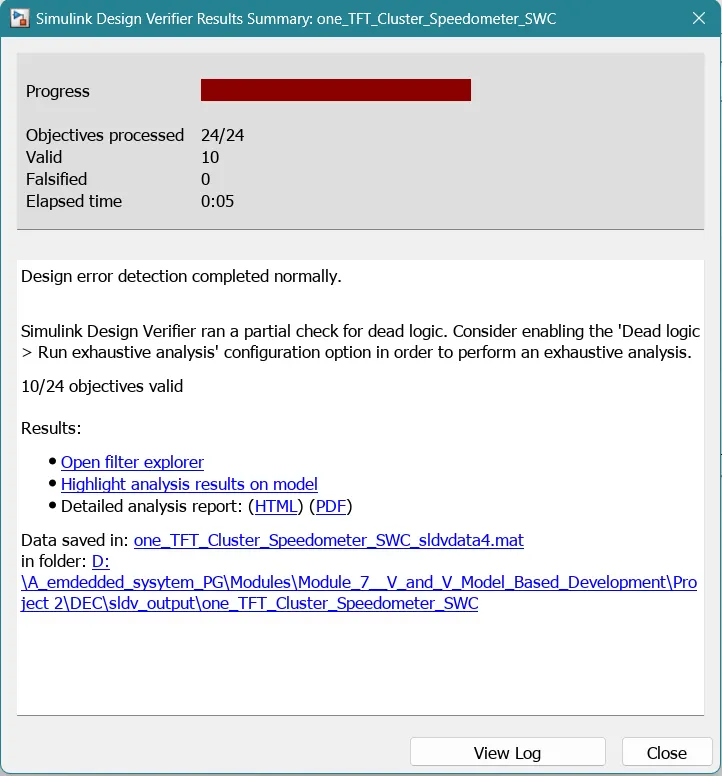
SLDV was applied to detect potential design errors in the model, ensuring that it meets the specified requirements. And the SLDV (Simulink Design Verifier) Design Error Detection Report file named “6_SLDV_Design_error_detection_report.pdf” is attached below
<!-- [if !supportLists]-->7. <!--[endif]-->Functional Test Case, MIL, SIL Harness, and Coverage Reports:
Harness MODEL:
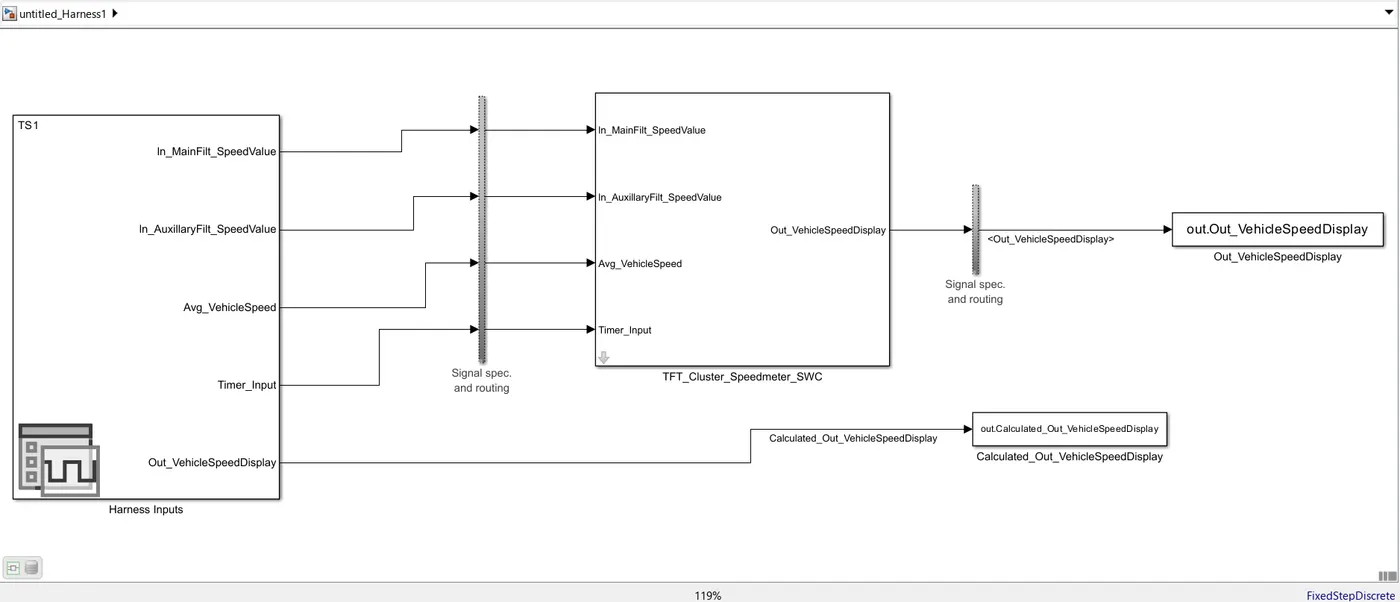
Functional test cases were developed, and Model-in-the-Loop (MIL) and Software-in-the-Loop (SIL) harness models were created to perform testing. Coverage reports ensured that the model was thoroughly exercised. And the Functional Test Case, MIL, SIL Harness, and Coverage Reports file named “7_Functional_test_cases.xls”, “7_MIL_Harness1_cov_Report.pdf” aand “7_SIL_Harness1_cov_Report.pdf” attached below
<!-- [if !supportLists]-->8. <!--[endif]-->SLDV Test Generation Report:
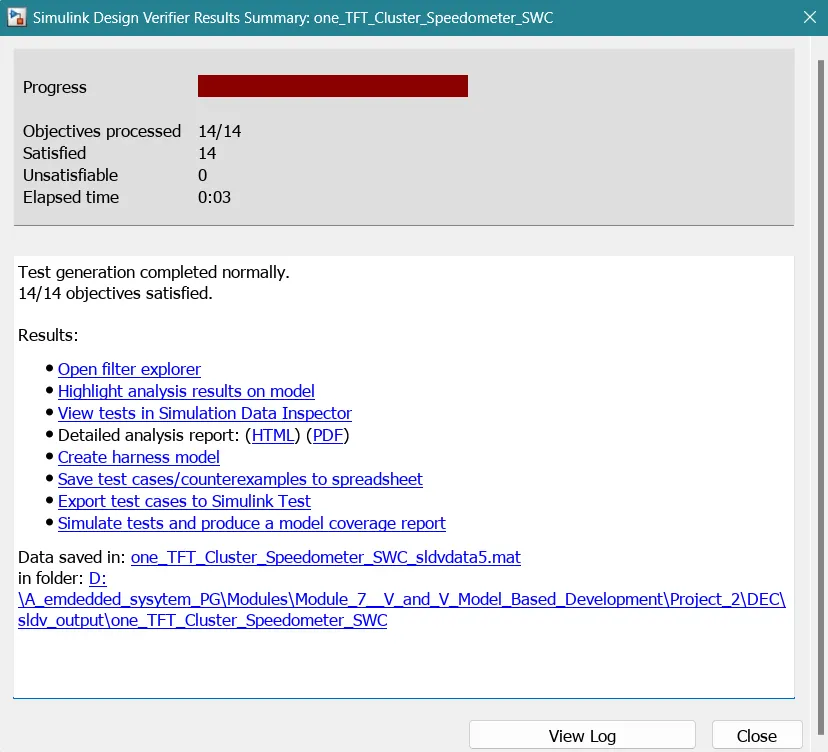
SLDV was utilized to automatically generate additional test cases, expanding the test coverage and enhancing the reliability of the model. And the test report file named “8_SLDV_test_generation_report.pdf” have attached below.
<!-- [if !supportLists]-->9. <!--[endif]-->Auto-Code Generation and Code Analysis Reports:
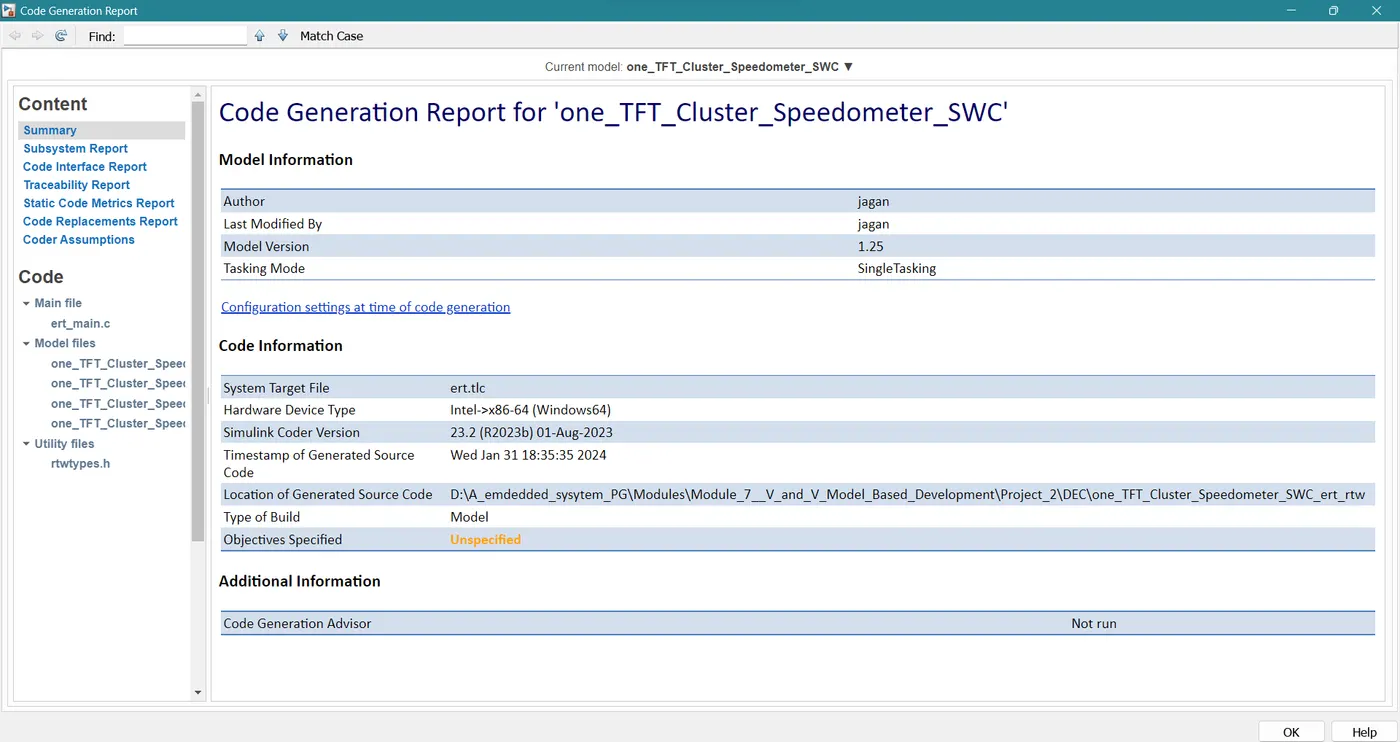
The Simulink model was translated into C and H codes using auto-code generation. Code analysis tools, such as Polyspace, were applied to identify potential bugs and ensure code reliability. And .h and .c files named “9_one_TFT_Cluster_Speedometer_SWC.h” and “9_one_TFT_Cluster_Speedometer_SWC.c” are atteched below
<!-- [if !supportLists]-->10. <!--[endif]-->Poly space analysis report / outputs
Polyspace Bug Finder Report:
As I dont have the Polyspace licence, only the process for generating reports using Polyspace Bug Finder and Polyspace Code Prover is outlined below:
<!-- [if !supportLists]-->1. <!--[endif]-->Open MATLAB and navigate to the directory containing the code.
<!-- [if !supportLists]-->2. <!--[endif]-->Access the Polyspace Bug Finder interface by entering "polyspace" in the MATLAB command window.
<!-- [if !supportLists]-->3. <!--[endif]-->Create a new project and assign it a name.
<!-- [if !supportLists]-->4. <!--[endif]-->Choose "MATLAB" as the programming language.
<!-- [if !supportLists]-->5. <!--[endif]-->In "Project Settings," specify the files for analysis and additional options.
<!-- [if !supportLists]-->6. <!--[endif]-->Initiate the analysis by clicking "Run Analysis."
<!-- [if !supportLists]-->7. <!--[endif]-->Once complete, Polyspace Bug Finder generates a report listing potential bugs.
<!-- [if !supportLists]-->8. <!--[endif]-->View the report by selecting "View Report" in the Polyspace Bug Finder interface.
<!-- [if !supportLists]-->9. <!--[endif]-->The report displays potential bugs with detailed information and recommendations.
<!-- [if !supportLists]-->10. <!--[endif]-->Export the report in PDF, HTML, or XML formats by selecting "Export Report."
<!-- [if !supportLists]-->11. <!--[endif]-->Review and address identified bugs to enhance code quality and reliability.
Polyspace Code Prover Output:
<!-- [if !supportLists]-->1. <!--[endif]-->Open MATLAB and navigate to the code directory.
<!-- [if !supportLists]-->2. <!--[endif]-->Access the Polyspace Code Prover interface by typing "psrun" in the MATLAB command window.
<!-- [if !supportLists]-->3. <!--[endif]-->Create a new project and assign it a name.
<!-- [if !supportLists]-->4. <!--[endif]-->Choose "MATLAB" as the programming language.
<!-- [if !supportLists]-->5. <!--[endif]-->In "Project Settings," select files for analysis and specify additional options.
<!-- [if !supportLists]-->6. <!--[endif]-->Start the analysis by clicking "Run Analysis."
<!-- [if !supportLists]-->7. <!--[endif]-->After completion, Polyspace Code Prover generates output indicating the presence or absence of run-time errors.
<!-- [if !supportLists]-->8. <!--[endif]-->View the output by selecting "View Results" in the Polyspace Code Prover interface.
<!-- [if !supportLists]-->9. <!--[endif]-->The output indicates if the code is free of run-time errors or identifies detected errors.
<!-- [if !supportLists]-->10. <!--[endif]-->Save the output in PDF, HTML, or XML formats by selecting "Export Results."
<!-- [if !supportLists]-->11. <!--[endif]-->Review and address any errors flagged by Polyspace Code Prover for code correctness and reliability.
Following these steps allows for the utilization of Polyspace Bug Finder and Polyspace Code Prover to enhance the quality and reliability of MATLAB code.
<!-- [if !supportLists]-->12. <!--[endif]-->Test Manager Reports – Baseline & Back-to-Back Testing:
Baseline and back-to-back testing were performed using Simulink Test Manager. Test Manager recorded the results of test cases, ensuring that the model behaved as expected before and after modifications.
<!-- [if !supportLists]-->a) <!--[endif]-->Baseline Testing Report:
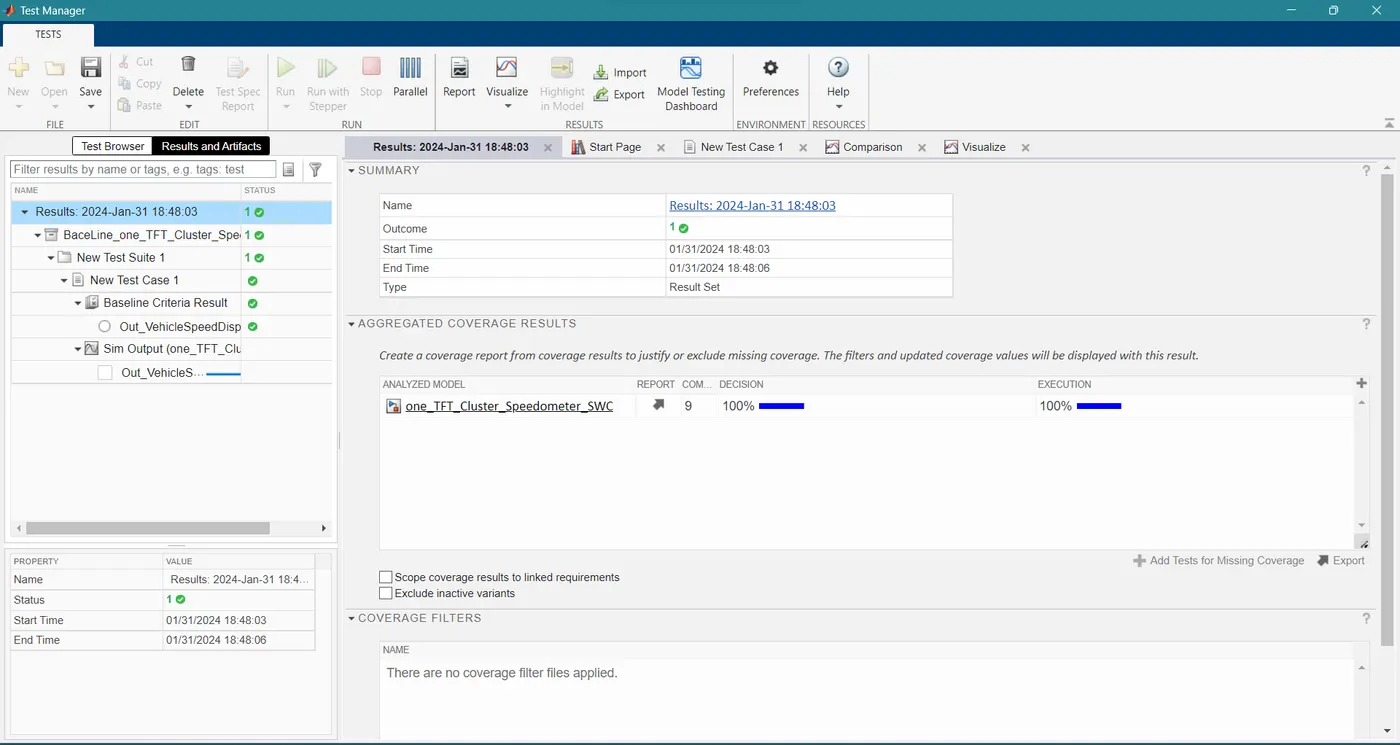
The Baseline Testing Report details the results of running a suite of test cases on the initial version of the Simulink model. This report serves as a reference for future comparisons. And the Baseline Testing Report file named “11_Baseline_test_report.pdf” have attached below
<!-- [if !supportLists]-->b) <!--[endif]-->Back-to-Back Testing Report:
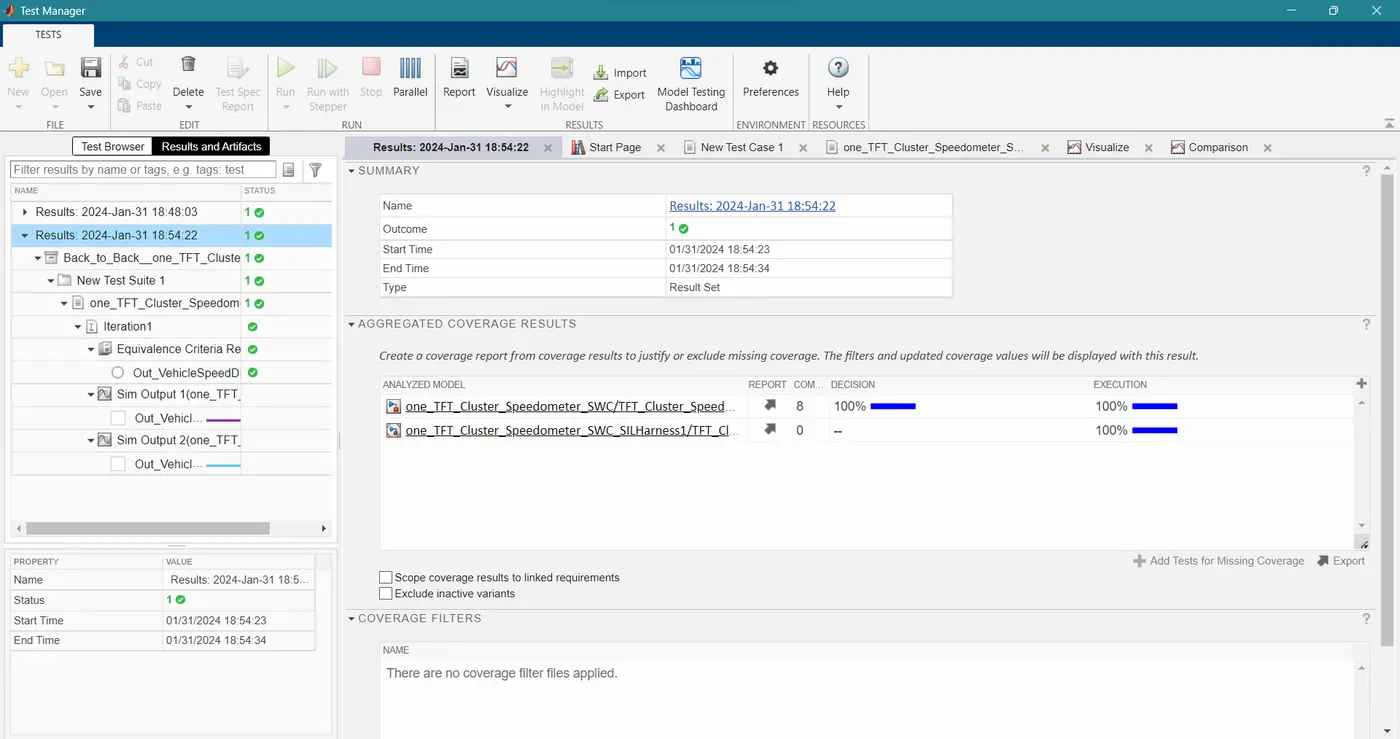
The Back-to-Back Testing Report compares the results of the test cases between the initial version (baseline) and the modified version of the Simulink model. This report highlights any differences or unexpected behavior introduced by the modifications. And Back to back Harness Test Design verifier report and Back-to-Back Testing Report files named “11_Back_to_back_Harness1_TestDesign_verifier_report.pdf” and “11_Back_To_Back_test_report.pdf”
Result:
The verification and validation processes confirmed the correctness, reliability, and compliance of the TFT Cluster Speedometer Software Component Simulink model with specified requirements.
Conclusion:
The V&V workflow ensured that the Simulink model meets the required standards, adheres to best practices, and behaves predictably under various conditions. The model is considered validated and ready for deployment in real-world applications.
Key Learnings:
<!-- [if !supportLists]-->l <!--[endif]-->Traceability: Requirement tagging and traceability are essential for ensuring that each component of the model aligns with specified requirements.
<!-- [if !supportLists]-->l <!--[endif]-->Comprehensive Testing: The combination of baseline testing, back-to-back testing, and automated test generation provides thorough coverage, identifying potential issues and ensuring robustness.
<!-- [if !supportLists]-->l <!--[endif]-->Code Analysis: Applying tools such as Polyspace for code analysis helps identify potential bugs and enhances the overall reliability of the generated code.