Project 2
Model Vehicle Details:
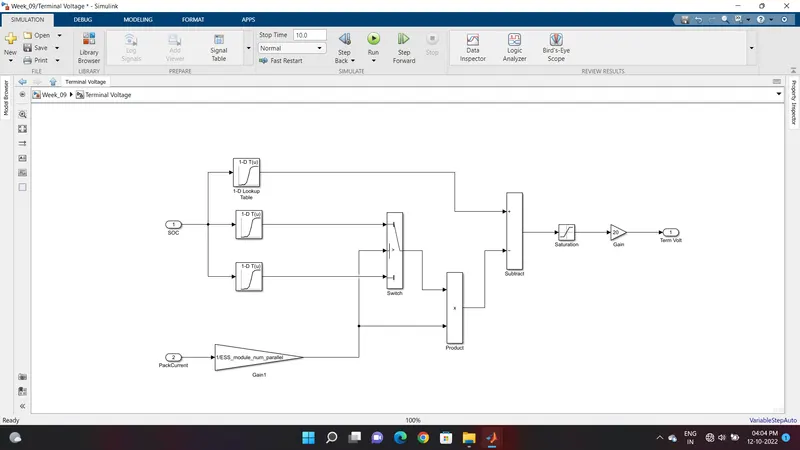
Terminal voltage:
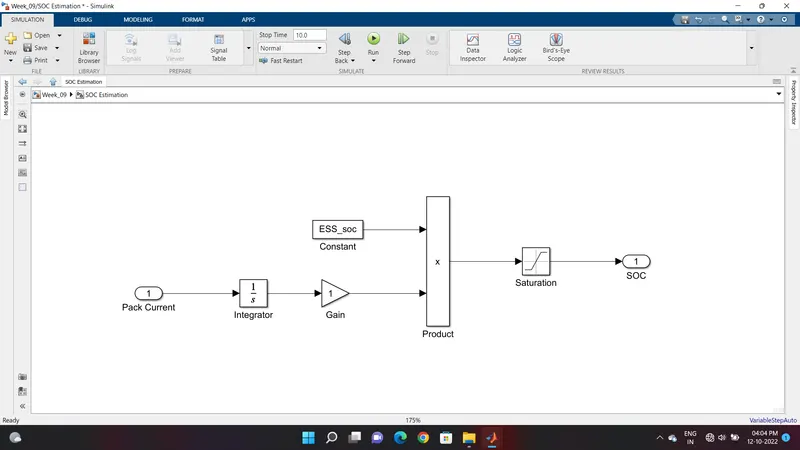
SOC Estimate:
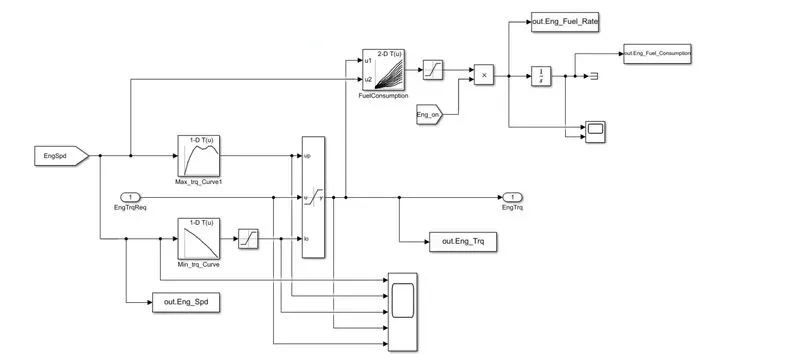
Engine:
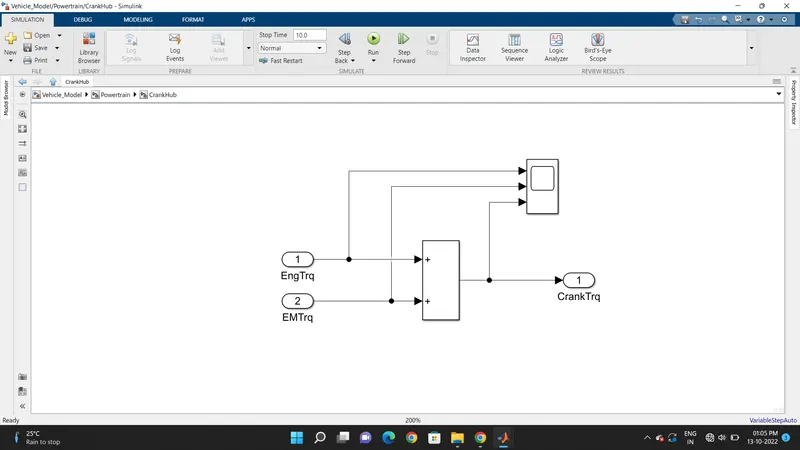
CrankHub:
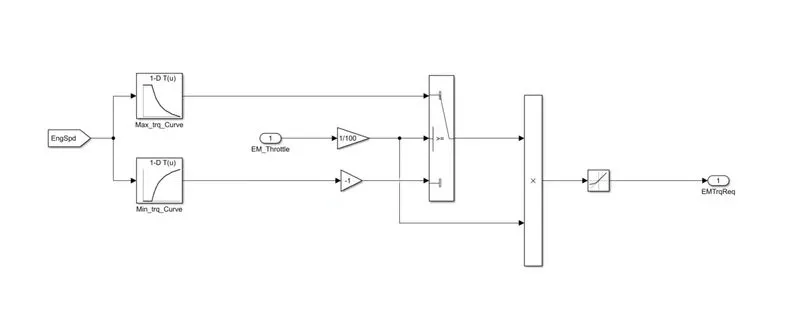
EM Control Unit:
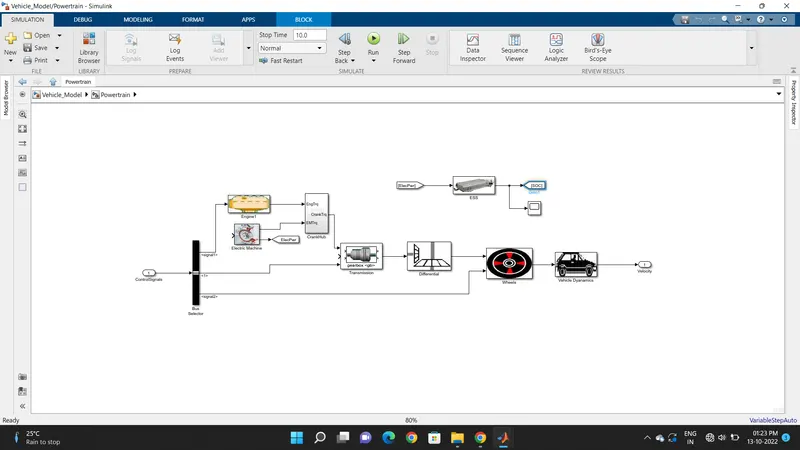
Powertrain:
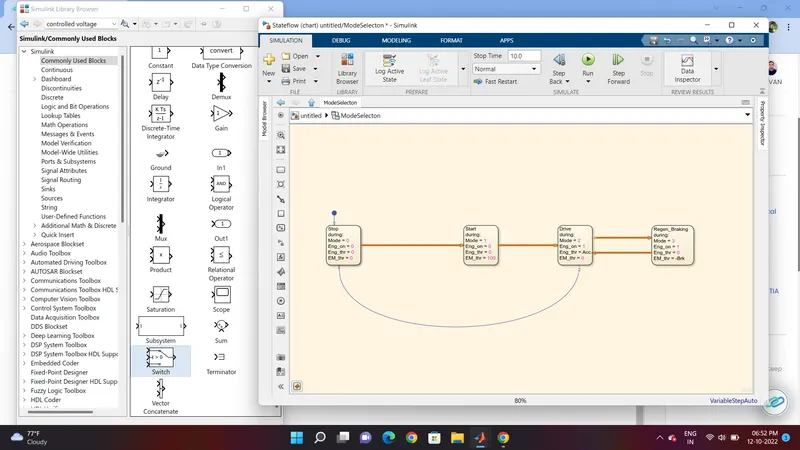
Mode Selection:
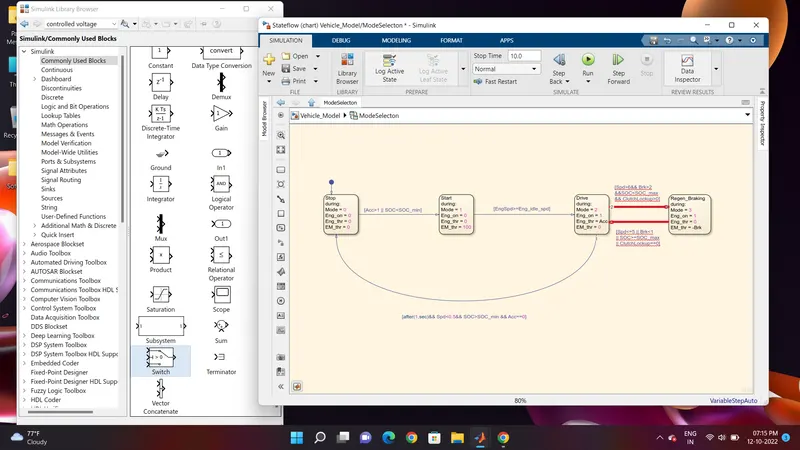
Controller:
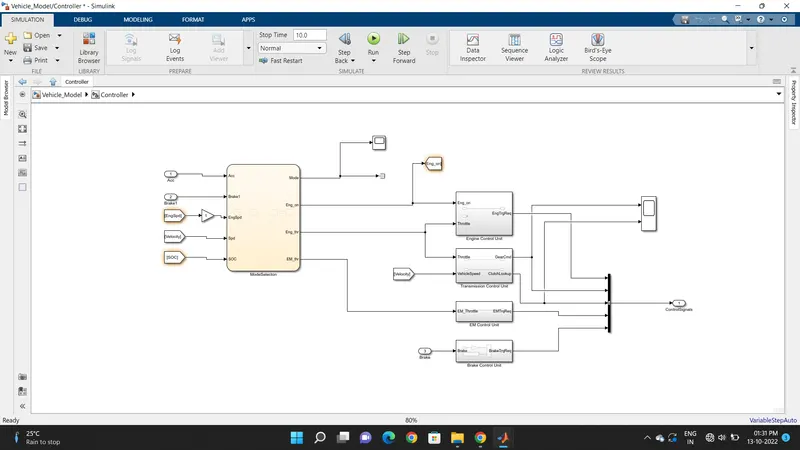
Vehicle Model:
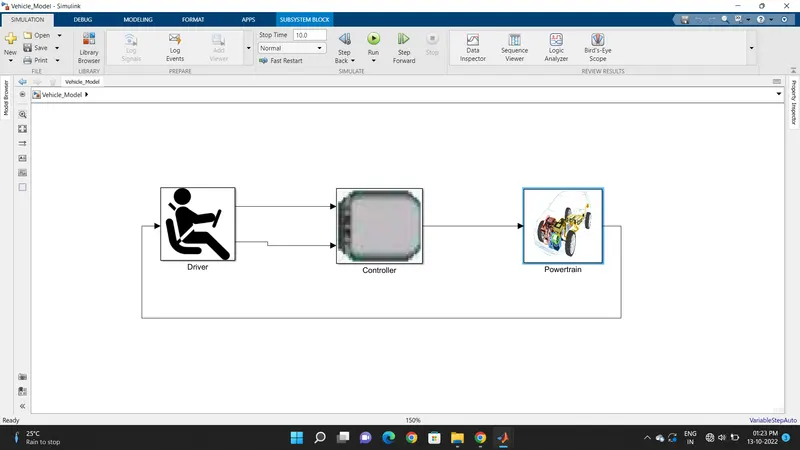
Generate The Matlab Code:
%%data from simulink
Time=out.tout; %time
A_pedal=out.Acc_Pdl; %Acclerator position
B_pedal=out.Brk_Pdl; %Brake pedalPosition
Ef=out.Eng_Fuel_Consumption; %Fuel Data
Es=out.Eng_Spd; %Engine data
Et=out.Eng_Trq; %Engine Trq data
Gc=out.Gear_Cmd; %Gear com. data
Tin=out.Trans_In_Spd*30/pi; %Transmission I speed
Tout=out.Trans_Out_Spd*30/pi; %Transmission Out
Dis=out.Veh_Dist; %distance during drive
V=out.Veh_Spd; %Vehicle speed
M_tr=out.Mtrq; %Motor torque
M_spd=out.MSpeed;%Motor Speed
Mp=out.Mpwr;%Motor power
Volt=out.tvolt;%Terminal Voltage
Soc=out.Tsoc; %SOC
C=out.Pcurr; %Pack Current
Fu=out.Eng_Fuel_rate; %Fuel supply to the engine
Ws=out.wspeed; %Vehicle wheel Speed
Ws=Ws.Data(:,1);
Ws=Ws*30/pi;
Es=Es.Data(:,1)*30/pi; %Extracting data
Et=Et.Data(:,1); %Torque
Dis=Dis.Data(:,1)/1000; % changing distance
V=V.Data(:,1); %convert m/s to km/hr
Ef=Ef.Data(:,1);
M_tr=M_tr.Data(:,1); %Motor Torque
M_spd=M_spd.Data(:,1); %Motor Speed
Mp=(Mp.Data(:,1)/1000); %Motor power in KW
Volt=Volt.Data(:,1); %Pack Terminal Voltage
Soc=Soc.Data(:,1); %Soc of a battery pack
C=C.Data(:,1);%Pack Current
Fu=Fu.Data(:,1);
%%Calculating the drive cycle
Pw=(Et.*Es*pi/30)/1000; %Power in KW
rho_p=0.7197; %density of petrol
T_dis=Dis(end); %Total distance in Km
T_fuel=Ef(end); %Total Fuel consumed
Vol=(T_fuel/1000)/rho_p; %Total litre of fuel
Milage=T_dis/Vol;
%%Plotting the graph
figure(1)
subplot(3,1,1)
title('Speed of Different component with respect ot Time');
hold
plot(Time,Es); %Plotting Engine spd with respect to time
xlabel('Time in Seconds');
ylabel('Engine Speed in RPM');
subplot(3,1,2)
plot(Time,Tin,'Displayname','Transmission Input Speed');
hold
plot(Time,Tout,'Displayname','Transmissin Output Speed');
xlabel('Time in Seconds');
ylabel('Transmission Speed in RPM');
legend
subplot(3,1,3)
plot(Time,Ws);
xlabel('Time in Seconds');
ylabel('Wheel Speed in RPM');
hold off
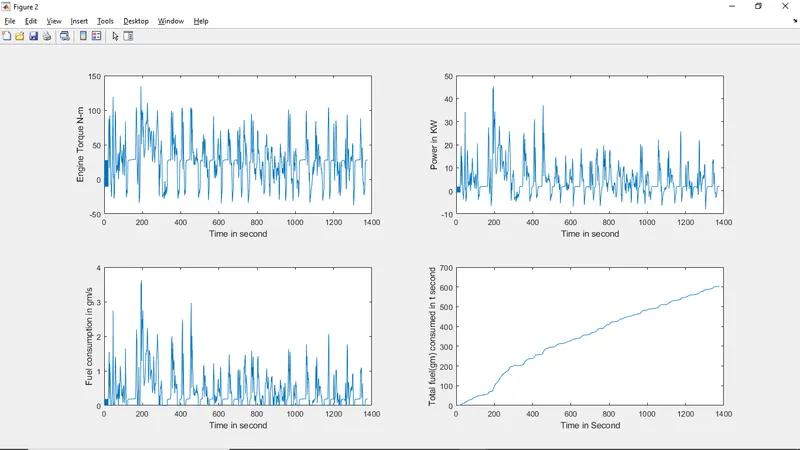
figure(2)
title('Engine Behavior with respect to Time');
hold
subplot(2,2,1)
plot(Time,Et);
xlabel('Time in second');
ylabel('Engine Torque N-m');
subplot(2,2,2)
plot(Time,Pw);
xlabel('Time in second');
ylabel('Power in KW')
subplot(2,2,3)
plot(Time,Fu);
xlabel('Time in second');
ylabel('Fuel consumption in gm/s');
subplot(2,2,4)
plot(Time,Ef);
xlabel('Time in Second');
ylabel('Total fuel(gm) consumed in t second');
hold off
figure(3)
subplot(2,2,1)
plot(Time,A_pedal,'Displayname','Acclrn press');
hold
plot(Time,B_pedal,'Displayname','Brake Press');
xlabel('Time in second');
ylabel('Percentage %');
legend
subplot(2,2,2)
plot(Time,Gc);
xlabel('Time in second');
ylabel('Gear number');
subplot(2,2,3)
plot(Time,Dis);
xlabel('Time in second');
ylabel('Distance in Km');
subplot(2,2,4)
plot(cyc_time,cyc_vel,'Displayname','Desired Speed');
hold on
plot(Time,V,'Displayname','Actual Speed');
xlabel('Time in Second');
ylabel('Velocity in m/s');
legend
hold off
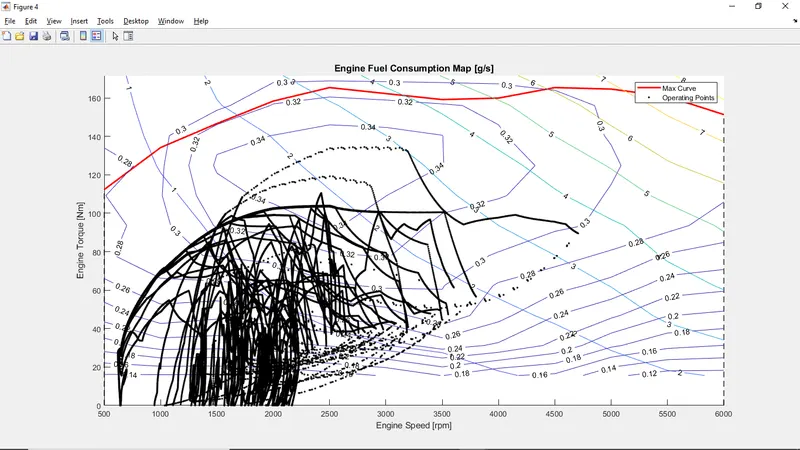
figure(4);
hold on
title('Engine Operating Points','fontsize',12);
p1=plot(Eng_map_spd*30/pi,Eng_max_trq,'linewidth',2,'color','r');
p2=line([Eng_map_spd(end)*30/pi Eng_map_spd(end)*30/pi],[0 Eng_max_trq(end)]);
set(p2,'linewidth',1,'linestyle','--','color','k');
p3=line([Eng_map_spd(1)*30/pi Eng_map_spd(1)*30/pi],[0 Eng_max_trq(1)]);
set(p3,'linewidth',1,'linestyle','--','color','k');
[c,h] = contour(Eng_map_spd'*30/pi,Eng_map_trq,Eng_fuel_map','ShowText','on');
contour(Eng_map_spd'*30/pi,Eng_map_trq,Eng_eff_map','ShowText','on')
clabel(c,h);
xlabel('Engine Speed [rpm]');
ylabel('Engine Torque [Nm]');
% figure(5)
title('Engine Fuel Consumption Map [g/s]');
p4 = plot(Es,Et,'.','color','k');
legend([p1 p4],{'Max Curve','Operating Points'});
axis([Eng_map_spd(1)*30/pi Eng_map_spd(end)*30/pi 0 Eng_map_trq(end)]);
hold off
% % Plotting the motor characteristics
figure(5)
subplot(2,2,1)
hold on
title('Speed of Motor in rpm')
plot(Time,M_spd*30/pi);
subplot(2,2,2)
hold on
title('Torque of Motor in Nm');
plot(Time,M_tr);
subplot(2,2,3)
hold on
title('Power of a Motor in KW')
plot(Time,Mp)
hold off
%%Operating point
figure(6)
hold on
title('Operating region for a motor')
plot(EM_map_spd*30/pi,EM_max_trq,'linewidth',2,'color','b','Displayname','Maximum Torque');
plot(EM_map_spd*30/pi,EM_max_gen_trq,'linewidth',2,'color','r','Displayname','Maximum Generating Torque')
plot(M_spd*30/pi,M_tr,'.','color','k','Displayname','Operating Point');
contour(EM_map_spd'*30/pi,EM_map_trq,EM_eff_map','ShowText','on','Displayname','Efficiency');
legend
hold off
%%Plot for Battery
figure(7)
subplot(2,2,1)
hold on
title('Voltage for Battery')
plot(Time,Volt);
subplot(2,2,2)
hold on
title('SOC Level of Battery')
plot(Time,Soc)
subplot(2,2,3)
title('Current from the battery')
hold on
plot(Time,C)
hold off
%plot drive cycle
figure(8)
plot(cyc_time,cyc_vel);
xlabel('Time in Second');
ylabel('Velocity in m/s');
All The Plots
UDDS and HWFET drive cycle are considered and different system level parameters is analysis
The Speed for engine,wheel and Transmission:
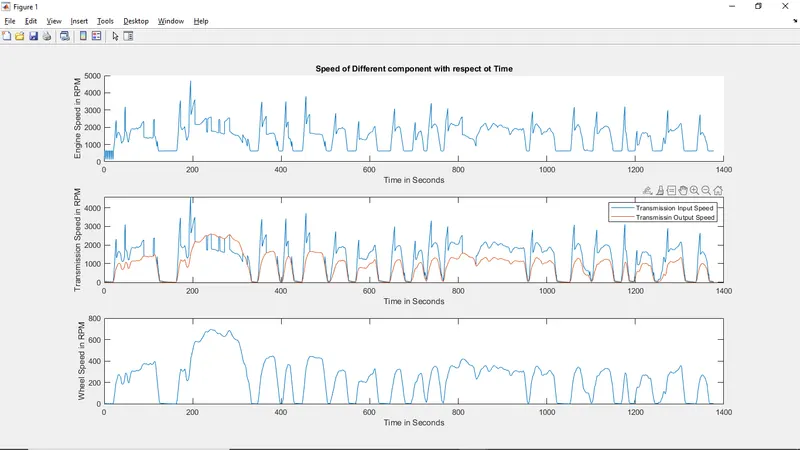
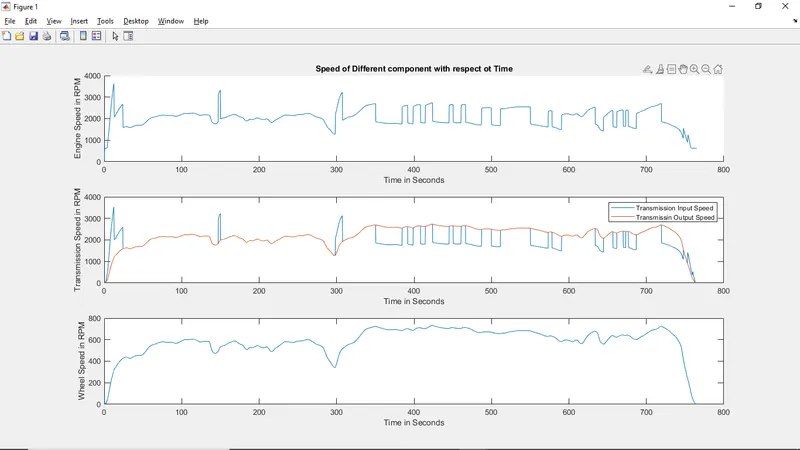
1 2
1) Speed of the different component for UDDS cycle
2) Speed of the different component for HWFET cycle.
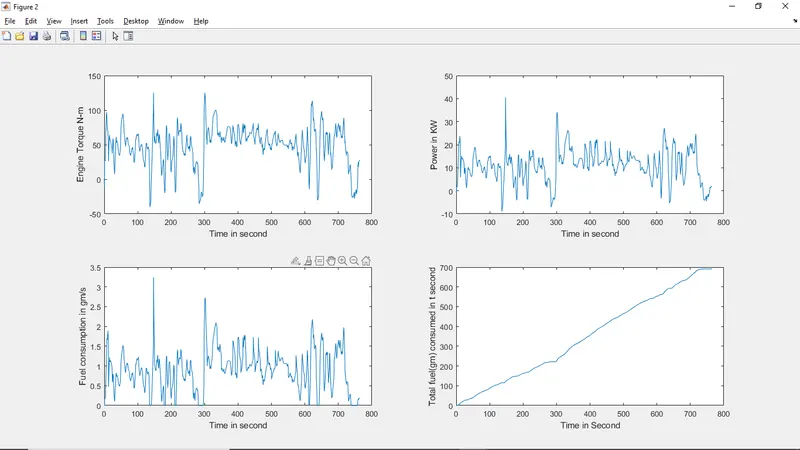
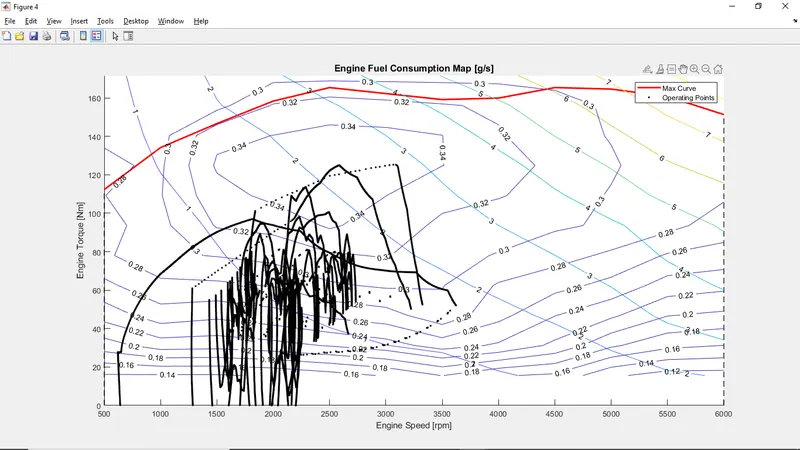
Engine Analysis for HWFET cycle and UDDS cycle.
1 2
3 4
1)Engine Performance for UDDS cycle
2)Engine performance for HWFET cycle
3) Engine fuel consumption map and operating point for UDDS cycle
4) Engine fuel consumption map and operating point for HWFET cycle
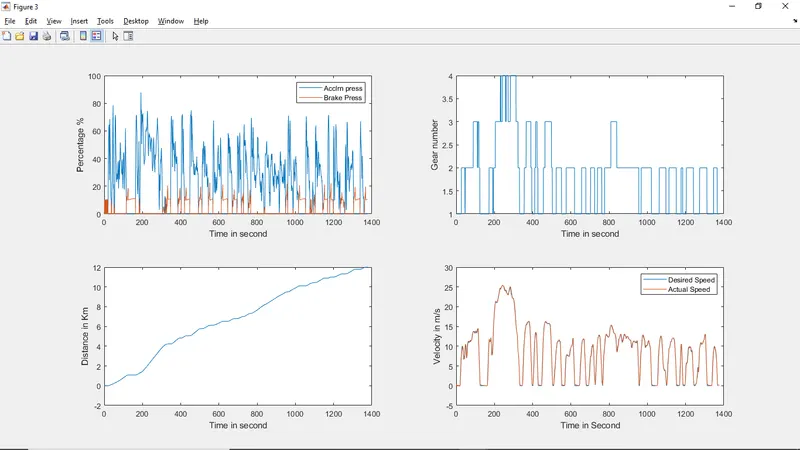
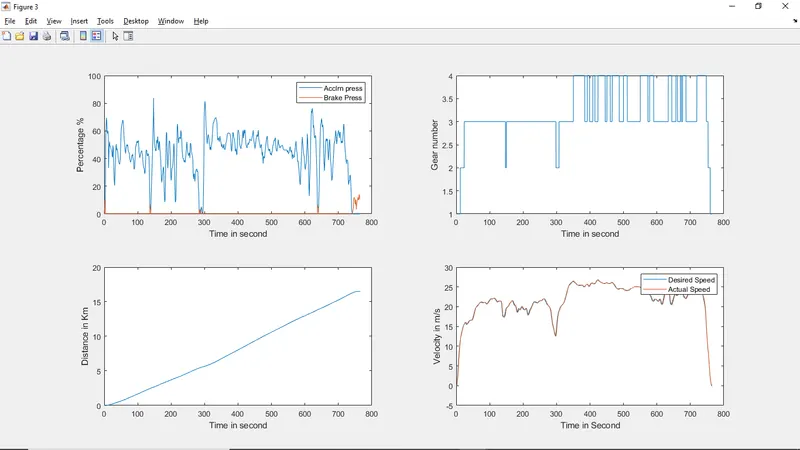
The Acclerator, Barke pedal position and Gear Selected:
1 2
1)Acclerator , Brake pedal position and Gear selected for UDDS cycle
2) Acclerator brake pedal position and gear selected for HWFET cycle.
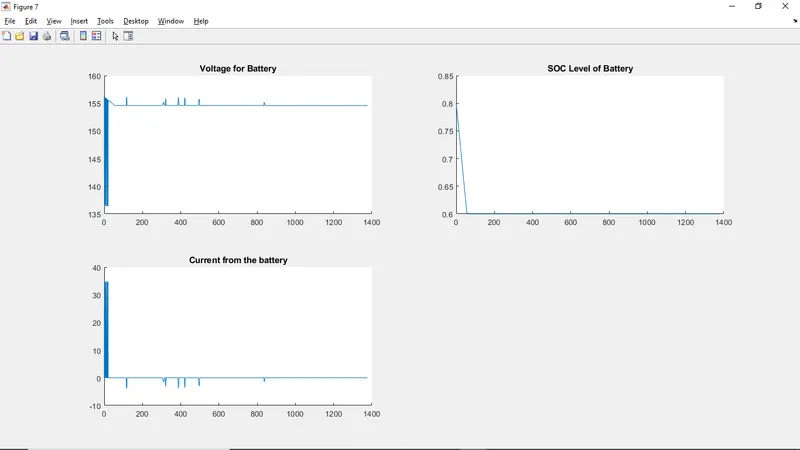
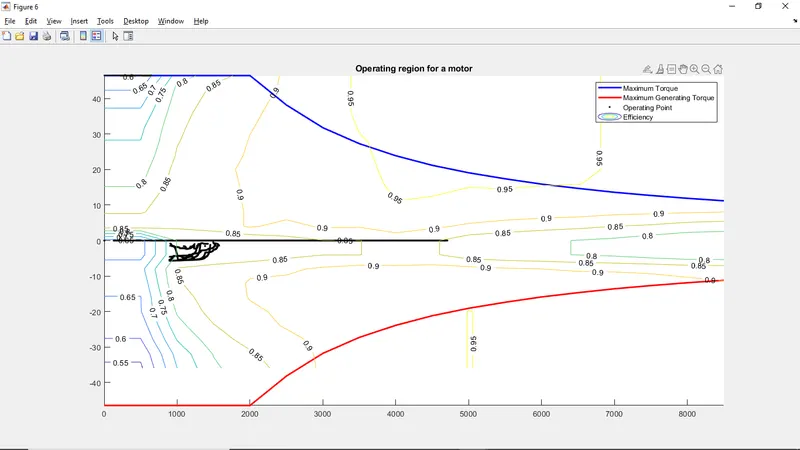
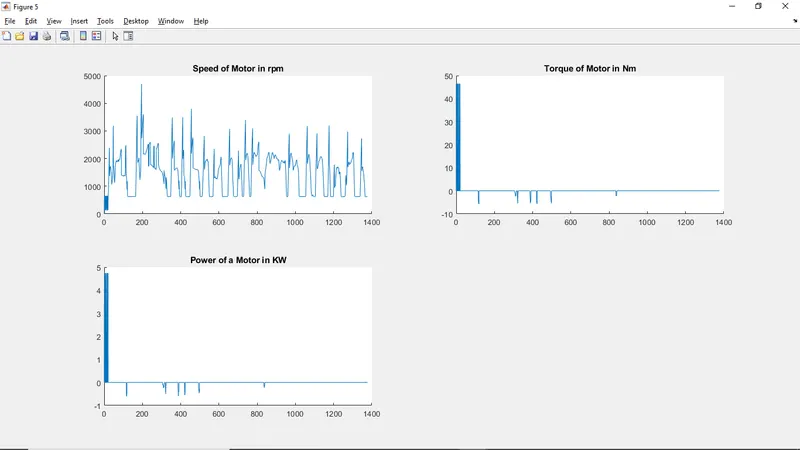
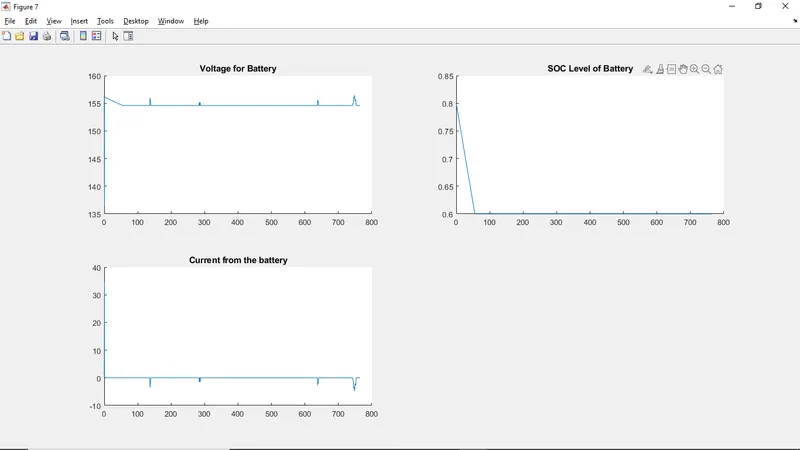
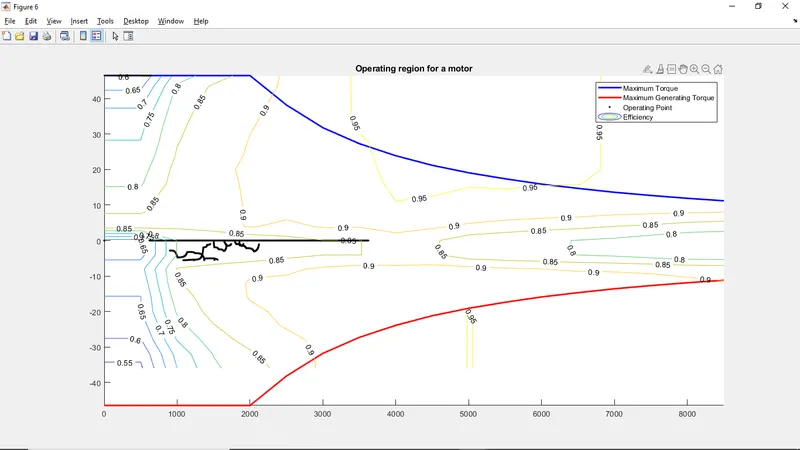
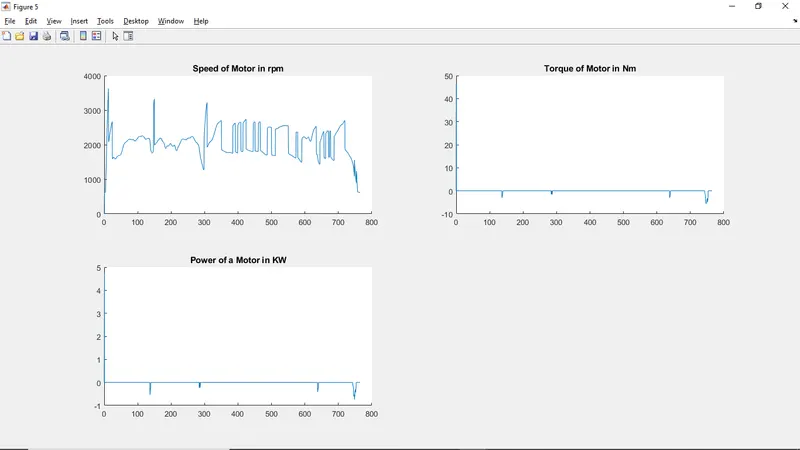
Analysis of an Electric Powertrain:
1 2
3
1)Voltage,current and SOC of the battery for UDDS cycle
2)Motor operating point for UDDS cycle
3)Motor speed, power and torque for UDDS cycle
1 2
3
1)Voltage,current and SOC of the battery for HWFET cycle
2)Motor operating point for HWFET cycle
3)Motor speed, power and torque for HWFET cycle
The Comparision with Conventional Vehicle:
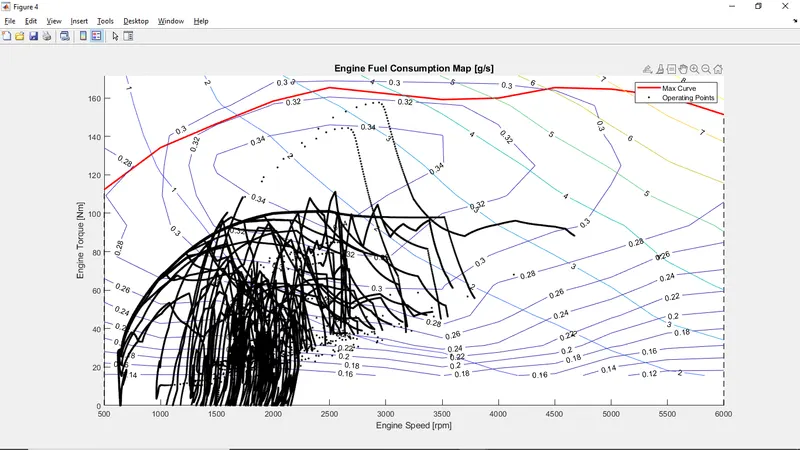
1
1)Engine performance map with its operating point for hybrid vehicle in UDDS cycle
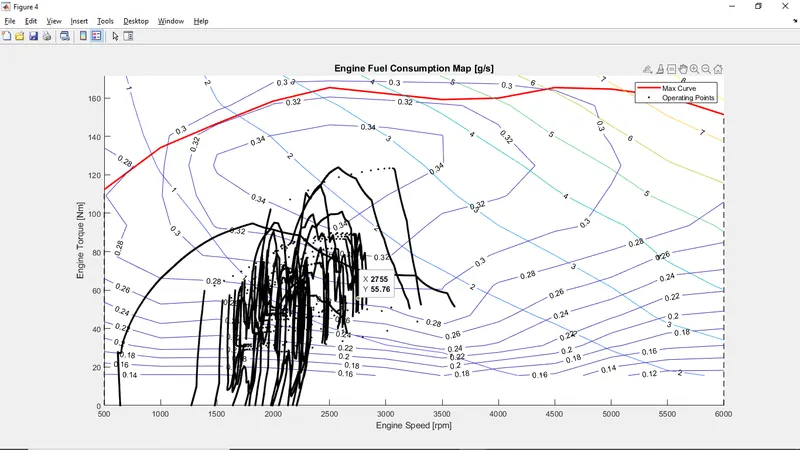
1 2
1)Engine performance map with its operating point for hybrid vehicle in HWFET cycle.
2)Engine perfromace map with its operating point for conventional vehicle in HWFET cycle.
Conclusion:
The system level analysis is the P1 hybrid vehicle and compared the fuel consumption milage with the conventional vehicle and Time trace for engine and Transmission input, Transmission output and wheelspeed with respect to time. Engine torque, Engine power, Fuel rate and Fuel consumption with respect to time.