Project 2
AIM- This Project we try to analysis OF EV on Different Driving Cycles so we Find Out Vehcile Perforamce Of Diffiernt Condition and Fuel Consumption and Emission of vehcile and aslo Compare the Diffirent Vehicle Performace.
Working
First we take All Forces Those are Apply on Vehicle
1.Rolling Resitance Force
2.Aerodynamic Drag Force
3.Hill Climbing Force
4.Acceleration Force
We Take the This Data For the Checking The vehicle Performance on Diffiernt Drive Cycle
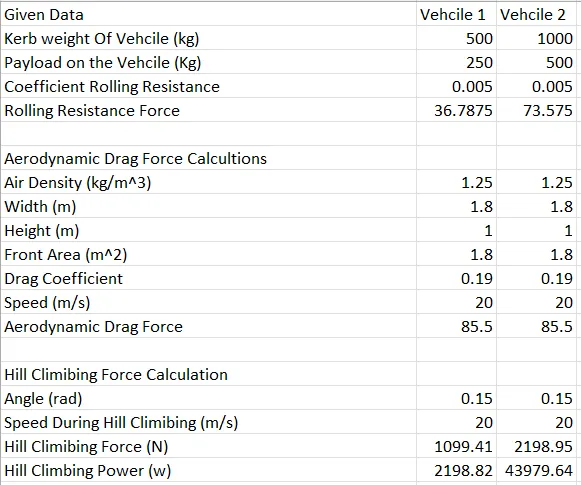
we used this formula
Rolling Resistance Force =mue*m*g
Aerodynamic Drag Force =0.5*p*A*cd*v^2
Hill Climbing Force = m*g*sin(q)
Acceleration force = M*A
This All are the calculation part done
Now we have make model for the engergy analysis
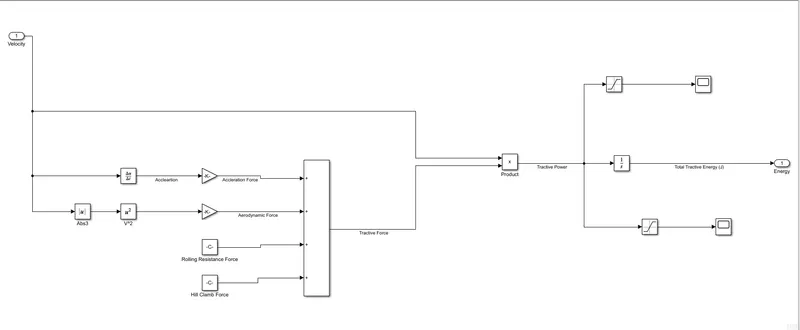
Now Design the Calacultion part of the all Forces we take Input as Diffiernt Drive Cycle anyalsis the Results
we use derivative block for the velocity to accleration and then multiply mass by using gain block
Then aerodymic Force For this we use the Abs Block For the absoulte Value of the Velocity then Square the block for the velocity then with help of gain block we multiply P,A,Cd,0.5 all this think . Then we rolling resistance Force and then Hill Climibing Force aslo calculate then add all then we get tractive Force and Multiply by Velocity then we get Tractive Power
then we integrate the Tractive power we get Total Tractive Engergy
EV- We also Design the EV module for the analysis of vehcile it will work or not properly like drive cycle
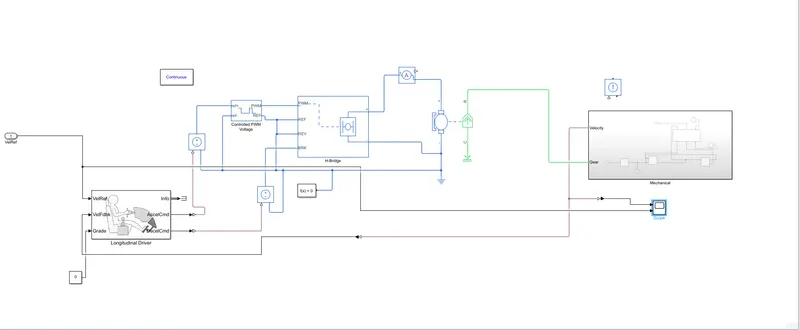
This Total EV
Now we see The Total Model of enegry anaylsis
we use the Diffiernt Driving Cycle for the analysis
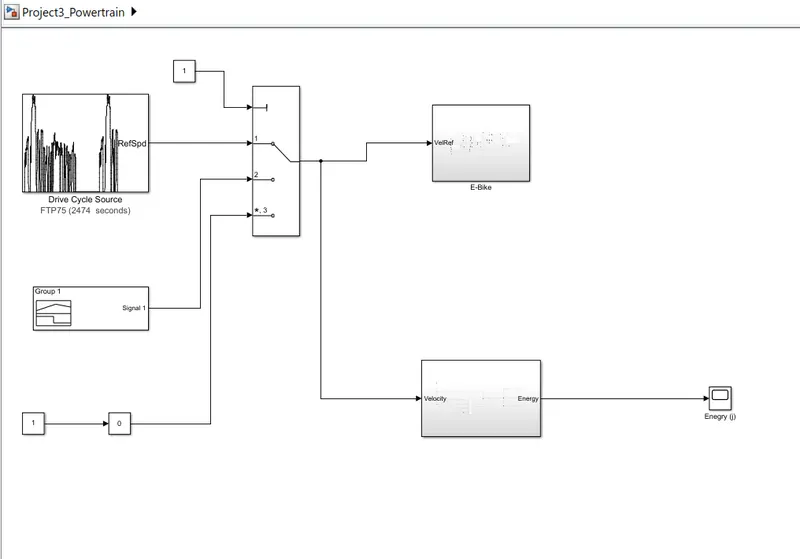
Now For the First Driving Cycle we Observed the how energy graph
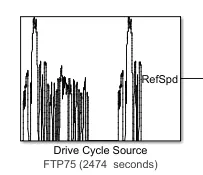
Energy Graph
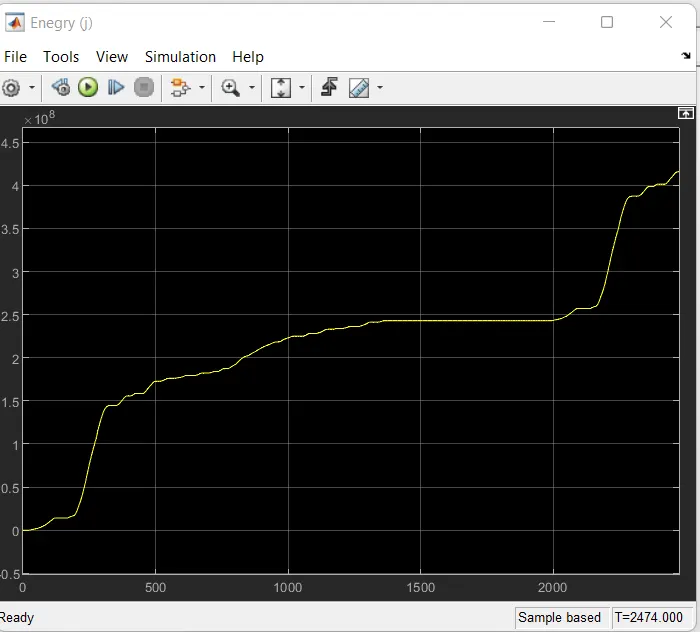
we see in this For the Above Driving Cycle How enrgy graph work
we can say like intialy graph start increses linerly after some time it will be for some time Constant and again for after some time start inceresing rapidly when we acclerate and deacclarate that time we can say energy some amount of getting some under shoot and over shoot think
Second Drive Cycle
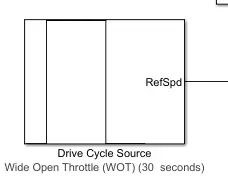
Drive Cycle Graph
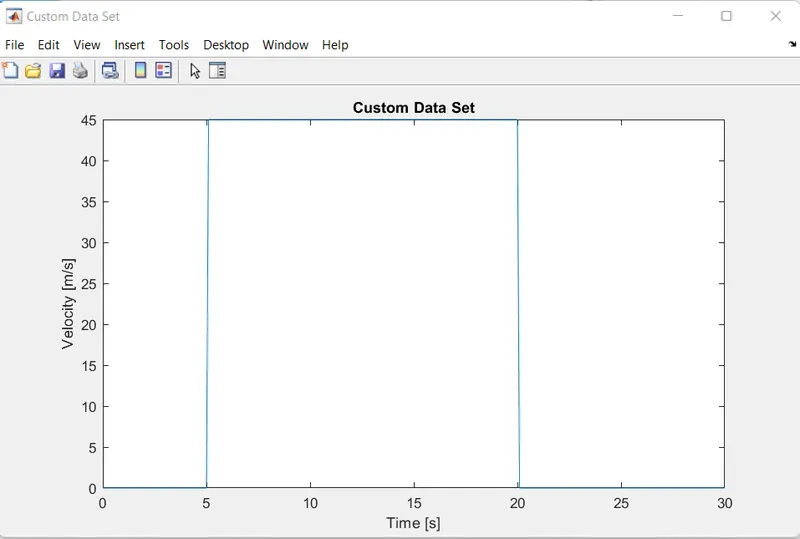
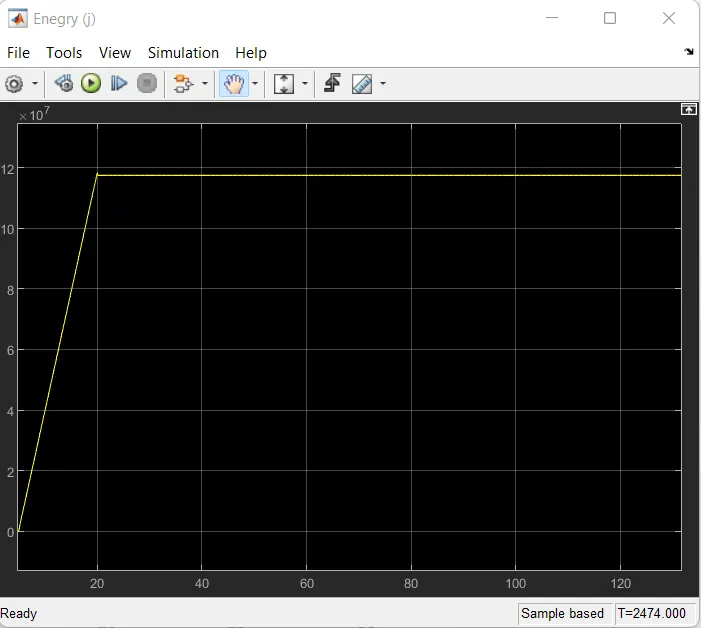
Now we see the How energy Graph are work for this Drivie cycle
In this we can see drivier not that much Harsh to driving so this energy look like almost contant
if we see the only at intila stage it will increses the linerily the it will constant because of in this driving cycle if we observed
Drivier drive car very constantly so there no rapidly accleartion and deaccelarton just because of energy of vehcile also like constant not that much changes it like constant
Third Drivie Cycle
we bulid own drivie cycle with help of Signal Bulider
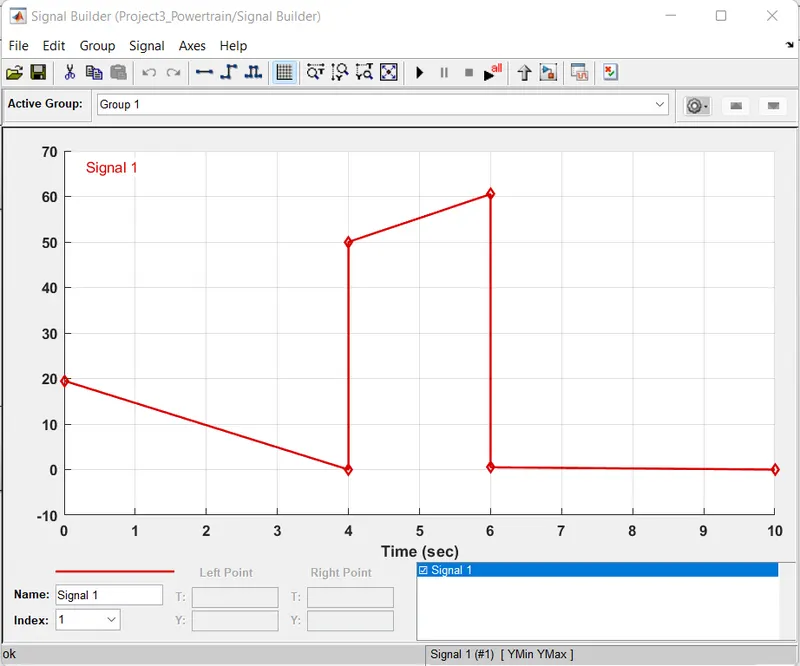
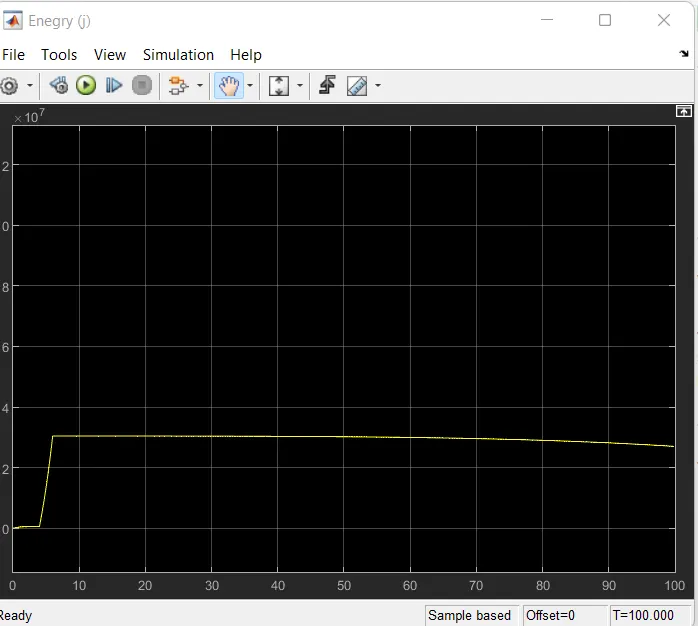
Now see the energy graph For this Drivie Cycle
IF we see this graph in that also intiatly some time graph are constant then speed start increses the our engegy graph start increse linerily after some time again it will constant becuse of driving cycle there is also not that much accleration and deacclertion
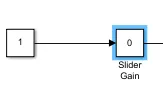
Fourth Drivie Cycle we can use slider gain to create own driving cycle
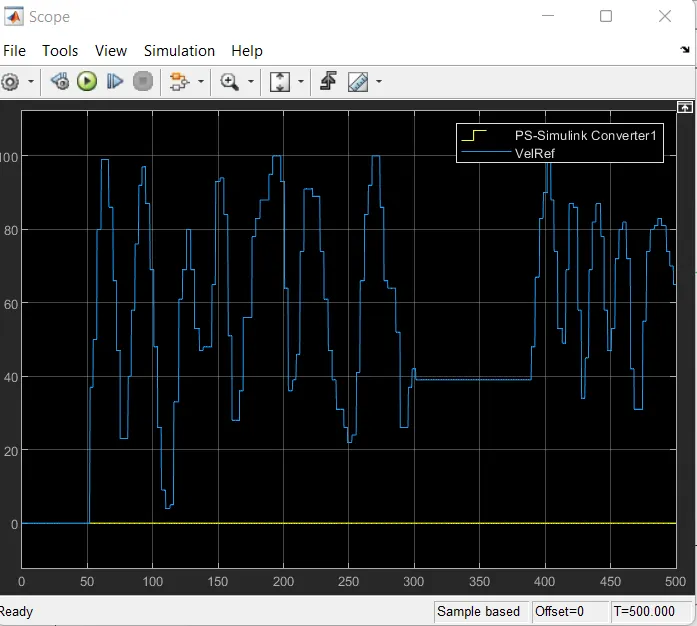
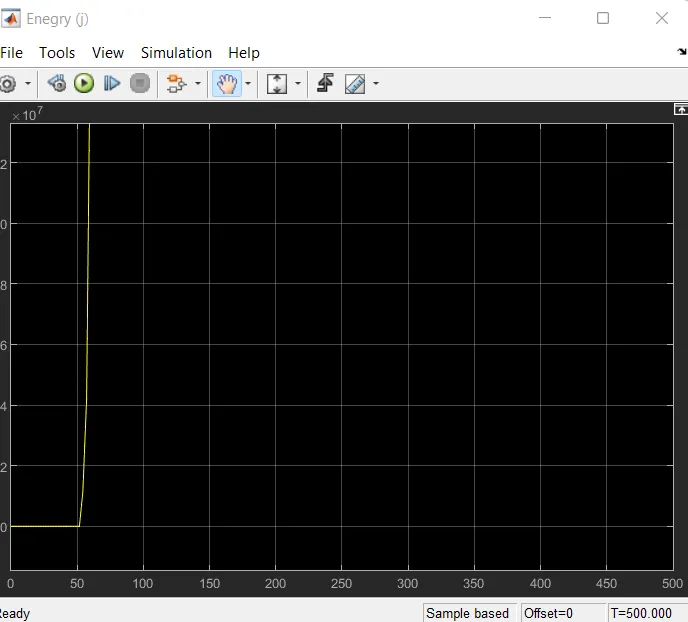
IF we See graph for this Drivie cycle
we can see it will rapdily increses
Conclusion-
We Observe all four Driving cycle we analysis all then oberve when we rapdily or after some constantly change the speed we get energy also change with time while we take speed constant we can see our energy not that changes it like constant.