Project 2
OBJECTIVE :- To Plot for UDDS & HWFET cycle for P1 hybrid vehicle .
MODEL:-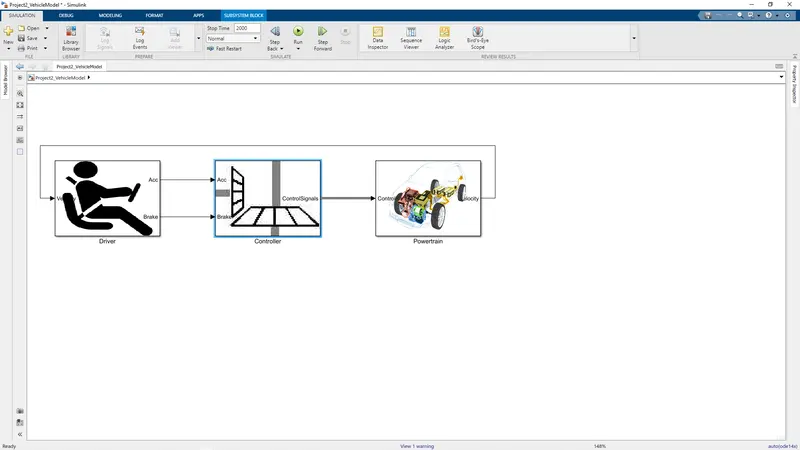
CONTROLLER
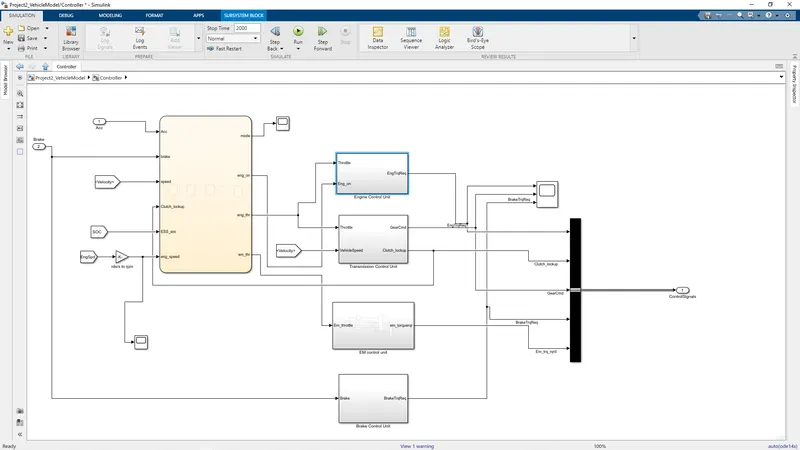
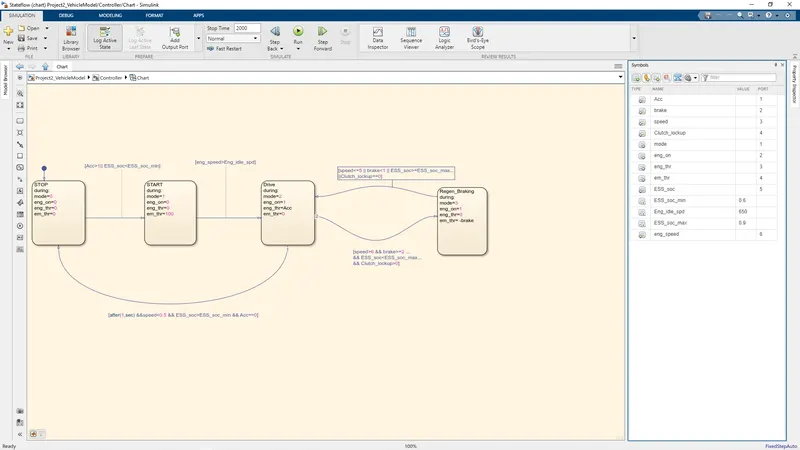
CHART
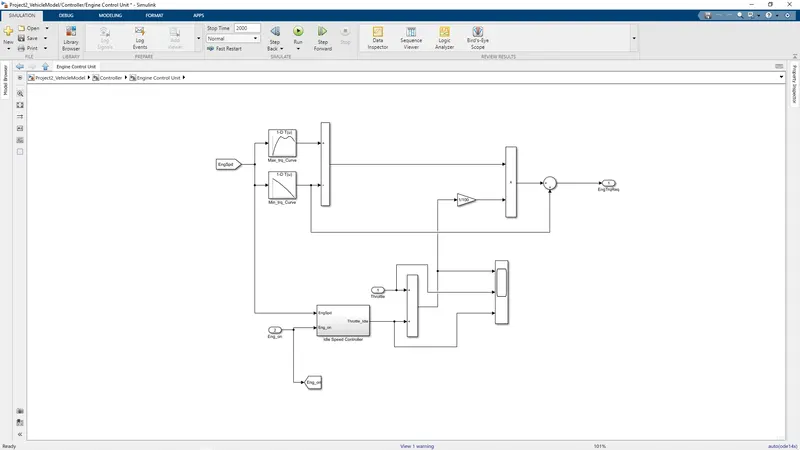
ENGINE CONTROL UNIT
TRANSMISSION CONTROL UNIT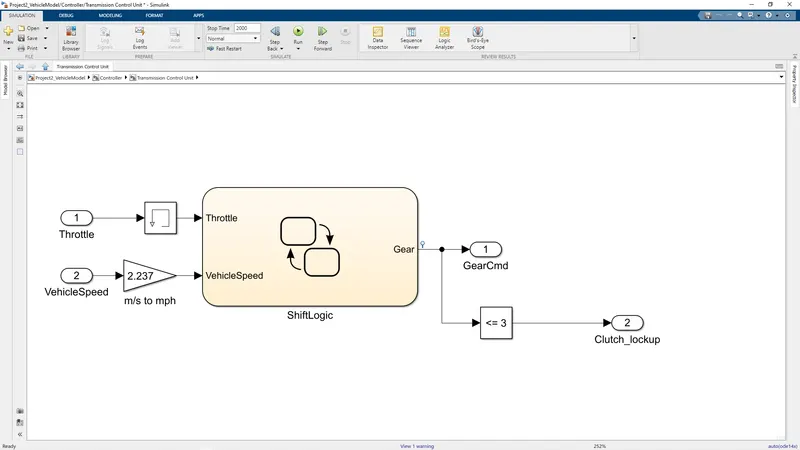
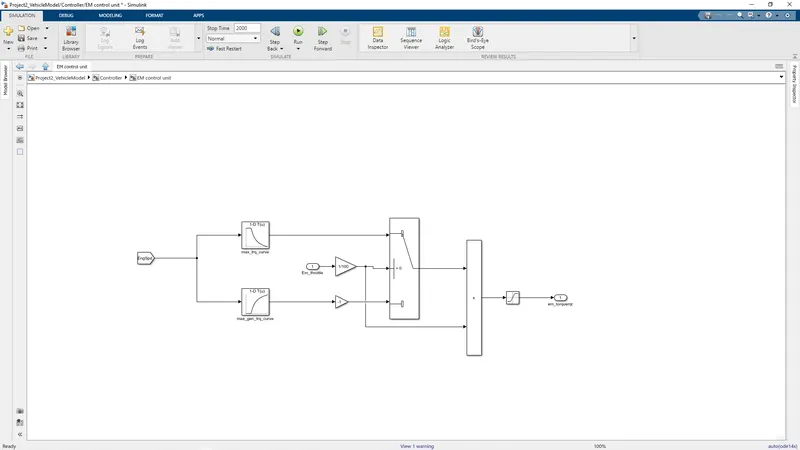
EM CONTROL UNIT
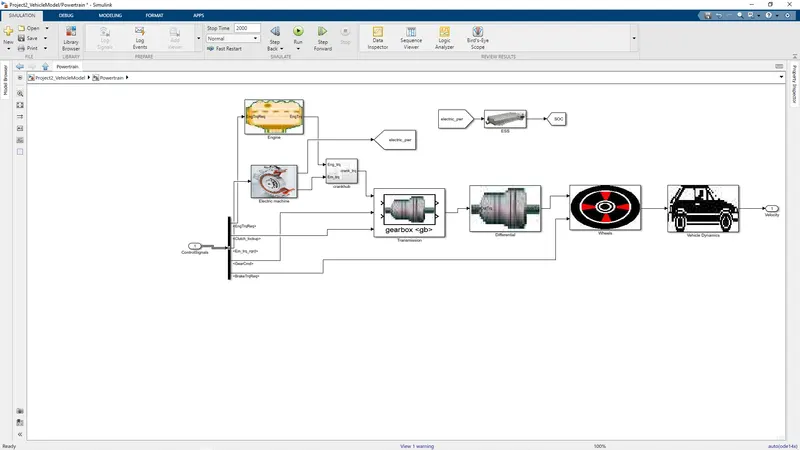
POWERTRAIN
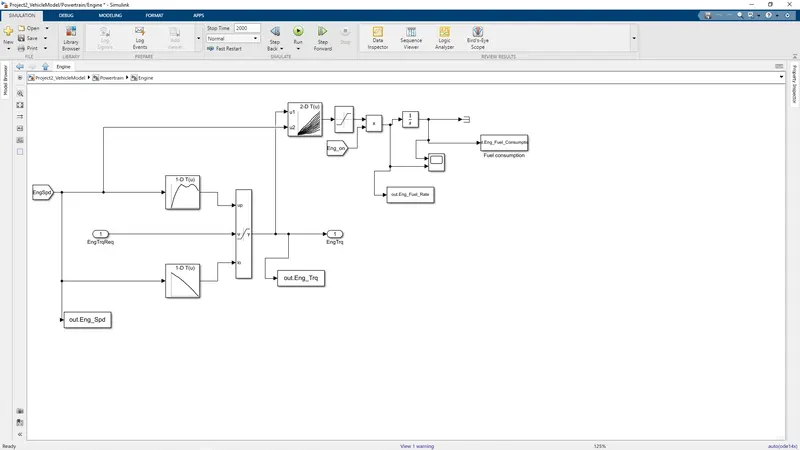
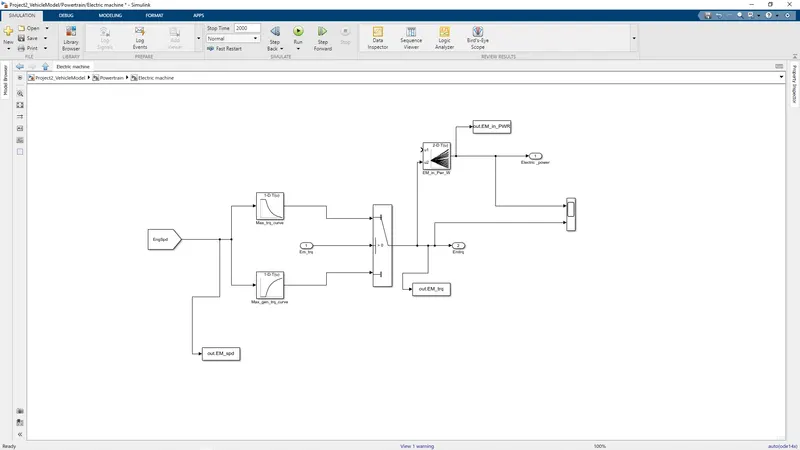
ENGINE AND EM
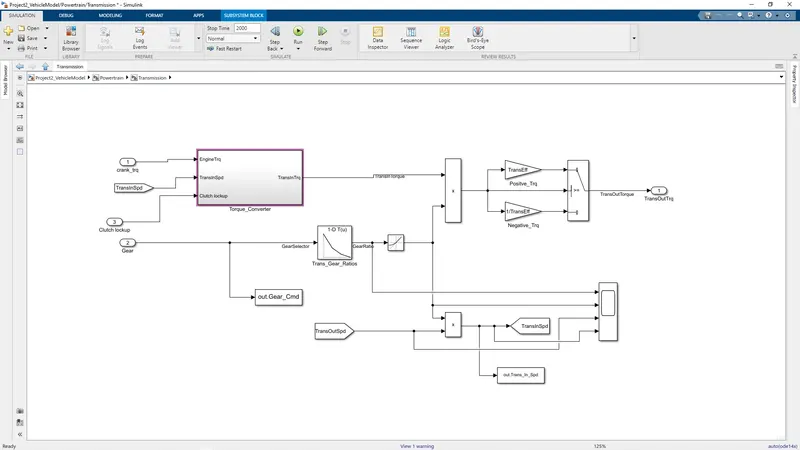
TRANSMISSION(with torque convertor)
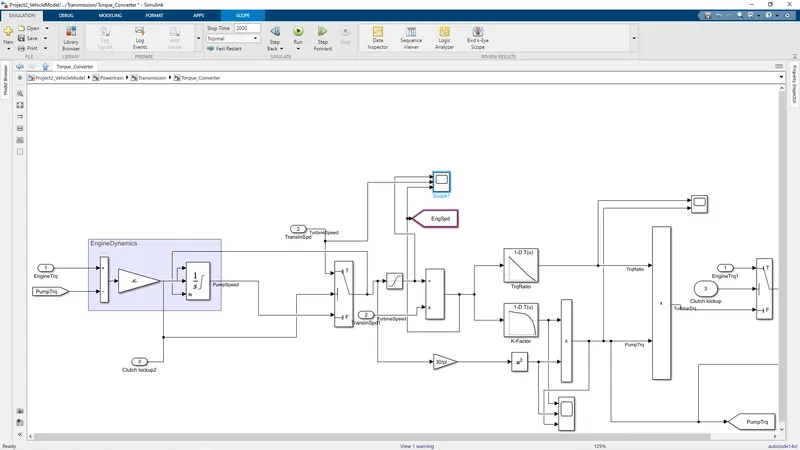
TORQUE CONVERTOR
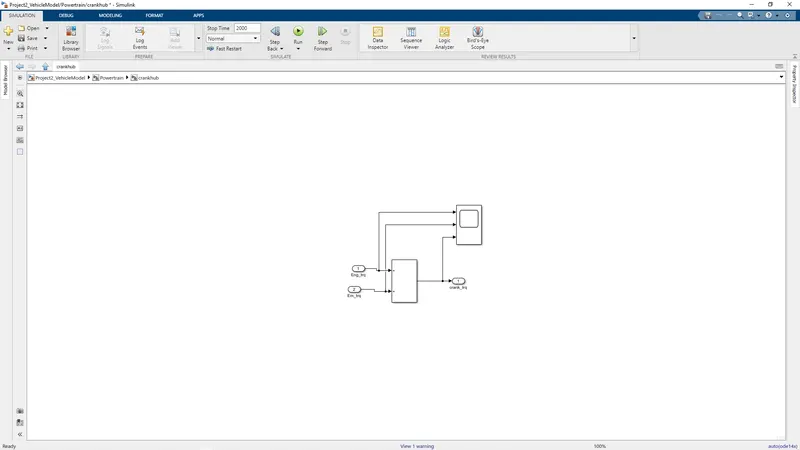
CRANKHUB
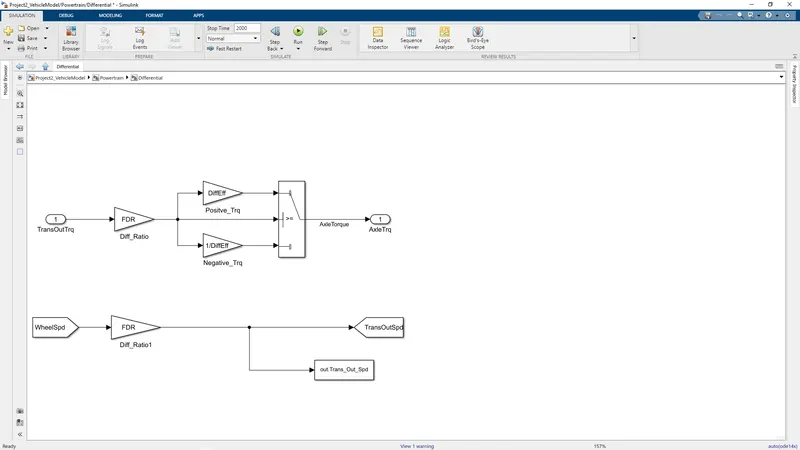
DIFFERENTIAL
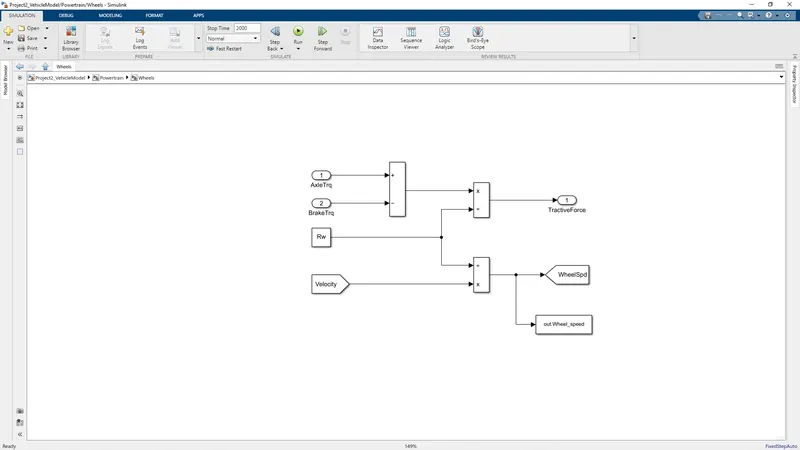
WHEELS
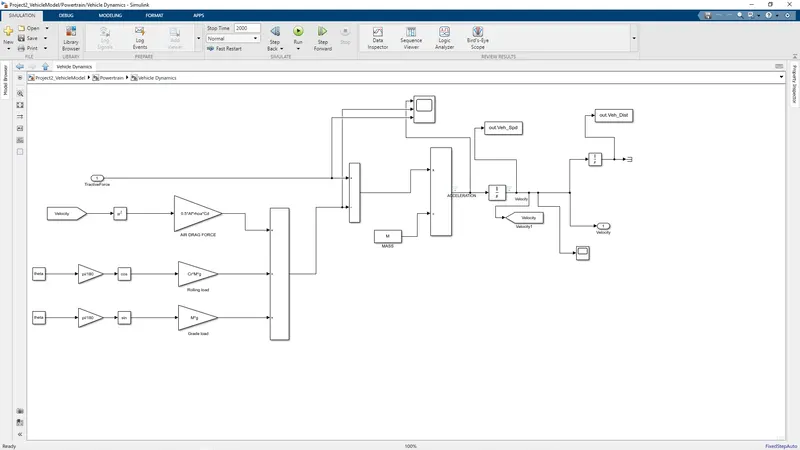
VEHICLE DYNAMICS
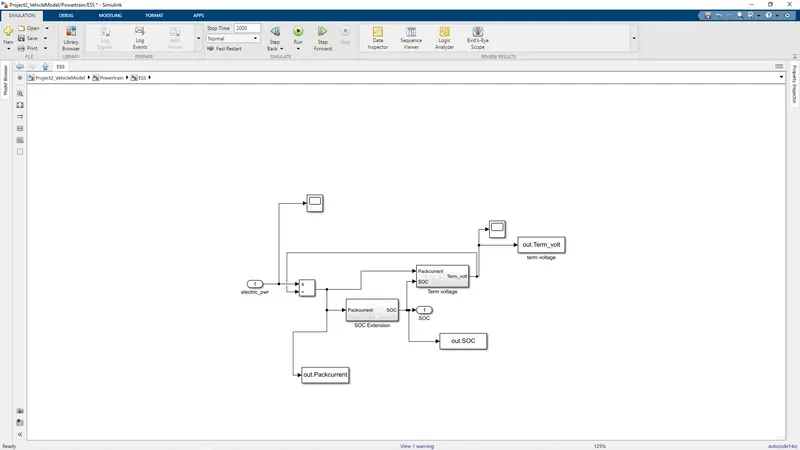
ESS
STEPS WITH CODE
- First we run the attched project 2 .init file to load all data and select UDDS or HWFET accordingly.
- Then we run the simulink model created as shown above.
- After saving work to output(matlab) using "to workspace" .
- Finaly we run final script for all plots and map.
INITIAL CODE
%% Vehicle Parameters
M = 1500;       % Vehicle weight [kg]
Cr = 0.015;     % Rolling resistance coefficient
Rw = 0.35;      % Rolling radius [m]
Cd = 0.33;      % Drag coefficient
Af = 2;         % Frontal area [m2]
rhoa = 1.225;   % Air density [kg/m3]
Vwind = 0;      % Wind velocity [kmph]
g = 9.81;       % Gravitational acceleration [m/s2]
theta = 0;      % Slope [deg]
myu_road_tire = 1; % Coefficient of friction between tire - road interface

%% Powertrain Parameters
FDR = 3.73;                         % Final Drive Ratio / Diff Ratio
DiffEff = 0.99;                     % Differential efficiency (assumed independent of operating conditions)

NumGear = 4;                        % Number of gears in transmission
TransGear = [1:NumGear];            % Transmission Gears
TransRatio = [3.06, 1.62, 1, 0.7];  % Corresponding Transmission ratios
TransEff = 0.90;                    % Transmission efficiency (assumed independent of operating conditions)

TC_SR = [0, .5, .6, .7, .8, .87, .92, .94, .96, .97, 1];   % Torque Converter Speed Ratio (Matlab default) -> TurbSpd/PumpSpd
TC_TR = [2.232, 1.5462, 1.4058, 1.2746, 1.1528, 1.0732, 1.0192, 1, 1, 1, 1];   % Torque Converter Torque Ratio (Matlab default) -> TurbTrq/PumpTrq
TC_Cf = 1e-4 * [.72558, .66322, .63463, .59042, .51331, .4144, .29287, .22444, .12186, .04386, 0]; % Torque Converter Capacity Factor (Matlab default) -> PumpTrq/PumpSpd^2 [Nm/rpm^2]

load Vehicle_Data/Engine_data_1_9L_Saturn_95kW
load Vehicle_Data/Trans_Shift_map
load Vehicle_Data/EM_Honda_Insight_10kW
load Vehicle_Data/ESS_NiMH6


ESS_init_soc = 0.8;
ESS_soc_max = 0.9;
ESS_soc_min = 0.6;


%% Driver Parameters
Kp = 10;                    % P gain for driver PI model
Ki = 1;                     % I gain for driver PI model
Drive_Cycle_Select = 2;     % Drive cycle selection

% Drive cycle values in m/s

if Drive_Cycle_Select == 1
    load DriveCycles/UDDS;

elseif Drive_Cycle_Select == 2
    load DriveCycles/HWFET;

elseif Drive_Cycle_Select == 3
    load DriveCycles/FTP;

elseif Drive_Cycle_Select == 4
    load DriveCycles/US06;

elseif Drive_Cycle_Select == 5
    load DriveCycles/NEDC;

elseif Drive_Cycle_Select == 6
    load DriveCycles/WLTP;

end

time_end = cyc_time(end);
vel_end = cyc_vel(end);
PLOTING SCRIPT
%% Renaming variables
Time = out.tout;
Acc_Pdl = out.Acc_Pdl;          % Accelerator pedal [%]
Brk_Pdl = out.Brk_Pdl;          % Brake pedal [%]
Gear_Cmd = out.Gear_Cmd;        % Transmission gear
Trans_In_Spd = out.Trans_In_Spd*30/pi;  % Transmission input speed [rpm]
Trans_Out_Spd = out.Trans_Out_Spd*30/pi;% Transmission output speed [rpm]
Eng_Trq = out.Eng_Trq;          % Engine brake torque [Nm]
Eng_Spd = out.Eng_Spd*30/pi;    % Engine speed [rpm]
Eng_Fuel_Consump = out.Eng_Fuel_Consumption;    % Engine fuel consumption [g]
Veh_Dist = out.Veh_Dist/1000;   % Distance traveled by vehicle [km]
Veh_Spd = out.Veh_Spd*18/5;     % Vehicle speed [kmph]
Eng_Fuel_rate=out.Eng_Fuel_Rate; % Engine Fuel Rate
Wheel_speed= out.Wheel_speed   % Wheel speed[kmph]
Veh_desired_spd= out.vehicle_desired_speed % vehicle desired speed
SOC= out.ESS_SOC;                     % SOC
V_term= out.Term_volt;         %pack Voltage
I=out.Packcurrent                   %current
motor_input_power=out.EM_in_PWR % input power of motor
motor_trq=out.EM_trq           % motor torque
motor_speed= out.EM_spd      % motor speed
IR= out.Internal_resistance;      % resistance in pack
V_open= out.Open_circuit_voltage; % Open voltage in pack
%% Data Analysis
Eng_Pwr = Eng_Spd.*pi/30.*Eng_Trq/1000;   % Engine brake power [kW]
rho_petrol = 0.7197;                    % Density of petrol [kg/L]
kmpl = Veh_Dist(end)./(Eng_Fuel_Consump(end)./1000./rho_petrol);    % Fuel economy [kmpl]


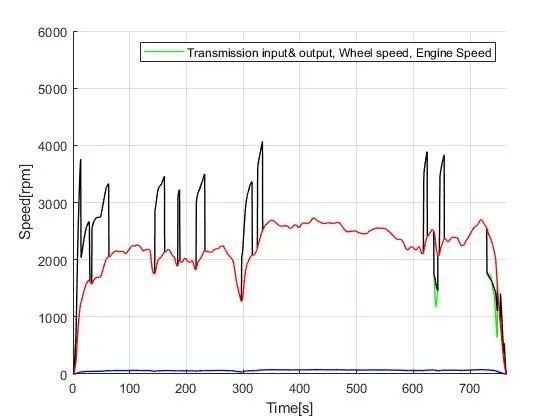
% Plotting vehicle characterstics time trace, transmission input& output
% with wheel speed in one plot
figure(1)
hold on
grid on
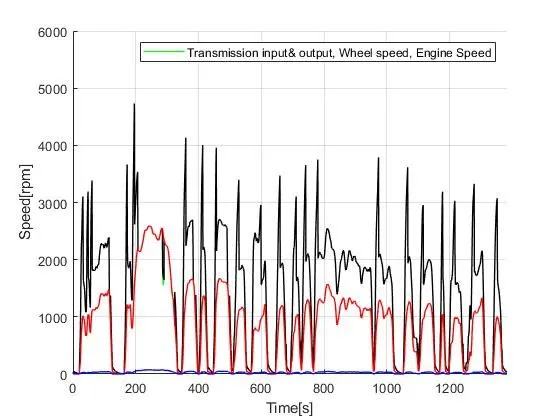
plot(Time,Eng_Spd,'linewidth',1,'color','green');
plot(Time,Trans_In_Spd,'linewidth',1,'color','black');
plot(Time,Trans_Out_Spd,'linewidth',1,'color','red');
plot(Time,Wheel_speed,'linewidth',1,'color','blue');
xlabel('Time[s]')
ylabel('Speed[rpm]')
xlim([0,Time(end)]);
ylim([0,6000]);
legend('Transmission input& output, Wheel speed, Engine Speed')

% plotting vehicle torque, engine power,%% Fuel consumption vs fuel rate
figure(2)
subplot(2,2,1)
plot(Time, Eng_Fuel_Consump, 'linewidth', 1, 'Color', 'black');
xlabel('Time[s]')
ylabel('Fuel Consumption')
legend('Engine fuel consumption')
grid on

subplot(2,2,2)
plot(Time, Eng_Fuel_rate, 'linewidth', 1, 'Color', 'red');
xlabel('Time[s]')
ylabel('Fuel_Rate')
legend('Fuel Rate')
grid on

subplot(2,2,3)
plot(Time, Eng_Trq, 'linewidth', 1, 'Color', 'blue');
xlabel('Time[s]')
ylabel('Engine Torque [NM]')
legend('Engine Torque')
grid on

subplot(2,2,4)
plot(Time, Eng_Pwr, 'linewidth', 1, 'Color', 'green');
xlabel('Time[s]')
ylabel('Engine Power [KW]')
legend('Engine Power')
grid on

%plotting fuel economy vs furel consumption
figure(3)
plot(Eng_Fuel_Consump, Eng_Fuel_rate, 'linewidth', 1, 'Color', 'red');
xlabel('Fuel consumption')
ylabel('Fuel rate')
legend(' Fuel economy vs Fuel consumption')

% plotting vehicle accelerator pedal , brake pedal & gear respect to time
figure(4)
subplot(3,1,1)
hold on
grid on
plot(Time,Acc_Pdl, 'linewidth', 1, 'Color', 'red');
plot(Time,Brk_Pdl, 'linewidth', 1, 'Color', 'black');
xlabel('Time[s]')
ylabel('Pedal')
xlim([0, Time(end)]);
legend('Accel','Brake');

subplot(3,1,2)
hold on
grid on
plot(Time,Veh_desired_spd, 'linewidth', 1, 'Color', 'red');
plot(Time,Veh_Spd, 'linewidth', 1, 'Color', 'black');
xlabel('Time[s]')
ylabel('Speed')
xlim([0, Time(end)]);
legend('Desired Speed','Actual Speed');

subplot(3,1,3)
hold on
grid on
plot(Time,Gear_Cmd, 'linewidth', 1, 'Color', 'black');
xlabel('Time[s]')
ylabel('Gear')
xlim([0, Time(end)]);
legend('Gear wrt Time');


figure(5)
subplot(3,1,1)
hold on
grid on
plot(Time,motor_speed, 'linewidth', 1, 'Color', 'red');
xlabel('Time[s]')
ylabel('motor speed')
xlim([0, Time(end)]);
legend('MOTOR SPEED');

subplot(3,1,2)
hold on
grid on
plot(Time,motor_trq, 'linewidth', 1, 'Color', 'red');
xlabel('Time[s]')
ylabel('Torque')
xlim([0, Time(end)]);
legend('MOTOR TORQUE');

subplot(3,1,3)
hold on
grid on
plot(Time,motor_input_power, 'linewidth', 1, 'Color', 'black');
xlabel('Time[s]')
ylabel('Input Power')
xlim([0, Time(end)]);
legend('Motor input power');

figure(6)
subplot(3,1,1)
hold on
grid on
plot(Time,V_term, 'linewidth', 1, 'Color', 'red');
xlabel('Time[s]')
ylabel('Pack Volatage(V)')
xlim([0, Time(end)]);
legend('Volatage of pack');

subplot(3,1,2)
hold on
grid on
plot(Time,SOC, 'linewidth', 1, 'Color', 'red');
xlabel('Time[s]')
ylabel('SOC')
xlim([0, Time(end)]);
legend('SOC');

subplot(3,1,3)
hold on
grid on
plot(Time,I, 'linewidth', 1, 'Color', 'black');
xlabel('Time[s]')
ylabel('Current')
xlim([0, Time(end)]);
legend('Current');


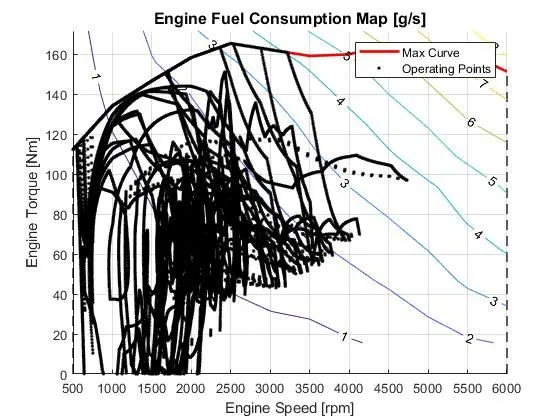
%% Plotting engine operating points on engine fuel map
figure('Name','Engine Operating Points');
hold on
grid on
title('Engine Operating Points','fontsize',12);
p1=plot(Eng_map_spd*30/pi,Eng_max_trq,'linewidth',2,'color','r');
p2=line([Eng_map_spd(end)*30/pi Eng_map_spd(end)*30/pi],[0 Eng_max_trq(end)]);
set(p2,'linewidth',1,'linestyle','--','color','k');
p3=line([Eng_map_spd(1)*30/pi Eng_map_spd(1)*30/pi],[0 Eng_max_trq(1)]);
set(p3,'linewidth',1,'linestyle','--','color','k');
[c,h] = contour(Eng_map_spd'*30/pi,Eng_map_trq,Eng_fuel_map');
clabel(c,h);
xlabel('Engine Speed [rpm]');
ylabel('Engine Torque [Nm]');
title('Engine Fuel Consumption Map [g/s]');
p4 = plot(Eng_Spd,Eng_Trq,'.','color','k');
legend([p1 p4],{'Max Curve','Operating Points'});
axis([Eng_map_spd(1)*30/pi Eng_map_spd(end)*30/pi 0 Eng_map_trq(end)]);
RESULTS FOR UDDS
TRANSMISSION OUTPUT,WHEEL SPEED, ENGINE SPEED
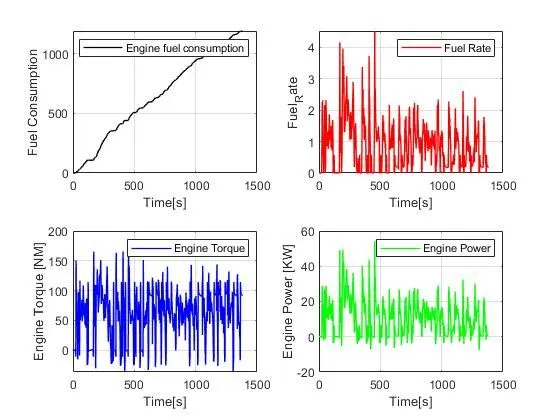
ENGINE TORQUE,POWER AND OTHER DATA
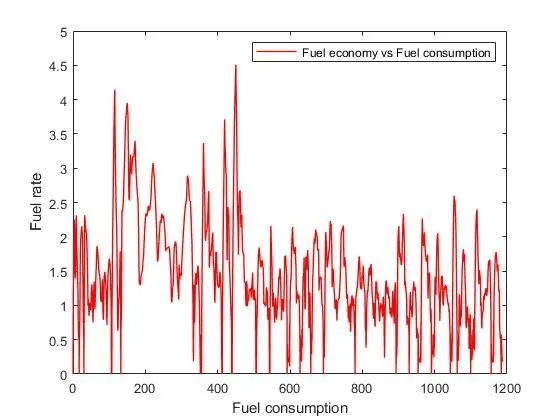
FUEL CONSUMPTION
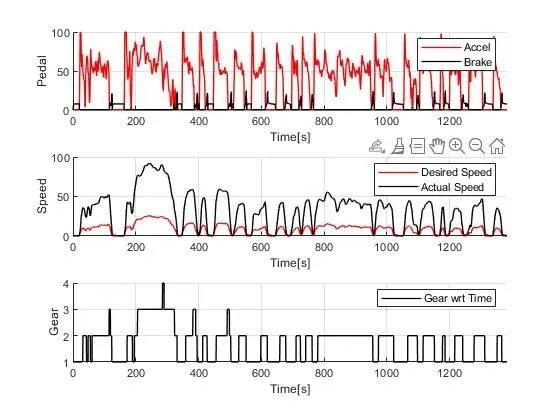
DESIRED SPEED,ACCELRATION,GEAR WITH TIME
ENGINE FUEL MAP
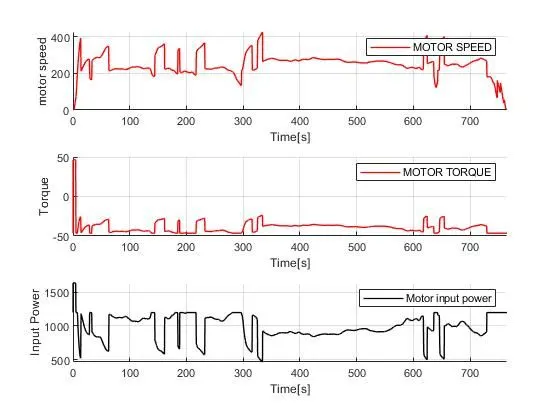
EM SPEED,TORQUE ,INPUT POWER
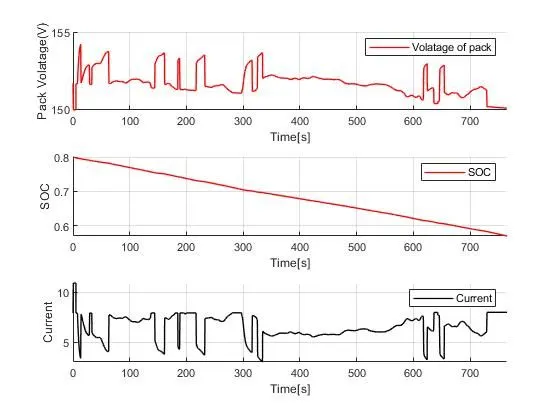
SOC,CURRENT & VOLTAGE
RESULT FOR HWFET
TRANSMISSION OUTPUT,WHEEL SPEED, ENGINE SPEED
ENGINE TORQUE,POWER AND OTHER DATA
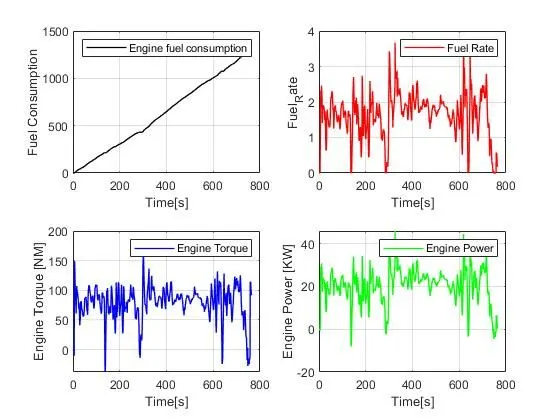
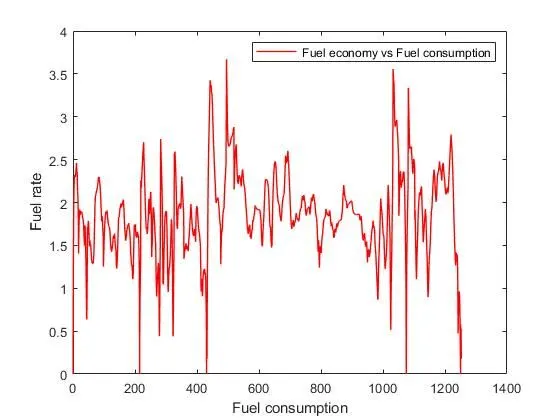
FUEL CONSUMPTION
DESIRED SPEED,ACCELRATION,GEAR WITH TIME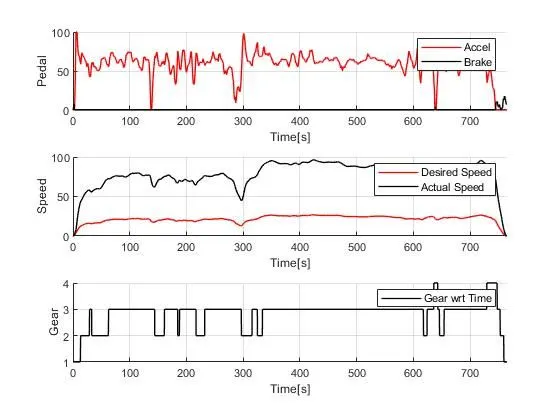
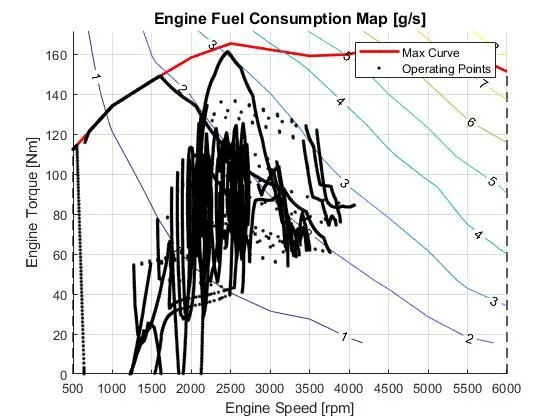
ENGINE FUEL MAP
EM SPEED,TORQUE ,INPUT POWER
SOC,CURRENT & VOLTAGE
COMPARING BOTH DRIVE CYCLE
- In fuel economy we see more spikes for UDDS as its a stop and go rather than for HWFET it means idling timme for UDDS is more but recharging of battery is happening at that time .
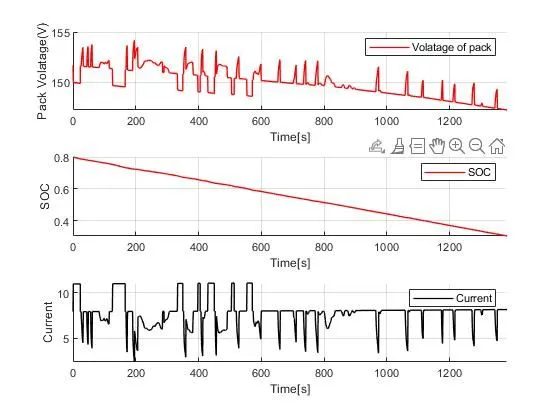
- Due to which it takes large time for SOC depletion in UDDS (1200) than in HWFET(700) because in highway its of continuous use with less idle and regenerative braking time .
- As the HWFET have smoother ride rather than stop and go of UDDS the HWFET operates more in optimum torque rather than maximum torque.As UDDS is starting where we need max torque u will see higher spike in TORQUE, POWER,VOLTAGE & CURRENT supply in UDDS.
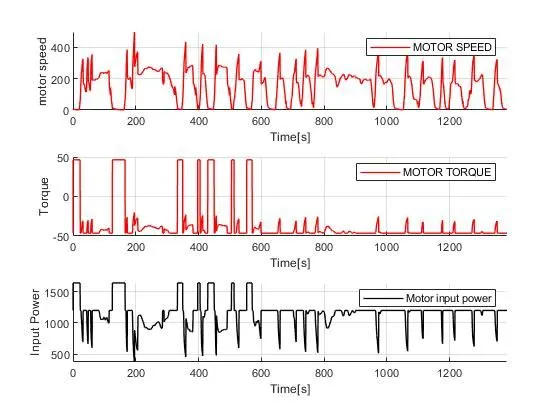
- Electrical motor is used for starting and regenerative braking we will watch continous use for UDDS for starting where as in HWFET its use for max operation or brake chrging.
- We will observe higher gear usage in HWFET and lower in UDDS which is obvious .
- FUEL MAP shows UDDS operate in max torque zone where as HWFET uses more optimum zone .
- SOC ,Volatge discahrge is fatster in HWFET as its in continuous use as comapre to UDDS.