Project 2
Aim:-
The task of this project is to quantify the improvement in fuel economy numbers for the hybrid vehicle (kmpl), compared to the conventional vehicle, on the urban cycle (UDDS) and highway cycle (HWFET). Also, to analyze and understand the vehicle operating points in terms of engine and motor speed, torque, transmission speeds, pedal positions, gear, distance traveled, battery voltage, current, SoC, etc.
To do that, the following steps need to be followed:
1) Load the Project2 folder as the Current Folder in Matlab.
2) Run the “Project2_InitFile.m” Matlab script.
3) Copy the Conventional vehicle Simulink model created for Project 1 in this folder. Figure 1: P1 Hybrid Architecture Hybrid Drives Development
4) Modify this model into a hybrid vehicle model. The lecture presentations can be used as a reference. Battery and Supervisory controller models developed in the assignments can be reused.
5) Add additional ‘To Workspace’ blocks for transferring the desired Simulink vehicle data into the Matlab workspace.
6) Simulate the hybrid model on the desired drive cycles.
7) Write a project report that contains the following:
a. Tabulate the fuel economy numbers (kmpl) for UDDS and HWFET cycles. Compare these numbers with the baseline numbers for the conventional vehicle model from Project 1.
b. Plot the time trace for the engine, transmission input, transmission output, and wheel speed on one plot.
c. Plot engine torque, power, fuel rate, and consumption using subplots.
d. Plot accelerator and brake pedal, gear command, vehicle desired and actual speed, and vehicle distance using subplots.
e. Plot the engine operating points on the engine fuel map.
f. Plot motor speed, torque, and motor input power using subplots.
g. Plot pack voltage, current, and SoC using subplots.
h. Plot the motor operating points on the motor input power map, with the motor max motoring and generating torque curves.
i. Write down appropriate brief comments on each of these plots, describing the vehicle behavior throughout the drive cycle.
j. Generate the plots for both drive cycles
Description:-
As discussed in Lecture 11, Project 2 deals with the development of a forward energy-based fuel consumption model of a P1 hybrid vehicle. This model is based on the conventional vehicle model from Project 1.
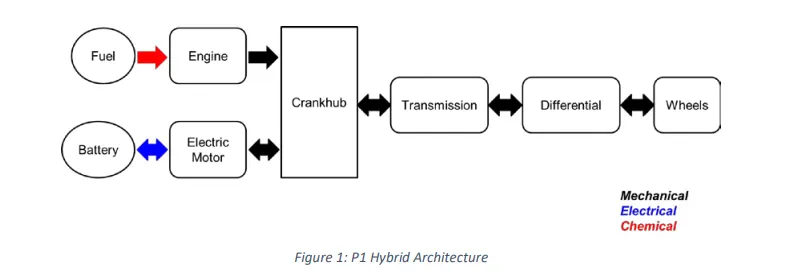
The main goal of this project is to understand the functionality of a P1 hybrid and be able to model it.
Honda Insight motor and battery are considered for this project. Data is taken from the ADVISOR database developed by NREL, USA. Data is provided in the project files.

“Project2_InitFile.m” is a Matlab script used to load all the variables required for running the Simulink model and for post-processing. The drive cycle selection is also done here. Before running the Simulink vehicle model, run this initialization script.
- First the initialization file is loaded into the MATLAB.
%%%%%%%%%%%%%%%%%%%%%%%%%%%%%%%%%%%%%%%%%%%%%%%%%%%%%%%%%%%%%%%%%%%%%

%% Skill-Lync -> Hybrid Drives Development

% Project 2 - P1 Hybrid Vehicle Model


% Description:


%% Initialization File

% Initialization file for loading the variables for the Conventional vehicle simulation model


%% Vehicle Parameters

M = 1500;             % Vehicle weight [kg]

Cr = 0.015;           % Rolling resistance coefficient

Rw = 0.35;            % Rolling radius [m]

Cd = 0.33;            % Drag coefficient

Af = 2;               % Frontal area [m2]

rhoa = 1.225;         % Air density [kg/m3]

Vwind = 0;            % Wind velocity [kmph]

g = 9.81;             % Gravitational acceleration [m/s2]

theta = 0;            % Slope [deg]

myu_road_tire = 1;    % Coefficient of friction between tire - road interface


%% Powertrain Parameters

FDR = 3.73;                         % Final Drive Ratio / Diff Ratio

DiffEff = 0.99;                     % Differential efficiency (assumed independent of operating conditions)


NumGear = 4;                        % Number of gears in transmission

TransGear = (1:NumGear);            % Transmission Gears

TransRatio = [3.06, 1.62, 1, 0.7];  % Corresponding Transmission ratios

TransEff = 0.90;                    % Transmission efficiency (assumed independent of operating conditions)


TC_SR = [0, .5, .6, .7, .8, .87, .92, .94, .96, .97, 1];   % Torque Converter Speed Ratio (Matlab default) -> TurbSpd/PumpSpd

TC_TR = [2.232, 1.5462, 1.4058, 1.2746, 1.1528, 1.0732, 1.0192, 1, 1, 1, 1];   % Torque Converter Torque Ratio (Matlab default) -> TurbTrq/PumpTrq

TC_Cf = 1e-4 * [.72558, .66322, .63463, .59042, .51331, .4144, .29287, .22444, .12186, .04386, 0]; % Torque Converter Capacity Factor (Matlab default) -> PumpTrq/PumpSpd^2 [Nm/rpm^2]


load Vehicle_Data/Engine_data_1_9L_Saturn_95kW

load Vehicle_Data/Trans_Shift_map

load Vehicle_Data/EM_Honda_Insight_10kW

load Vehicle_Data/ESS_NiMH6


ESS_init_soc = 0.8;

ESS_soc_max = 0.9;

ESS_soc_min = 0.6;


%% Driver Parameters

Kp = 10;                    % P gain for driver PI model

Ki = 1;                     % I gain for driver PI model

Drive_Cycle_Select = 1;     % Drive cycle selection


% Drive cycle values in m/s


if Drive_Cycle_Select == 1

    load DriveCycles/UDDS;


elseif Drive_Cycle_Select == 2

    load DriveCycles/HWFET;


elseif Drive_Cycle_Select == 3

    load DriveCycles/FTP;


elseif Drive_Cycle_Select == 4

    load DriveCycles/US06;


elseif Drive_Cycle_Select == 5

    load DriveCycles/NEDC;


elseif Drive_Cycle_Select == 6

    load DriveCycles/WLTP;


end


time_end = cyc_time(end);

vel_end = cyc_vel(end);
Simulink Blocks:-
The below Simulink blocks are the blocks that are introduced in the Conventional Vehicle Simulink Model to make it a Hybrid Electric Vehicle Model. Also, there are some changes made to the existing blocks to function according to the new blocks and act as a complete Hybrid Drive. The P1 Parallel Hybrid concept is applied to this Hybrid Vehicle.
P1 Parallel Hybrid
The electric machine is connected directly to the crankshaft of the IC Engine. P0 and P1 architectures do not allow the mechanical disconnection of the electric machine from the engine. On the other side P2, P3 or P4 configurations disconnects the electric machine from the engine through a clutch.
A hybrid system that is connected directly to the crankshaft of the engine with some type of clutch/fluid coupling between the electric motor and the gearing.
Two examples of P1 MHEV architectures are:
- Honda Insight Hybrid 2009 (with Integrated Motor Assist technology)
- Mercedes Benz S400 Bluehybrid 2010
These systems are known as integrated motor-generator (IMG), integrated motor assist (IMA), and flywheel assist system (FAS).
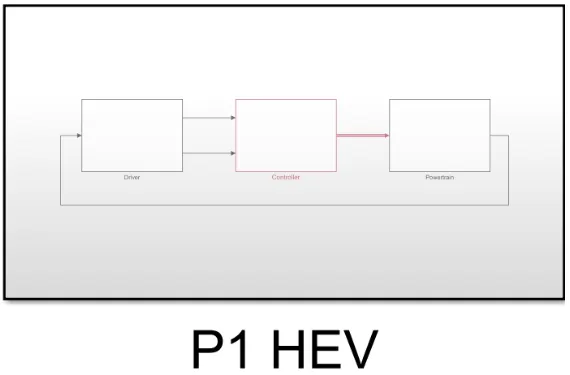
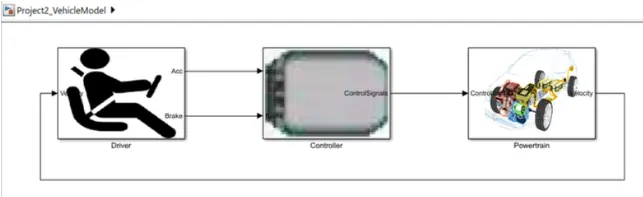
- Here we start with modelled using a ‘Driver model' block, which is a basic PI controller that generates accelerator and brake pedal outputs to match the desired and actual vehicle speeds.
- The ‘Controller model’ block is the brains of the vehicle, representing the electronic controls units. Based on the driver inputs, it generates desired engine torque, desired transmission gear and desired brake torque.
- These inputs are fed to the ‘Powertrain model’ block which represents the drivetrain of the vehicle. It consists of an ‘Engine model with Electric Motor’ connected to the ‘Automatic Transmission model’ through a ‘Torque Converter’. The output of the transmission is connected to the ’Differential’, which powers the ‘Wheels’, that provides the tractive force for vehicle acceleration. The longitudinal dynamics of the vehicle along with the road load is represented in the ‘Vehicle Dynamics model’ block.
Driver Model:
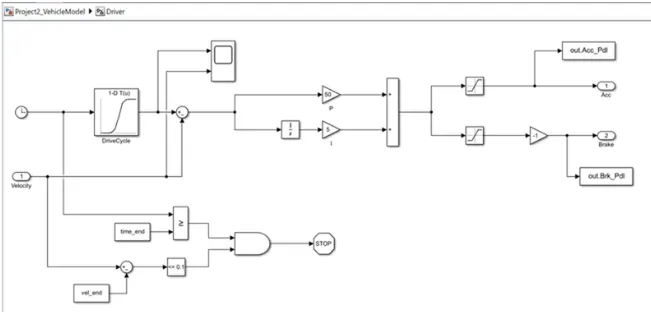
- "Driver model" block, which is a basic PI controller that generates accelerator and brake pedal outputs to match the desired and actual vehicle speeds.
- the PI controller control the error between the required drive cycle and actual vehicle speed by providing acceleration and brake pedal output to the controller.
Controller Model:
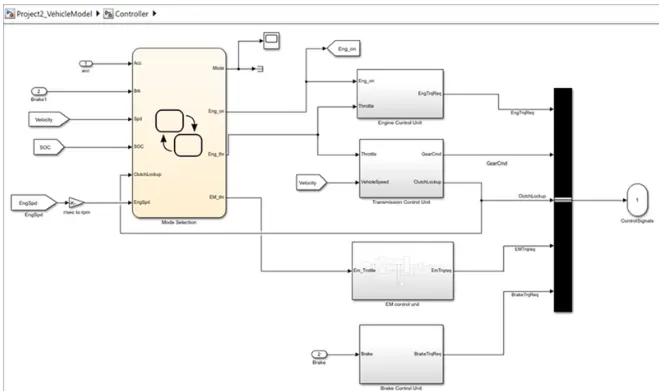
- The "Controller" block is the brains of the vehicle, representing the electronic controls units. Based on the driver inputs, it generates desired engine torque, desired transmission gear and desired brake torque. These inputs are fed to the "Powertrain" block which represents the drivetrain of the vehicle.
- a state flow machine is used to represent the supervisory control unit which decided the operating mode while it is start /stop mode or cruising mode or regen braking mode for each modes the engine drive and the motor driver are controlled.
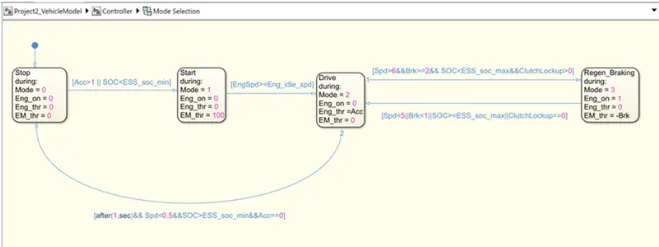
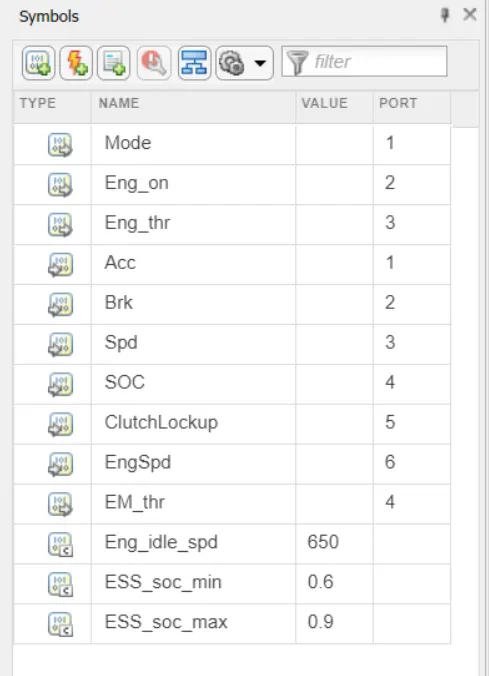
Input to the state flow charts is acc and brake pedal input from the driver unit engine actual speed actual vehicle speed soc status ant the clutch lockup state and the output to the controller are the mode engine on /off request engine input throttle and electric motor input throttle. all control signal passed to transmission model which represent the drive train.
Engine control unit:
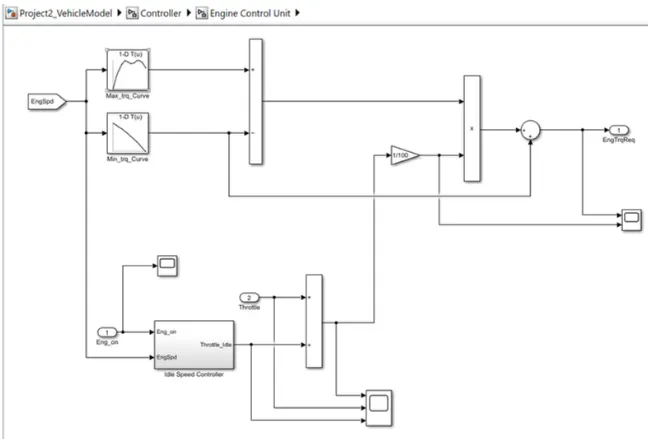
- Engine control unit compare engine speed with the maximum torque and minimum torque curve of the lookup table and give the required torque command to the engine block. the throttle input is combined with the idle speed throttle and gains with torque output from the lookup table to estimate the torque input required for the engine.
- Throttle input idle throttle and their sum can be scoped from this block.
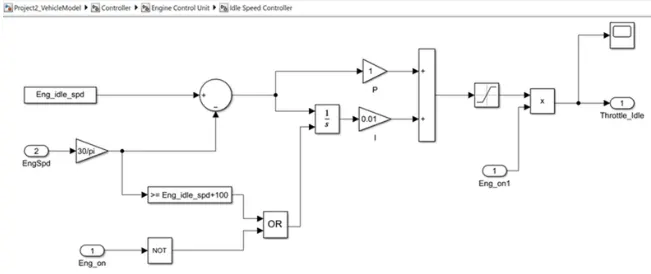
Idle speed controller:
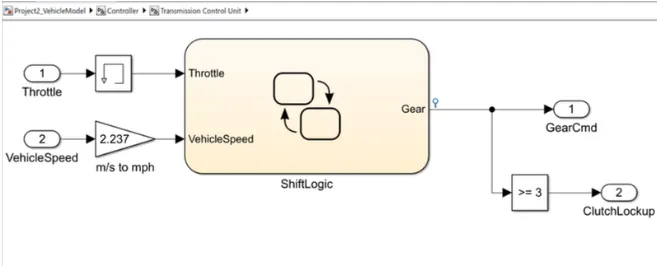
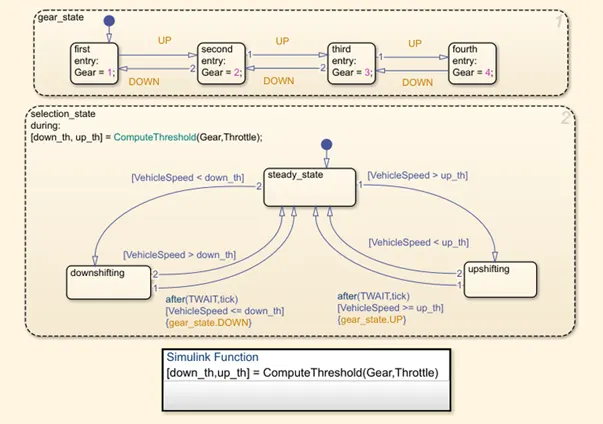
Transmission control block:
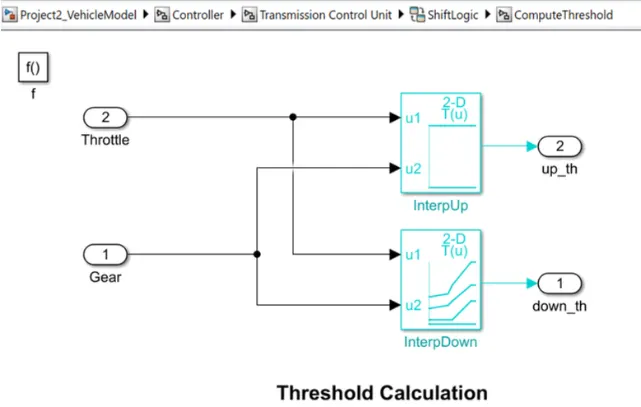
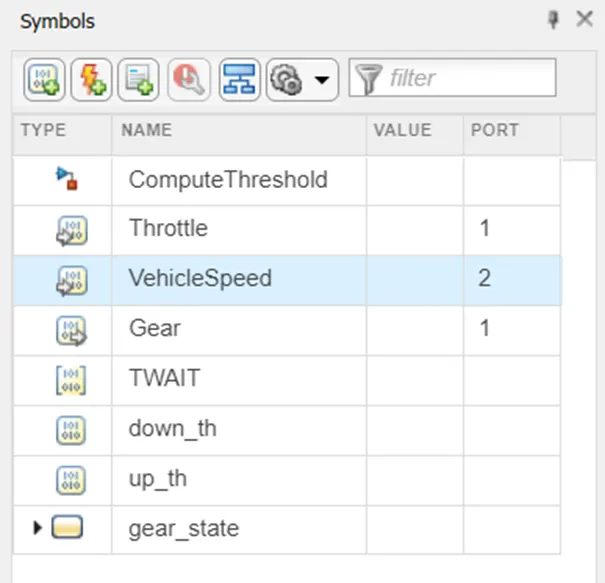
Simulink function for threshold calculaton:
Electric motor control unit:
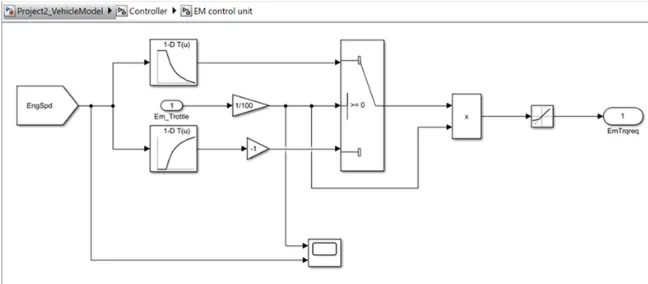
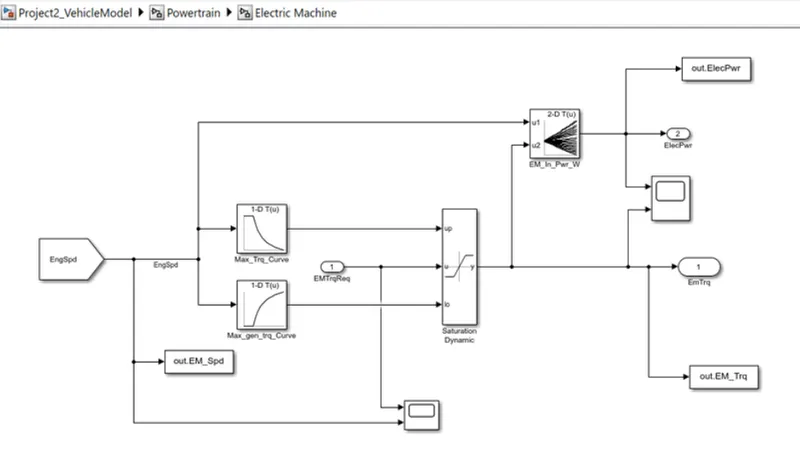
Motor control unit compare EM speed with the max torque curve and max torque generation curve of the lookup table and give the required torque command to the electric motor the EM throttle input is used to compare the lookup table and to estimate the torque input required for the e-motor.
Brake control unit:
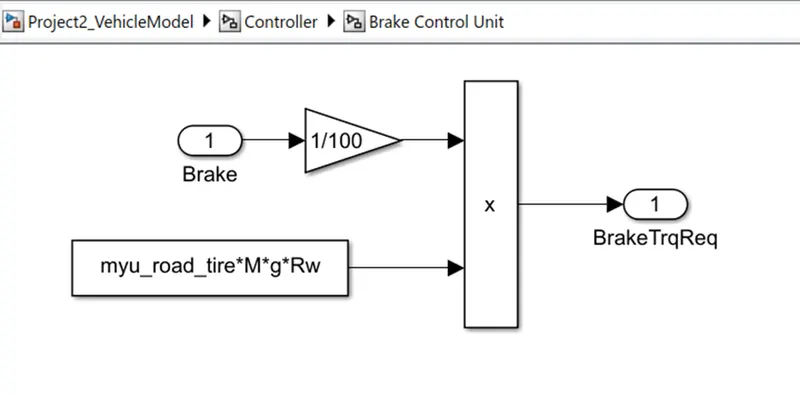
Brake control unit produce required brake torque according to the brake pedal input and passes the brake torque in to the wheel block in the transmission mode.
Battery model:
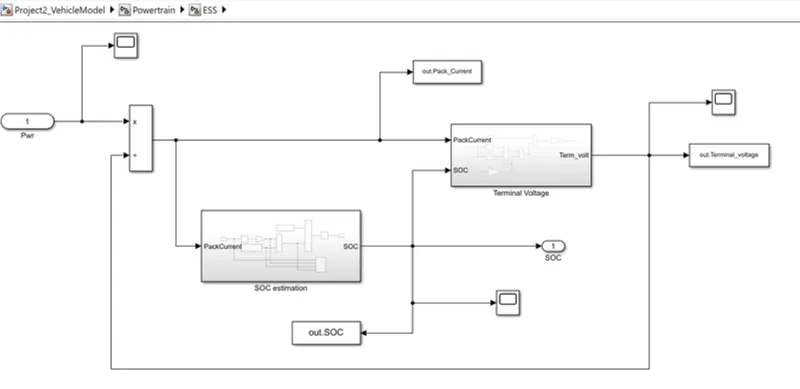
- A battery pack subsystem is created with electric power input and battery soc as output.
- 2 diff. subblock have been created to determine the soc and terminal voltage separately soc is used to determine the terminal voltage.
SOC Estimation model:
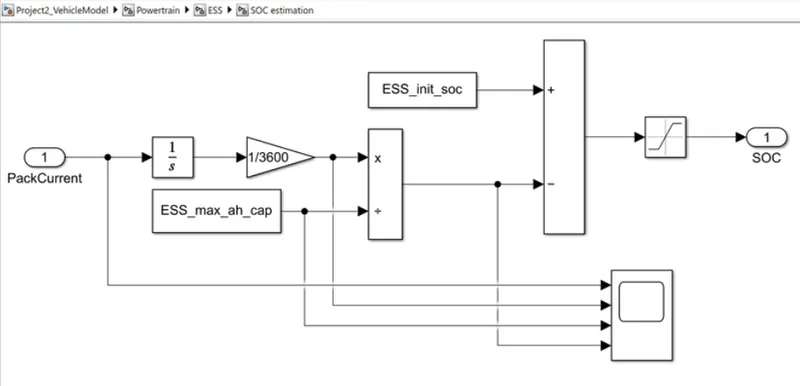
Pack current in ampere is converted to ampere and divides with max capacity and adds with the initial soc to determine the soc of the battery at each instance the soc value is limited between 0 to 1.
Terminal voltage model:
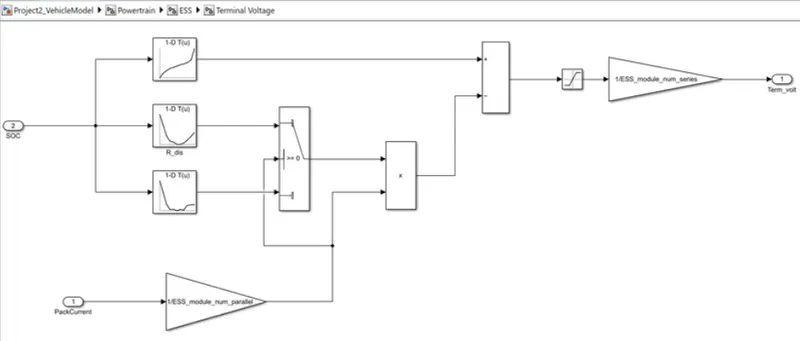
Ideal voltage and internal resistance are determined by 1D lookup table and battery voltage is determined using the model. The specified values are sent back to workspace using the to workspace block and can be used for postprocessing.
Engine model:
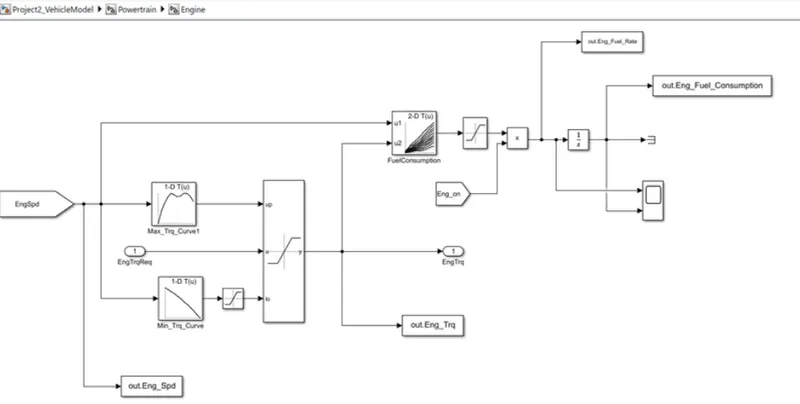
- Based on the engine speed the required torque from the controller is saturated between max torque curve and min torque curve and passes the engine torque to the transmission block.
- The 2D lookup table is used to calculate the fuel flow rate based on engine speed and engine torque.
- The new engine also has an on/off feature to eliminate the fuel flow rate when the engine is off also the engine torque cannot be negative torque as min. torque curve mode saturated.
- The fuel rate is then integrated to find the fuel consumption. Engine fuel flow rate and fuel consumption are scoped
Electric motor model:
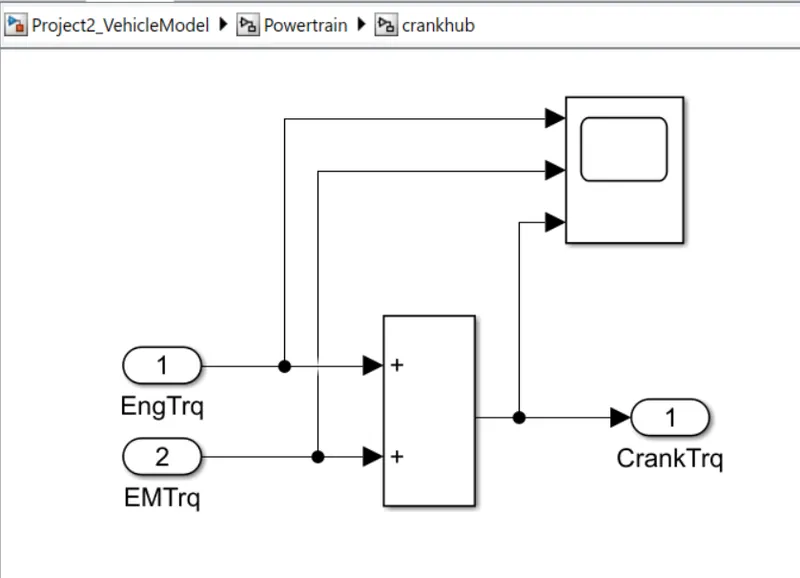
Crank hub:
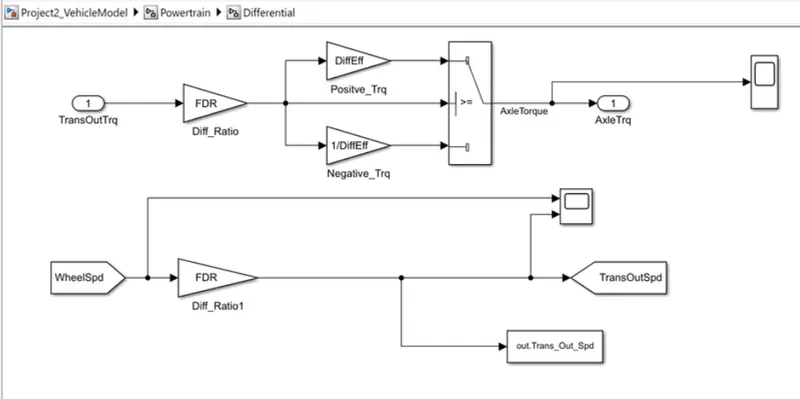
Differential Model:
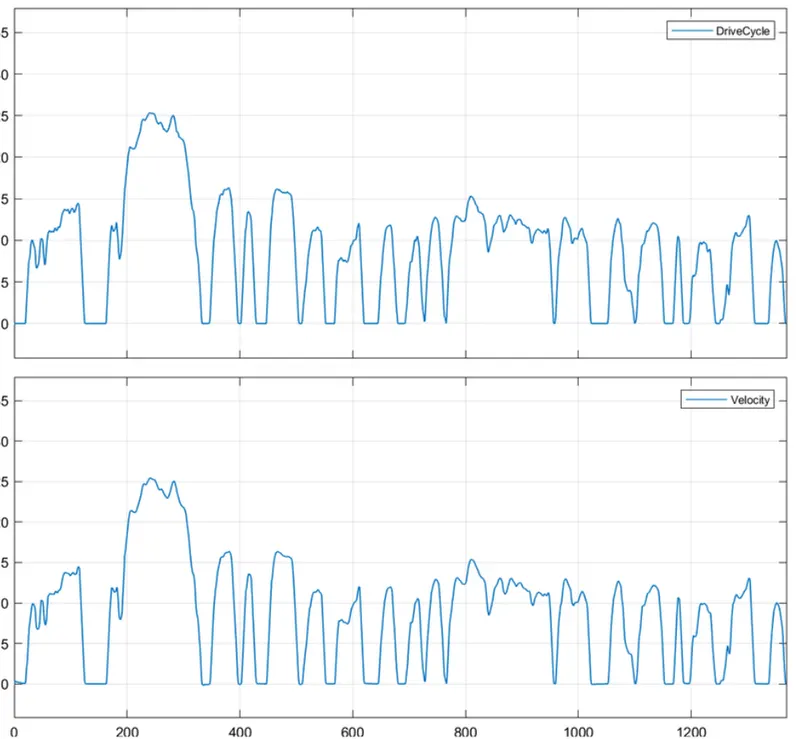
Output:
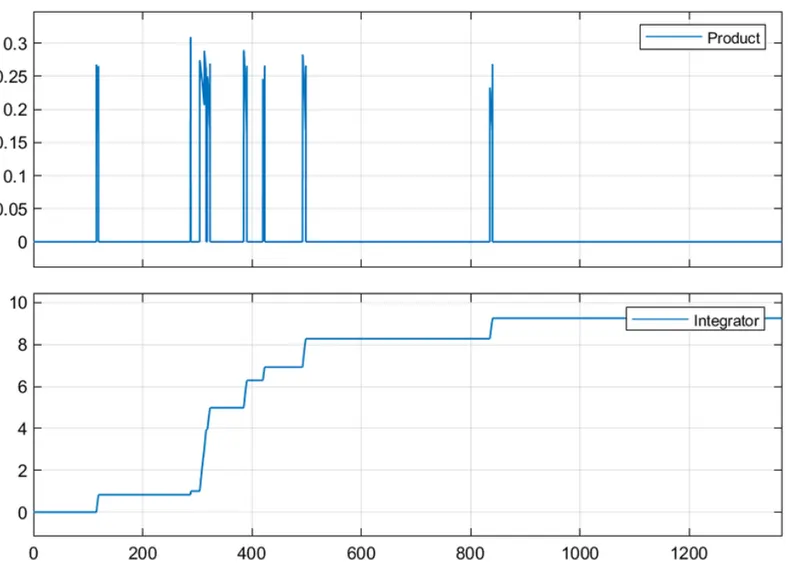
Engine fuel rate and fuel consumption:
Engine torque:
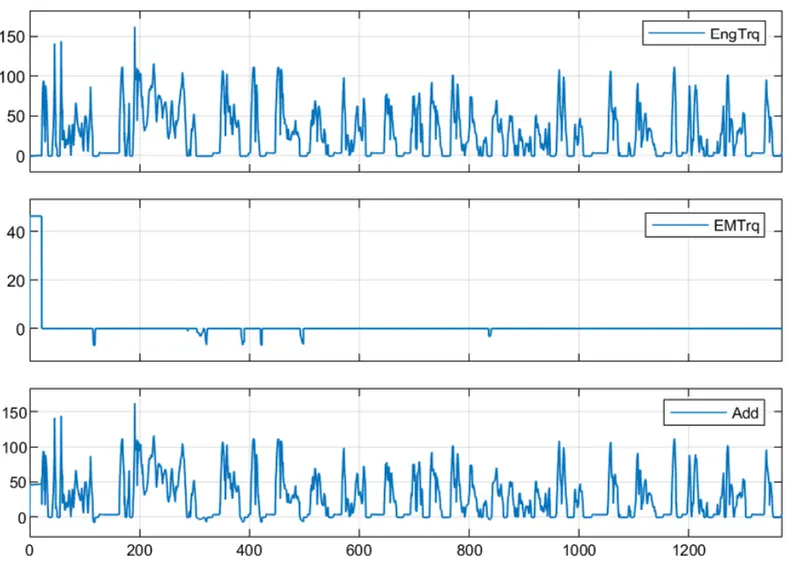
Electric Motor Torque:
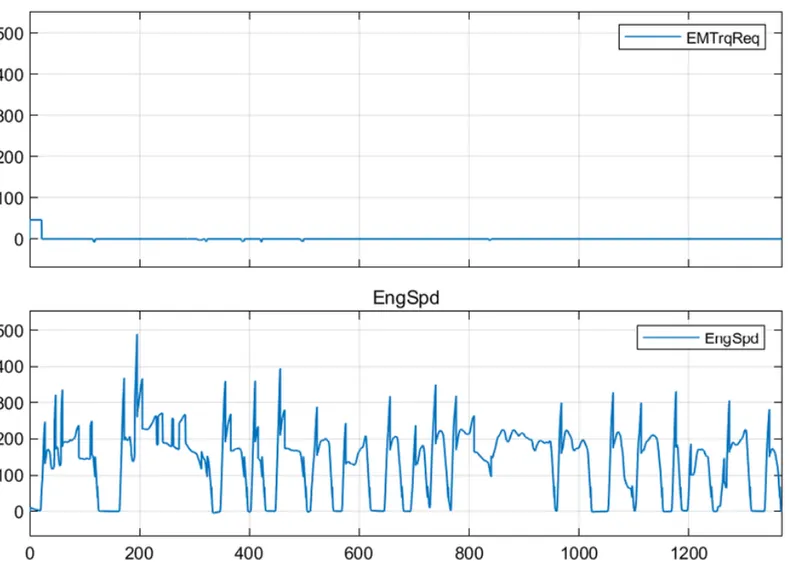
Crank Torque:
Gear ratio, Transmission input:
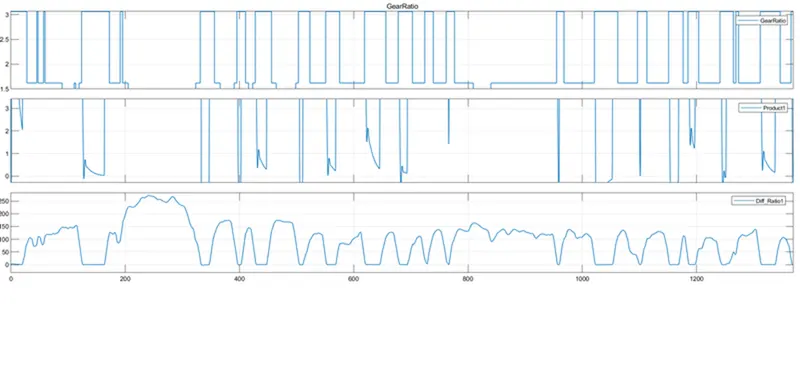
Pump Speed and Turbine Speed:
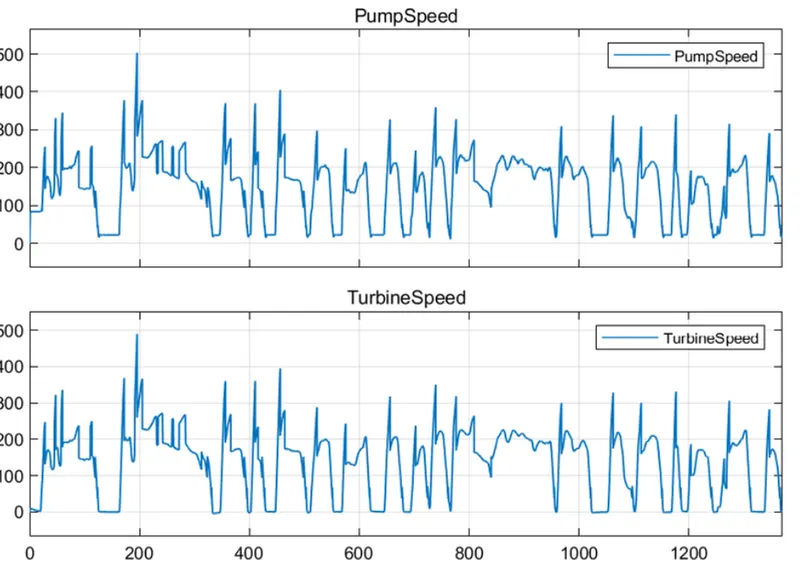
Project2_ProcessingFile:-
“Project2_ProcessingFile.m” is the Matlab script used to analyze the data and generate plots. This script needs to be executed after the Simulink model variable data has been loaded into the workspace. In this script 'to workspace' variables from Simulink Model are loaded (if desired).
After some basic post-processing calculations, desired results and plots are generated.
%%%%%%%%%%%%%%%%%%%%%%%%%%%%%%%%%%%%%%%%%%%%%%%%%%%%%%%%%%%%%%%%%%%%%
%% Skill-Lync -> Hybrid Drives Development
% Project 2 - P1 Hybrid Electric Vehicle Model

% Description:
% The following file is to used with the Initialization file and Simulink
% results for post-processing of the data.
% The file is incomplete, has some examples of how the data is imported
% into a readable format, data analysis and plotting examples.
% Based on the project task, use commands in a similar format as given
% below, to analyse the data and generate required plots.
% You can change variable names if desired

%% Post-Processing File
%  File for post-processing the P1 Hybrid Electric Vehicle simulation model data

%% Renaming variables
Time = out.tout;
Acc_Pdl = out.Acc_Pdl;                           % Accelerator pedal [%]
Brk_Pdl = out.Brk_Pdl;                           % Brake pedal [%]
Gear_Cmd = out.Gear_Cmd;                         % Transmission gear
Trans_In_Spd = out.Trans_In_Spd*30/pi;           % Transmission input speed [rpm]
Trans_Out_Spd = out.Trans_Out_Spd*30/pi;         % Transmission output speed [rpm]
Eng_Trq = out.Eng_Trq;                           % Engine brake torque [Nm]
Eng_Spd = out.Eng_Spd*30/pi;                     % Engine speed [rpm]
Eng_Fuel_Consump = out.Eng_Fuel_Consumption;     % Engine fuel consumption [g]
Veh_Dist = out.Veh_Dist/1000;                    % Distance traveled by vehicle [km]
Veh_Spd = out.Veh_Spd*18/5;                      % Vehicle speed [kmph]
Eng_Fuel_Rate = out.Eng_Fuel_Rate;               % Engine fuel rate [%]
EM_Spd = out.EM_Spd*30/pi;                       % Motor speed [rpm]
EM_Trq = out.EMTrq;                              % Motor torque [Nm]
EM_Pwr = out.ElecPwr;                            % Motor input power [kW]
PackCurrent = out.PackCurrent;                   % Packcurrent
SOC = out.SOC;                                   % State of charge
Voltage = out.Term_voltage;                      % Voltage

%% Data Analysis
Eng_Pwr = Eng_Spd.*pi./30.*Eng_Trq./1000;                     % Engine brake power [kW]
rho_petrol = 0.7197;                                          % Density of petrol [kg/L]
kmpl = Veh_Dist(end)/(Eng_Fuel_Consump(end)/1000/rho_petrol); % Fuel economy [kmpl]


%% Plotting vehicle characteristics time trace
figure()
subplot(3,1,1)
hold on
grid on
plot(Time, Acc_Pdl, 'linewidth', 1, 'Color', 'black');
plot(Time, Brk_Pdl, 'linewidth', 1, 'Color', 'red');
ylabel('Pedal [%]')
xlim([0, Time(end)]);
legend('Accel','Brake');
subplot(3,1,2)
hold on
grid on
plot(Time, Trans_In_Spd, 'linewidth', 1, 'Color', 'black');
plot(Time, Trans_Out_Spd, 'linewidth', 1, 'Color', 'red');
ylabel('Speed [rpm]')
xlim([0, Time(end)]);
ylim([0, 6000]);
legend('Trans Input','Trans Output');
subplot(3,1,3)
hold on
grid on
plot(Time, Gear_Cmd, 'linewidth', 1, 'Color', 'black');
xlim([0, Time(end)]);
xlabel('Time [s]');
ylabel('Gear');

%% Plotting engine operating points on engine fuel map
figure('Name','Engine Operating Points');
hold on
grid on
title('Engine Operating Points','fontsize',12);
p1=plot(Eng_map_spd*30/pi,Eng_max_trq,'linewidth',2,'color','r');
p2=line([Eng_map_spd(end)*30/pi Eng_map_spd(end)*30/pi],[0 Eng_max_trq(end)]);
set(p2,'linewidth',1,'linestyle','--','color','k');
p3=line([Eng_map_spd(1)*30/pi Eng_map_spd(1)*30/pi],[0 Eng_max_trq(1)]);
set(p3,'linewidth',1,'linestyle','--','color','k');
[c,h] = contour(Eng_map_spd'*30/pi,Eng_map_trq,Eng_fuel_map');
clabel(c,h);
xlabel('Engine Speed [rpm]');
ylabel('Engine Torque [Nm]');
title('Engine Fuel Consumption Map [g/s]');
p4 = plot(Eng_Spd,Eng_Trq,'.','color','k');
legend([p1 p4],{'Max Curve','Operating Points'});
axis([Eng_map_spd(1)*30/pi Eng_map_spd(end)*30/pi 0 Eng_map_trq(end)]);

%% Engine outputs
figure(3)
subplot(3,2,1)
grid on
plot(Time,Eng_Fuel_Rate, 'linewidth', 1, 'Color', 'black')
xlabel('Time [s]')
ylabel('Engine Fuel Rate [%]')
subplot(3,2,2)
grid on
plot(Time,Eng_Fuel_Consump, 'linewidth', 1, 'Color', 'red')
xlabel('Time [s]')
ylabel('Engine Fuel Consumption [g]')
subplot(3,2,3)
grid on
plot(Time,Eng_Trq, 'linewidth', 1, 'Color', 'black')
xlabel('Time [s]')
ylabel('Engine Torque [Nm]')
subplot(3,2,4)
grid on
plot(Time,Eng_Spd, 'linewidth', 1, 'Color', 'red')
xlabel('Time [s]')
ylabel('Engine Speed [rpm]')
subplot(3,2,5)
grid on
plot(Time,Eng_Pwr, 'linewidth', 1, 'Color', 'black')
xlabel('Time [s]')
ylabel('Engine brake power [kW]')

%% Vehicle Dynamics
figure(4)
subplot(2,1,1)
grid on
plot(Time, Veh_Spd, 'linewidth', 1, 'Color', 'black')
xlabel('Time [s]')
ylabel('Vehicle Speed [kmph]')
subplot(2,1,2)
grid on
plot(Time, Veh_Dist, 'linewidth', 1, 'Color', 'red')
xlabel('Time [s]')
ylabel('Distance traveled by vehicle [km]')

%% Motor
figure(5)
subplot(3,1,1)
grid on
plot(Time, EM_Spd, 'linewidth', 1, 'Color', 'black')
xlabel('Time [s]')
ylabel('Motor speed [rpm]')
subplot(3,1,2)
grid on
plot(Time, EM_Trq, 'linewidth', 1, 'Color', 'red')
xlabel('Time [s]')
ylabel('Motor torque [Nm]')
subplot(3,1,3)
grid on
plot(Time, EM_Pwr, 'linewidth', 1, 'Color', 'black')
xlabel('Time [s]')
ylabel('Motor input power [kW]')

%% Batery
figure(6)
subplot(3,1,1)
grid on
plot(Time, PackCurrent, 'linewidth', 1, 'Color', 'black')
xlabel('Time [s]')
ylabel('Packcurrent [Amp]')
subplot(3,1,2)
grid on
plot(Time, SOC, 'linewidth', 1, 'Color', 'red')
xlabel('Time [s]')
ylabel('State of charge')
subplot(3,1,3)
grid on
plot(Time, Voltage, 'linewidth', 1, 'Color', 'black')
xlabel('Time [s]')
ylabel('Voltage [V]')

%% Motor operating points on the motor input power map
figure('Name','Motor Operating Points');
hold on
grid on
title('Motor Operating Points','fontsize',12);
p1=plot(EM_map_spd*30/pi,EM_max_trq,'linewidth',2,'color','r');
p2=line([EM_map_spd(end)*30/pi EM_map_spd(end)*30/pi],[0 EM_max_trq(end)]);
set(p2,'linewidth',1,'linestyle','--','color','k');
p3=line([EM_map_spd(1)*30/pi EM_map_spd(1)*30/pi],[0 EM_max_trq(1)]);
set(p3,'linewidth',1,'linestyle','--','color','k');
[c,h] = contour(EM_map_spd'*30/pi,EM_map_trq,EM_inpwr_map');
clabel(c,h);
xlabel('Motor Speed [rpm]');
ylabel('Motor Torque [Nm]');
title('Motor Input Power Map [kW]');
p4 = plot(EM_Spd,EM_Trq,'.','color','k');
legend([p1 p4],{'Max Curve','Operating Points'});
axis([EM_map_spd(1)*30/pi EM_map_spd(end)*30/pi 0 EM_map_trq(end)]);
Fuel Economy (kmpl):-
Drive Cycle UDDS
The EPA Urban Dynamometer Driving Schedule (UDDS) is commonly called the "LA4" or "the city test" and represents city driving conditions. It is used for light-duty vehicle testing. The UN/ECE Regulation 53 refers to the EPA UDDS as the "Test Equivalent to the Type 1 Test (verifying emissions after a cold start)."
Fuel economy is 14.2044 [kmpl] (Project 1)
Fuel economy is 26.4945 [kmpl] (Project 2)
For Project 2, the value of the Fuel economy which is a P1 Hybrid Electric Vehicle is much better than that of the Conventional Vehicle fuel economy from Project 1.
Drive Cycle HWFET
The Highway Fuel Economy Driving Schedule (HWFET) represents highway driving conditions under 60 mph.
Fuel economy is 16.5010 [kmpl] (Project 1)
Fuel economy is 36.9793 [kmpl] (Project 2)
In the Highway case also the fuel economy of the Project 2 is better than that of Project 1.
As per the Drive Cycles, in the city condition, the fuel economy is not as great/much as in the highway condition. This is the same in both Project 1 and Project 2. This is because generally in the city condition due to more traffic, waiting time for the vehicle increases, and also, starting and stopping the vehicle repeatedly due to traffic consumes more fuel. Gives more fuel consumption and also increases the fuel rate resulting in less fuel economy than that highways.
Plots:-
UDDS Drive Cycle:
Time trace for the engine
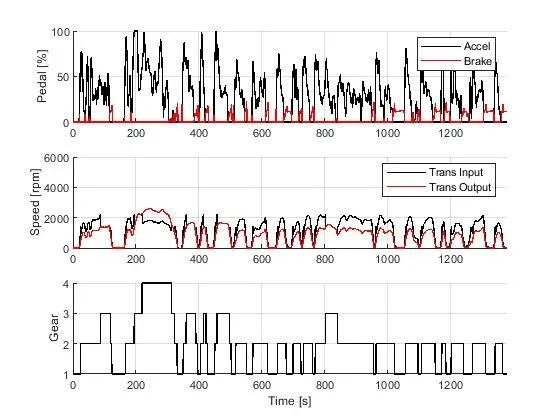
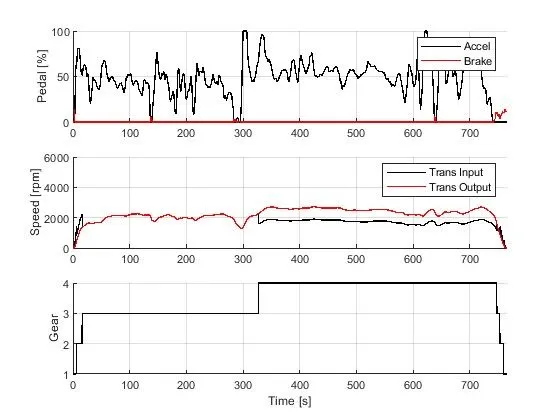
Comparing plots for both the drive cycles, the brake pedal has more movements in city conditions and less or remains constant for most of the time in highway conditions. It can also be seen that with an increase in gear, the accelerator pedal increases and there is no movement with the brake pedal. The speed increases with the moment of transmission input and output. Speed seems to be zero when there is movement in the brake pedal.
The vehicle reaches max gear only once in this UDDS drive cycle, the maximum time it is in 2nd or 3rd gear. Whereas in HWFET drive cycle vehicle is in 3rd or highest gear which at 4th most of the time.
HWFET Drive Cycle:
Time trace for the engine
UDDS Drive Cycle:
Engine Fuel Consumption The Map
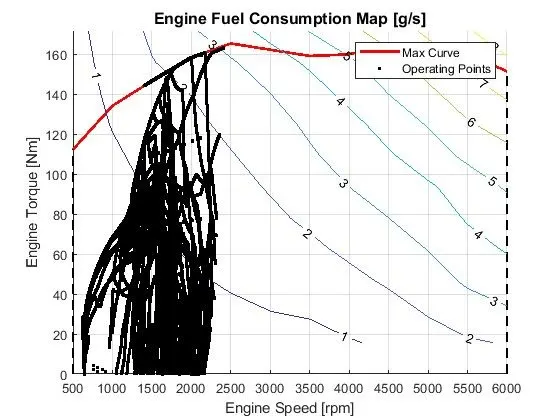
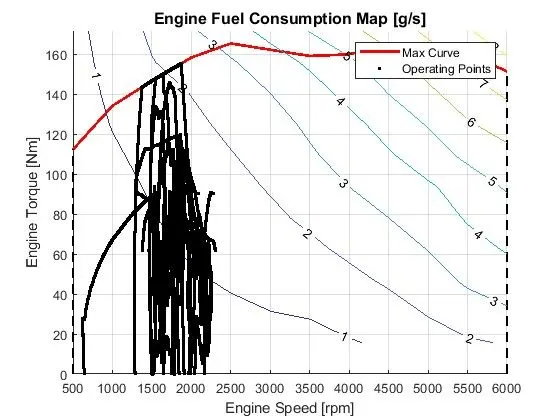
Max curve remains the same for both the drive cycles. Operating points of the UDDS drive cycle seem to be moving at a slower pace to higher Engine Speed from starting. But not in the case of the HWFET drive cycle, operating points move towards a higher speed at an instant from the starting point. Operating points on the highway seem more stable than in the city condition.
HWFET Drive Cycle:
Engine Fuel Consumption Map
UDDS Drive Cycle:
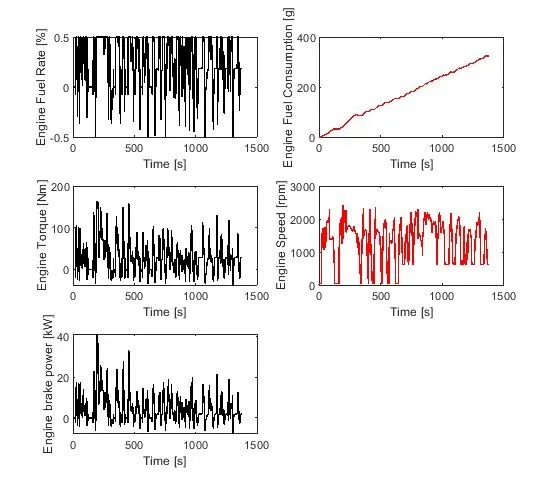
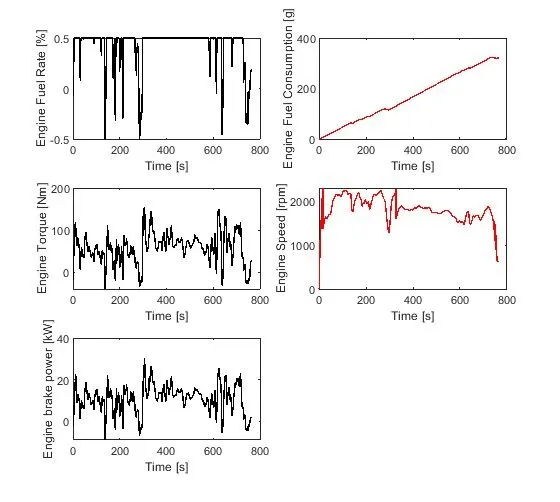
In the below plot with an increase in Engine torque, brake power increases and when there is a decrease in Engine torque, brake power also decreases. Comparing the drive cycles, in UDDS, more fluctuations can be seen than in the HWFET condition. Both have a negative value as well.
Engine fuel rate and Engine speed plot have almost the same movement as the other plots. Engine Speed in highway conditions is at maximum and most of the time consistent without any fluctuation. In city conditions, the Engine Speed fluctuates most of the time and is not consistent.
Engine fuel consumption gradually increases as the Engine fuel rate in both drive cycles.
HWFET Drive Cycle:
UDDS Drive Cycle:
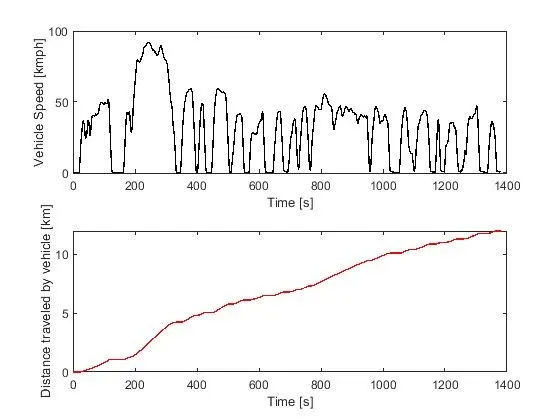
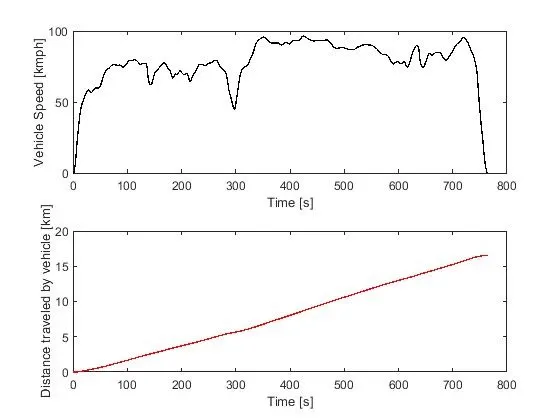
In UDDSthe drive cycle the Vehicle speed oscillate more than that of the HWFET condition. In highway conditions, the Vehicle Speed seems to be consistent, ent and the vehicle moves at high speed most of the distance traveled.
Distance traveled by the vehicle curve in the UDDS drive cycle seems to have some slight up and down movements whereas in highway conditions the distance traveled curve is a straight line without any up and down movements.
HWFET Drive Cycle:
UDDS Drive Cycle:
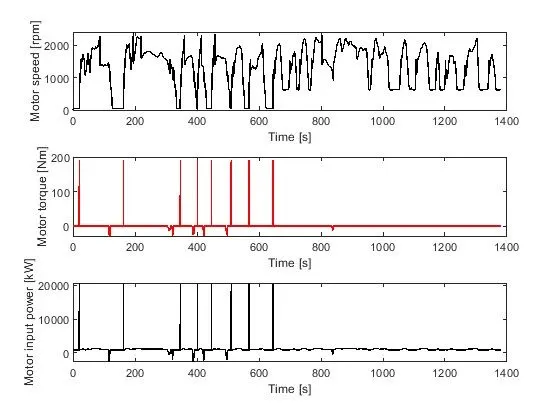
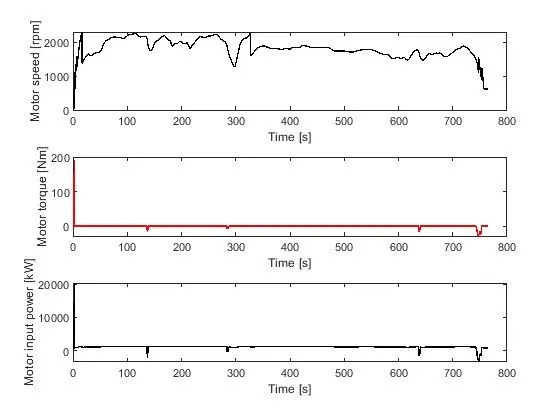
In the below case of the Motor, the pattern or the reaction of the curves is the same. Motor input power follows the Motor torque curve pattern in both drive cycles. The pattern of the Motor speed and Motor torque is iso the same in both drive cycles. With the speed, the curve increases torque curve also increases but when the vehicle is at moving at some speed the Motor torque stays at 0 and this movement is similar in both drive cycles.
The oscillation of the Motor speed curve is more in UDDS drive cycle and the vehicle is moving at maximum Motor speed consistently in the HWFET drive cycle.
HWFET Drive Cycle:
UDDS Drive Cycle:
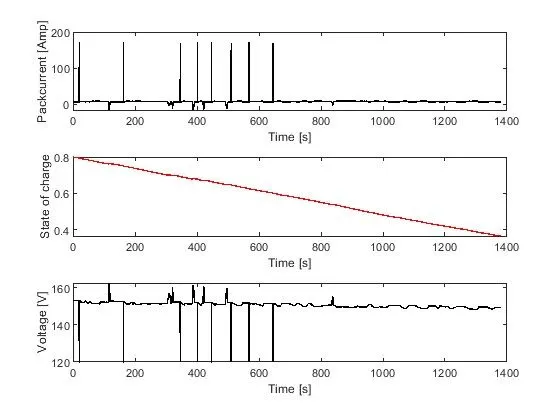
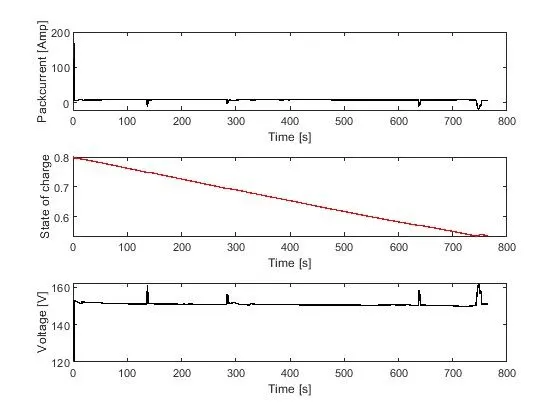
The Packcurrent and Voltage curve are opposite to each other. Increasing in Packcurrent, Voltage decreases, and vice versa. This movement is the same for both drive cycles. SOC curve gradually decreases as the battery is discharging due to the usage by the Motor and it is similar in both the drive cycles.
Due to the city conditions, the UDDS drive cycle has oscillation in the curve whereas in highway conditions HWFET drive cycle does not have any.
HWFET Drive Cycle:
UDDS Drive Cycle:
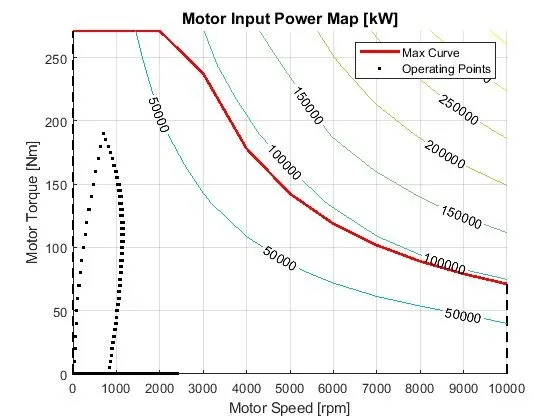
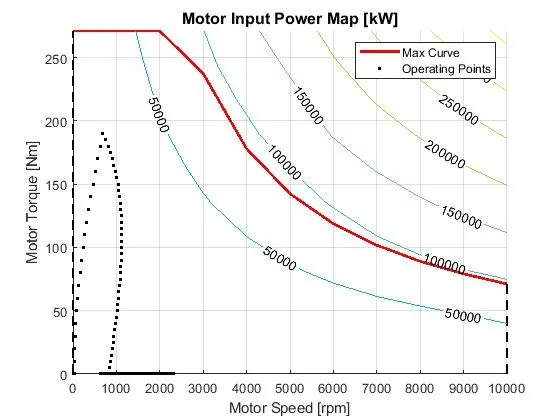
In Motor Input Power Map for both UDDS and HWFET drive cycles, the max curve remains the same. Even the movements of the Operating points do not have any variations.
HWFET Drive Cycle:
THANK YOU.