AIM- development of a forward energy-based fuel consumption model of a P1 hybrid vehicle.
objective-a. Tabulate the fuel economy numbers (kmpl) for UDDS and HWFET cycle. Compare these numbers with the baseline numbers for conventional vehicle model from Project 1.
b. Plot the time trace for engine, transmission input, transmission output and wheel speed on one plot.
c. Plot engine torque, engine power, fuel rate and fuel consumption using subplots.
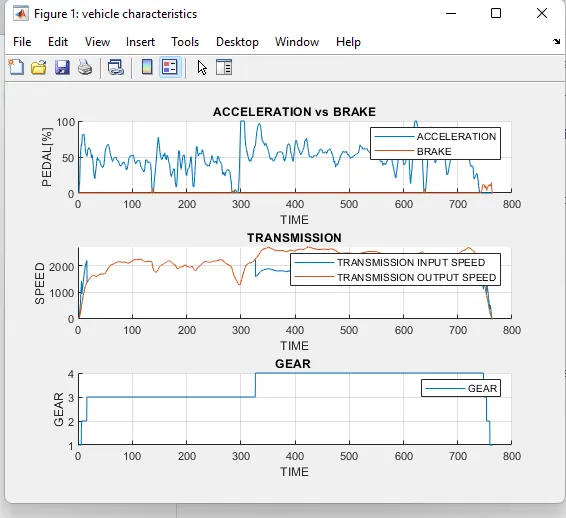
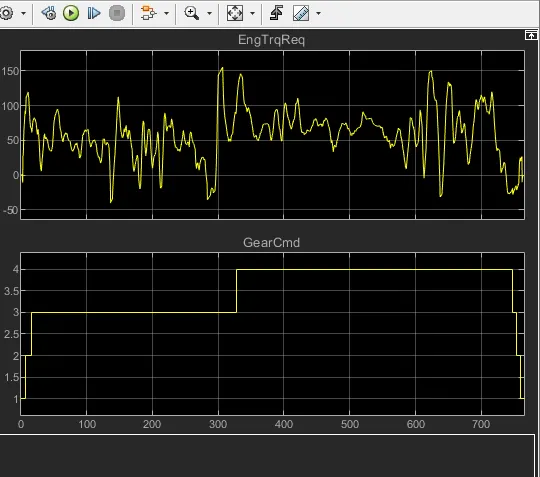
d. Plot accelerator and brake pedal, gear command, vehicle desired and actual speed, vehicle distance using subplots.
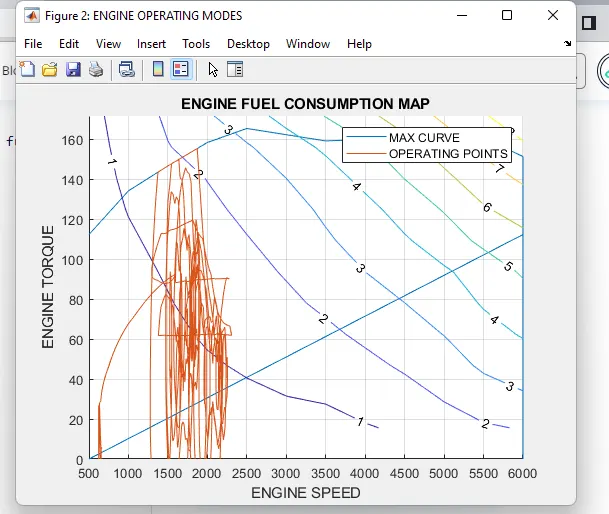
e. Plot the engine operating points on the engine fuel map.
f. Plot motor speed, torque, motor input power using subplots.
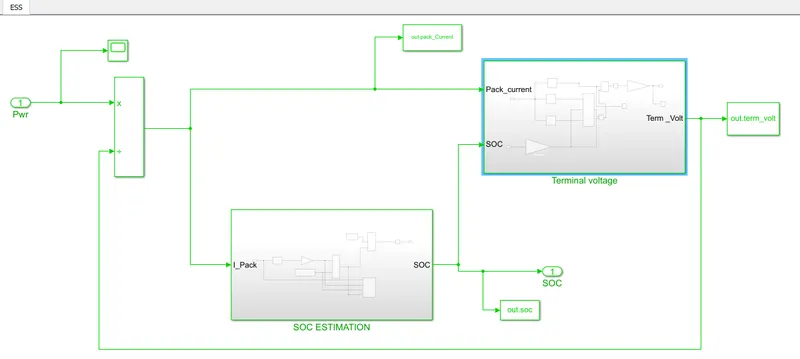
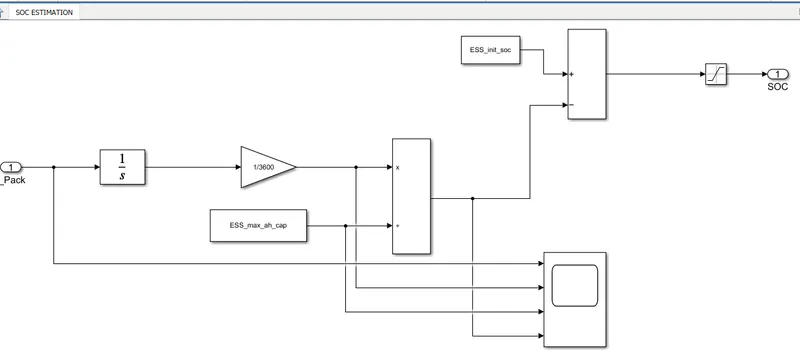
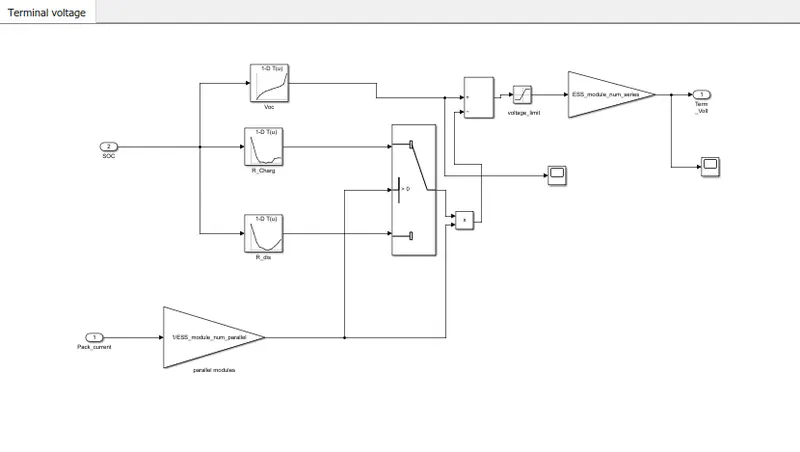
g. Plot pack voltage, current and SoC using subplots.
h. Plot the motor operating points on the motor input power map, with the motor max motoring and generating torque curves.
i. Write down appropriate brief comments on each of these plots, describing the vehicle behavior throughout the drive cycle.
j. Generate the plots for both drive cycles
Theory:-
P1 Mild Hybrid Electric Vehicle:-
The P1 architecture, with the electric machine connected directly to the crankshaft, is the solution adopted by Honda on their first generation Integrated Motor Assist (IMA) technology. The electric motor functions as a generator, during vehicle deceleration, as an engine starter, and as a motor (to assist the engine) during vehicle accelerations. One of the biggest advantage of this solution is that the electric motor can provide higher torque than the BiSG, since there is no belt limitation (due to slip). However, since there is no speed / torque ratio between the electric machine and crankshaft, the torque requirements on the electric motor can be quite demanding.
Two examples of P1 MHEV architectures are:
- Honda Insight Hybrid 2009 (with Integrated Motor Assist technology)
- Mercedes Benz S400 Bluehybrid 2010
For example, the main characteristics of the P1 MHEV.
1] ELectric Machine Performance:-
Maximum torque up to 34 Nm.
Maximum power: 10KW
Efficiency: Up to 94 Percent
2] Hybrid Modes:-
Idle stop and stop
Moving stop and start
Engine load shift
Torque assist
Torque boost
Energy recuperation
Brake generation
3] Advantages:-
Higher efficiency
The 12V starter can be removed
4] Disadvantages:-
Output torque limited by thje size of the elctric machine
Energy recuperation affected by engine friction losses
High impact on existing vehicle architecture
Higher overall cost of the electrical components
Air cooling not possible for electric machine
5] Overall charcteristics:-
Toruqe Boosting capacity: High
Electrical energy recuperation: Medium
Driveability improvements: Medium
Electrical Creep/drive: Possible
In this model We use Forward Model:-
It also known as dynamic simulation. Dynamic models are used for detailed simulations. In this model force/torque/power is the input and the vehicle state variable velocity and acceleration are outputs. The models and simulatios are more realistic due to phhysical casualty hence appropriate for control development. There is feedback loop to meet the desired vehicle state. It is mainly used to simulate a vehicle on a driving cycle to analyse the dynamic behaviour of the system helps significantly in control development.
Process:-
Load the Project2 folder as the Current Folder in Matlab.
Run the “Project2_InitFile.m” Matlab script.
The Drive cycle selection is done here.
% Description:
%% Initialization File
% Initialization file for loading the variables for the Conventional vehicle simulation model
%% Vehicle Parameters
M = 1500; % Vehicle weight [kg]
Cr = 0.015; % Rolling resistance coefficient
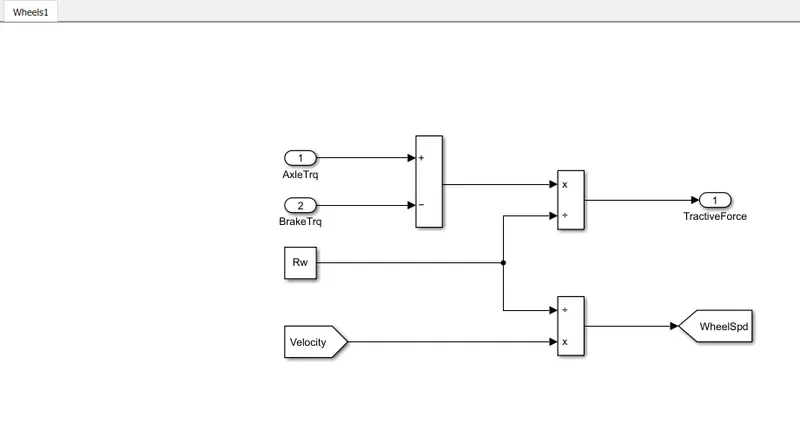
Rw = 0.35; % Rolling radius [m]
Cd = 0.33; % Drag coefficient
Af = 2; % Frontal area [m2]
rhoa = 1.225; % Air density [kg/m3]
Vwind = 0; % Wind velocity [kmph]
g = 9.81; % Gravitational acceleration [m/s2]
theta = 0; % Slope [deg]
myu_road_tire = 1; % Coefficient of friction between tire - road interface
%% Powertrain Parameters
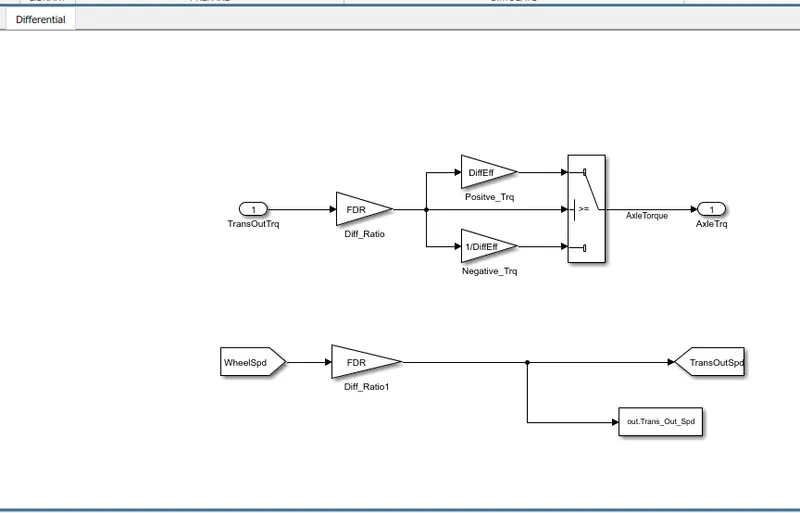
FDR = 3.73; % Final Drive Ratio / Diff Ratio
DiffEff = 0.99; % Differential efficiency (assumed independent of operating conditions)
NumGear = 4; % Number of gears in transmission
TransGear = [1:NumGear]; % Transmission Gears
TransRatio = [3.06, 1.62, 1, 0.7]; % Corresponding Transmission ratios
TransEff = 0.90; % Transmission efficiency (assumed independent of operating conditions)
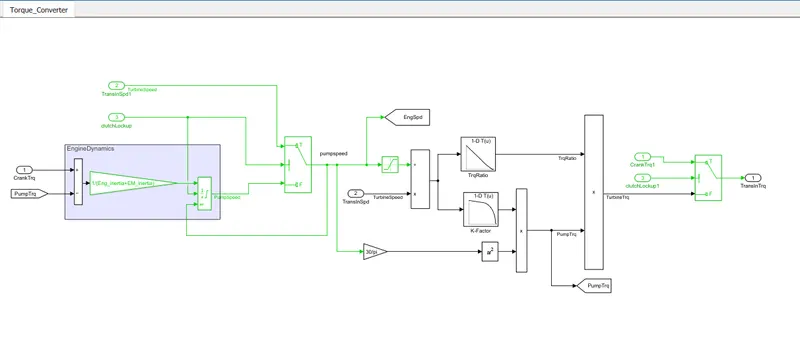
TC_SR = [0, .5, .6, .7, .8, .87, .92, .94, .96, .97, 1]; % Torque Converter Speed Ratio (Matlab default) -> TurbSpd/PumpSpd
TC_TR = [2.232, 1.5462, 1.4058, 1.2746, 1.1528, 1.0732, 1.0192, 1, 1, 1, 1]; % Torque Converter Torque Ratio (Matlab default) -> TurbTrq/PumpTrq
TC_Cf = 1e-4 * [.72558, .66322, .63463, .59042, .51331, .4144, .29287, .22444, .12186, .04386, 0]; % Torque Converter Capacity Factor (Matlab default) -> PumpTrq/PumpSpd^2 [Nm/rpm^2]
load Vehicle_Data/Engine_data_1_9L_Saturn_95kW
load Vehicle_Data/Trans_Shift_map
load Vehicle_Data/EM_Honda_Insight_10kW
load Vehicle_Data/ESS_NiMH6
ESS_init_soc = 0.8;
ESS_soc_max = 0.9;
ESS_soc_min = 0.6;
%% Driver Parameters
Kp = 10; % P gain for driver PI model
Ki = 1; % I gain for driver PI model
Drive_Cycle_Select = 1; % Drive cycle selection
% Drive cycle values in m/s
if Drive_Cycle_Select == 1
load DriveCycles/UDDS;
elseif Drive_Cycle_Select == 2
load DriveCycles/HWFET;
elseif Drive_Cycle_Select == 3
load DriveCycles/FTP;
elseif Drive_Cycle_Select == 4
load DriveCycles/US06;
elseif Drive_Cycle_Select == 5
load DriveCycles/NEDC;
elseif Drive_Cycle_Select == 6
load DriveCycles/WLTP;
end
time_end = cyc_time(end);
vel_end = cyc_vel(end);
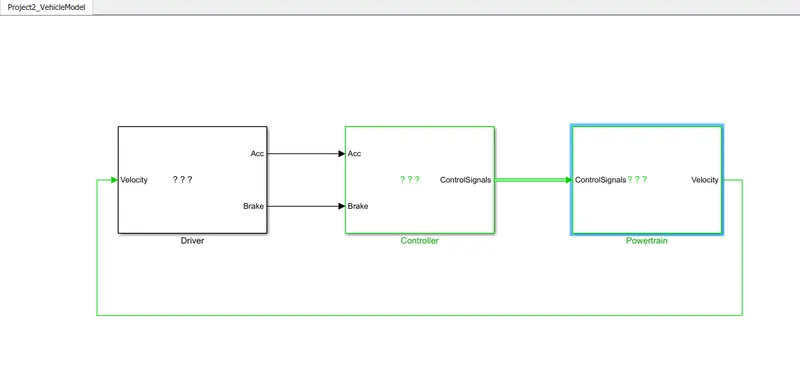
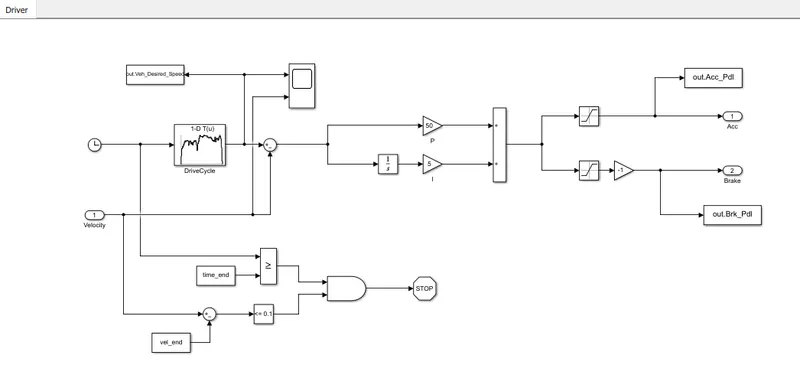
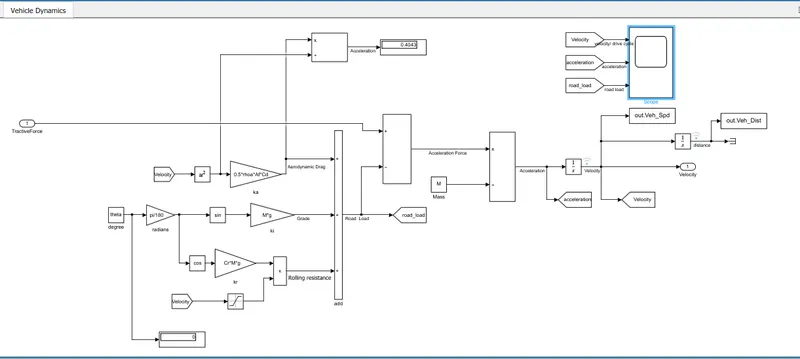
vehical model
1)driver
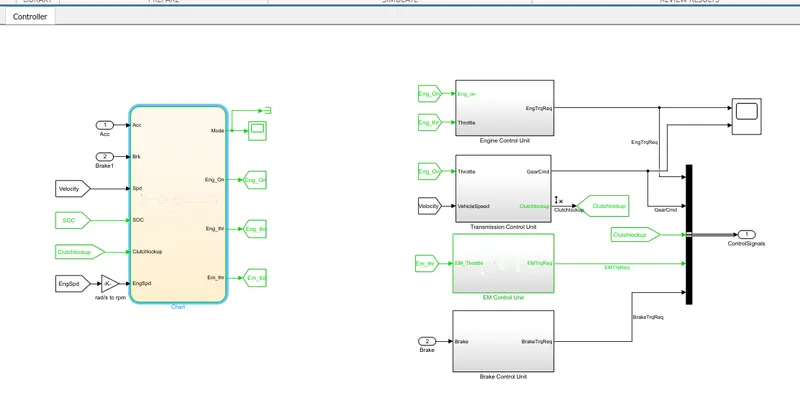
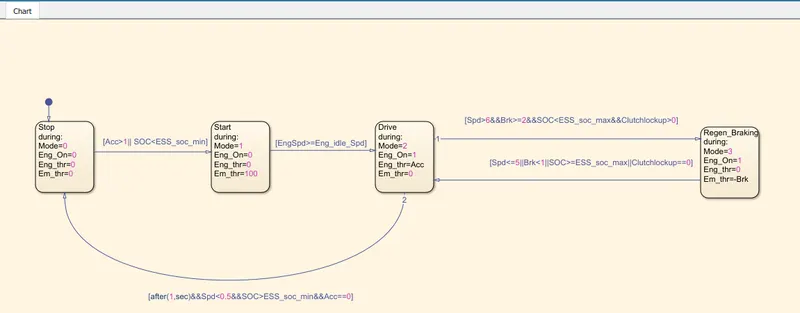
2)controller
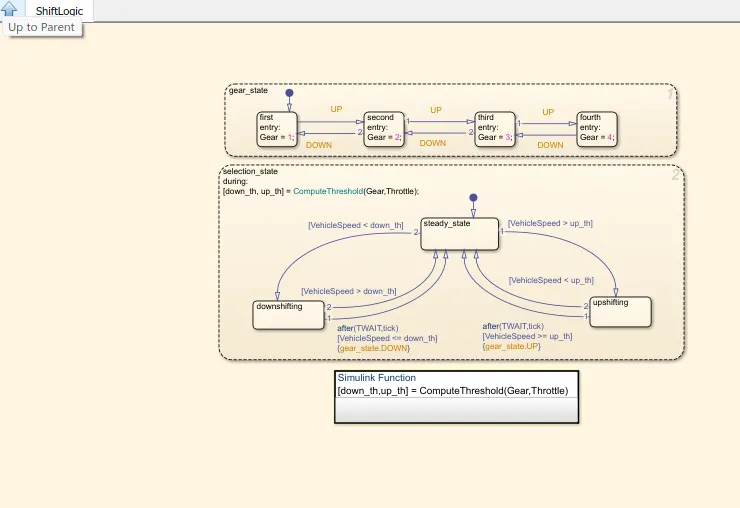
a)chart
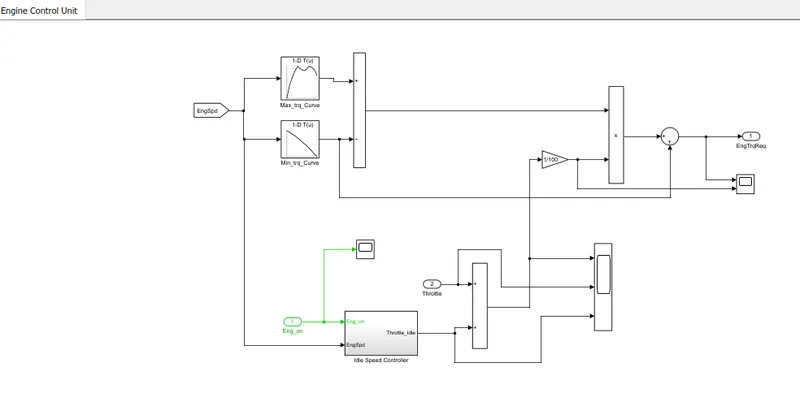
b)engine control unit
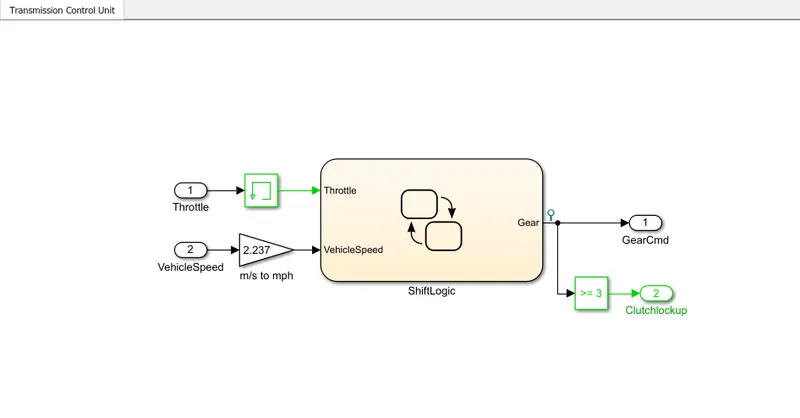
c)tranmission control unit
d)
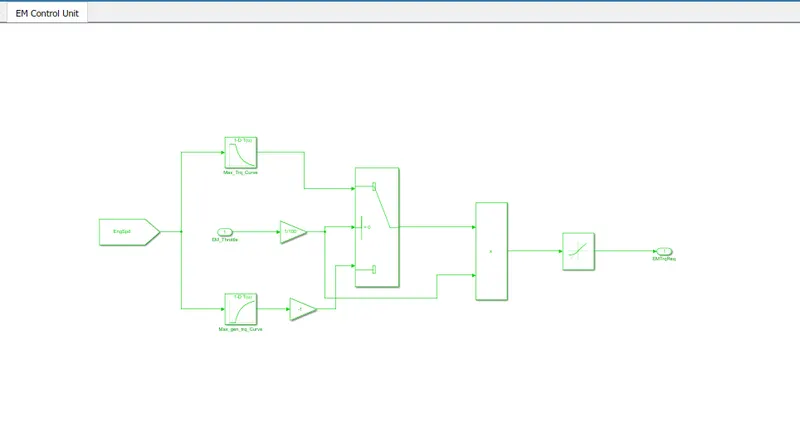
e)EM control unit
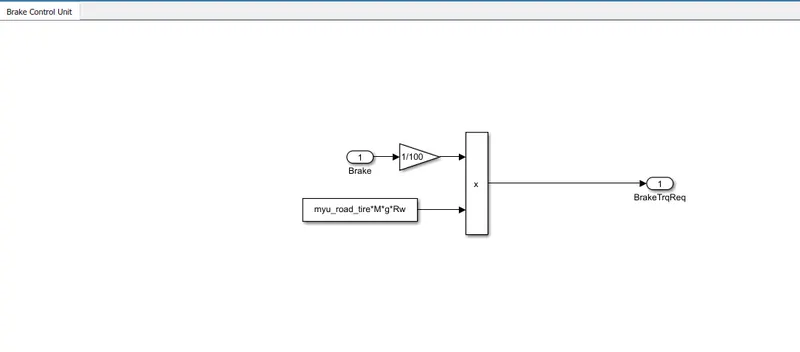
f)break control unit
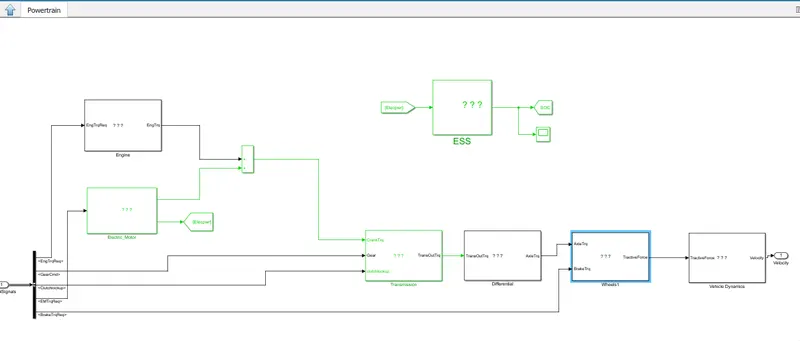
3)powertrain
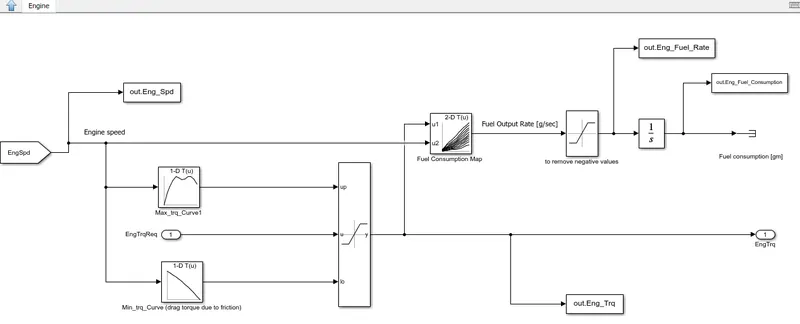
a)engine
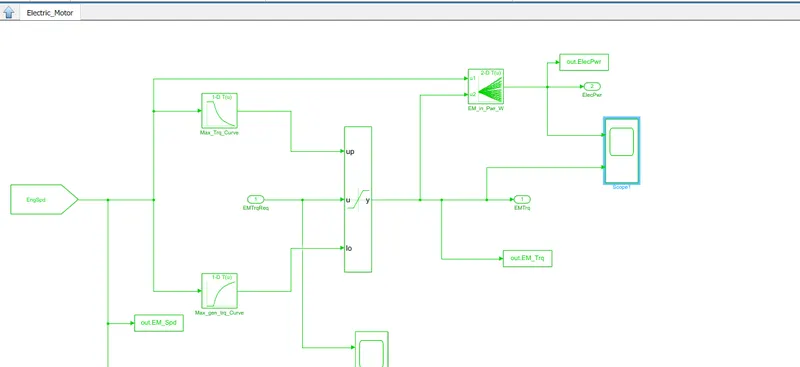
b)electric motor
c)
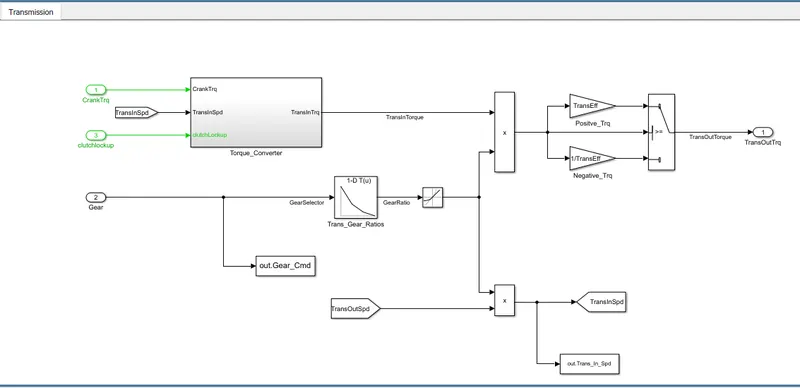
tranmission
d)
d)
e)
f)
g)
h)
i)
j)
%% parameters
Time = out.tout;
Acc_Pdl = out.Acc_Pdl; % acceleration pedal
Brk_Pdl = out.Brk_Pdl; %brake pedal
Gear_Cmd = out.Gear_Cmd; %gear
Trans_In_Spd = out.Trans_In_Spd*30/pi; %transmission input speed
Trans_Out_Spd = out.Trans_Out_Spd*30/pi; %transmission output speed
Eng_Trq = out.Eng_Trq; %engine brake torque
Eng_Spd = out.Eng_Spd*30/pi; %Engine speed
Eng_Fuel_Consumption = out.Eng_Fuel_Consumption; %Eng_Fuel_Consumption
Veh_Dist = out.Veh_Dist; %DIstance Travelled by Vehicle in KM
Veh_Spd = out.Veh_Spd*18/5; %%Vehicle Speed in KMph
Eng_Pwr = Eng_Spd*pi/30.*Eng_Trq/1000; %ENGINE BRAKE POWER
rho_petrol = 0.7197; %density of petrol
fuel_economy = Veh_Dist(end)/(Eng_Fuel_Consumption(end)/1000/rho_petrol);
%% RESULTS
figure('Name','vehicle characteristics')
subplot(3,1,1)
hold on
grid on
title('ACCELERATION vs BRAKE')
plot(Time,Acc_Pdl);
plot(Time,Brk_Pdl);
ylabel('PEDAL[%]')
xlabel('TIME')
legend('ACCELERATION','BRAKE');
subplot(3,1,2)
hold on
grid on
plot(Time,Trans_In_Spd);
plot(Time,Trans_Out_Spd);
ylabel('SPEED')
xlabel('TIME')
legend('TRANSMISSION INPUT SPEED' , 'TRANSMISSION OUTPUT SPEED');
title('TRANSMISSION')
subplot(3,1,3)
hold on
grid on
plot(Time,Gear_Cmd);
ylabel('GEAR')
xlabel('TIME')
legend('GEAR')
title('GEAR ')
%% FUEL OPERATING POINTS
figure('Name','ENGINE OPERATING MODES');
hold on
grid on
title('Engine Oerating Points')
p1 = plot( Eng_map_spd*30/pi, Eng_max_trq);
p2 = line( [Eng_map_spd(end)*30/pi Eng_map_spd(end)*30/pi] , [0 Eng_max_trq(end)] );
p3 = line( [ Eng_map_spd(1)*30/pi Eng_map_spd(end)*30/pi ] , [ 0 Eng_max_trq(1)] );
[c,h] = contour( Eng_map_spd'*30/pi , Eng_map_trq , Eng_fuel_map');
clabel(c,h);
xlabel('ENGINE SPEED');
ylabel('ENGINE TORQUE');
title('ENGINE FUEL CONSUMPTION MAP');
p4 = plot( Eng_Spd , Eng_Trq);
legend([p1,p4],{'MAX CURVE' , 'OPERATING POINTS'});
axis([Eng_map_spd(1)*30/pi Eng_map_spd(end)*30/pi 0 Eng_map_trq(end)]);