Project 2
a. Tabulate the fuel economy numbers (kmpl) for UDDS and HWFET cycle. Compare these numbers with the baseline numbers for conventional vehicle model from Project 1.
A)
Result:
The model had been run for the different cycles and different parameters were analyzed and compared with the conventional vehicle model.
Comparision for Different Drive Cycle:
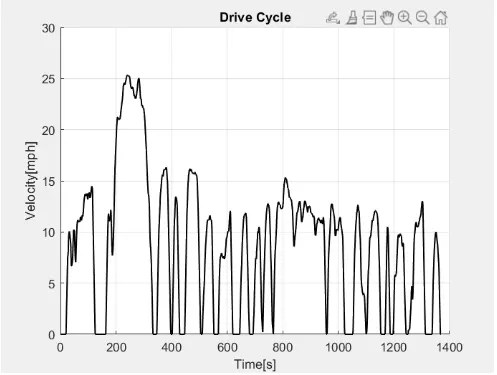
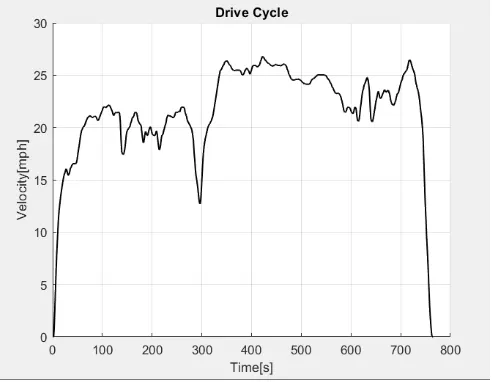
Two drive cycles UDDS and HWFET were considered and different system level parameters were analyzed.
UDDS:
HWFET:
b. Plot the time trace for engine, transmission input, transmission output and wheel speed on one plot.
A) 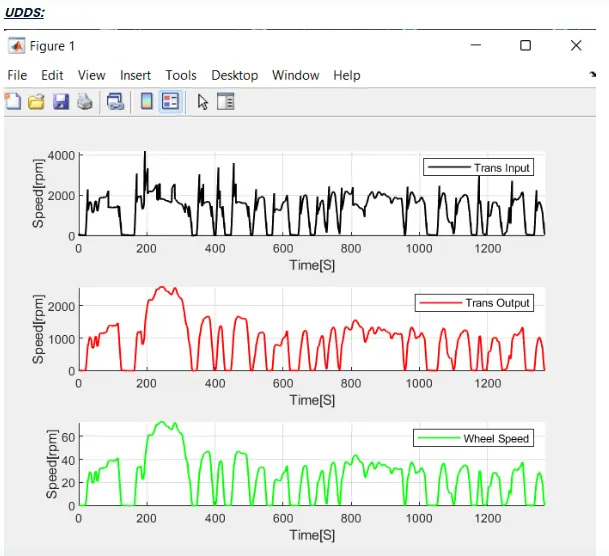
c. Plot engine torque, engine power, fuel rate and fuel consumption using subplots.
A) 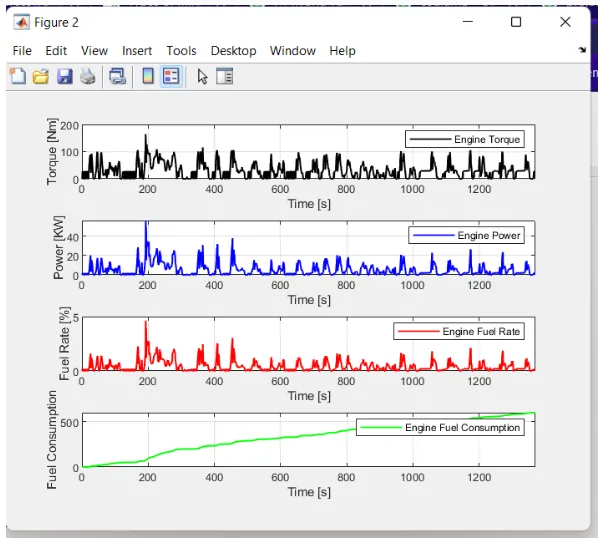
d. Plot accelerator and brake pedal, gear command, vehicle desired and actual speed, vehicle distance using subplots.
A) 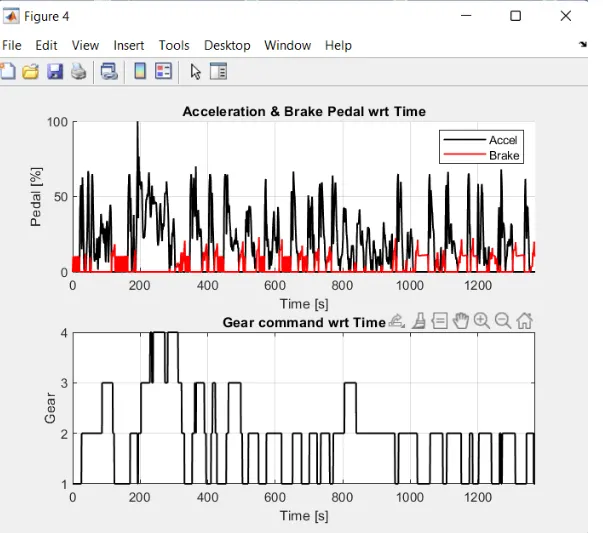
f. Plot motor speed, torque, motor input power using subplots.
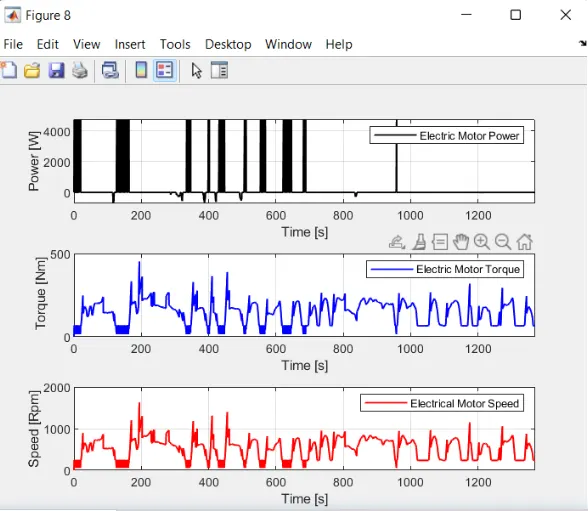
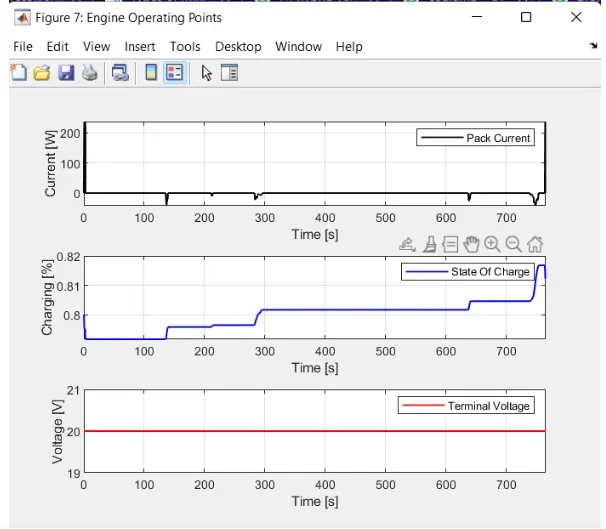
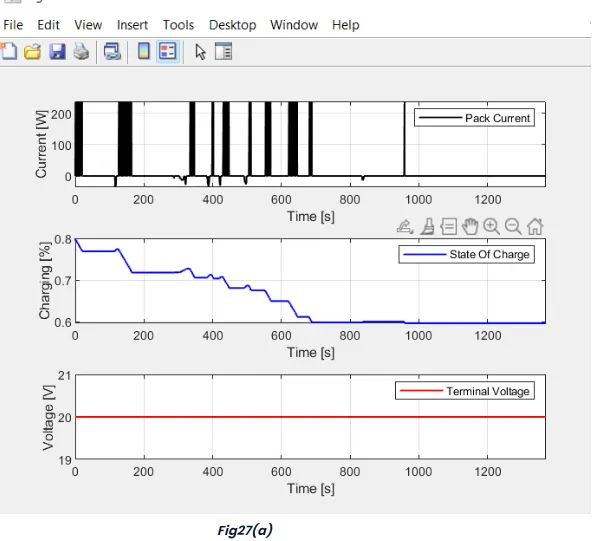
g. Plot pack voltage, current and SoC using subplots.
HWFET:
b. Plot the time trace for engine, transmission input, transmission output and wheel speed on one plot.
A) 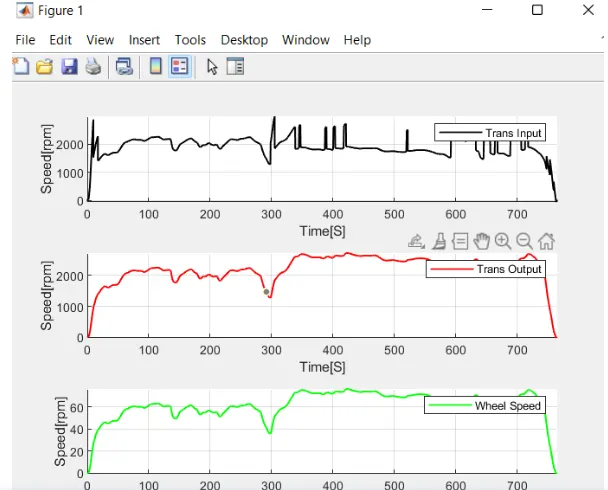
C) c. Plot engine torque, engine power, fuel rate and fuel consumption using subplots.
A) 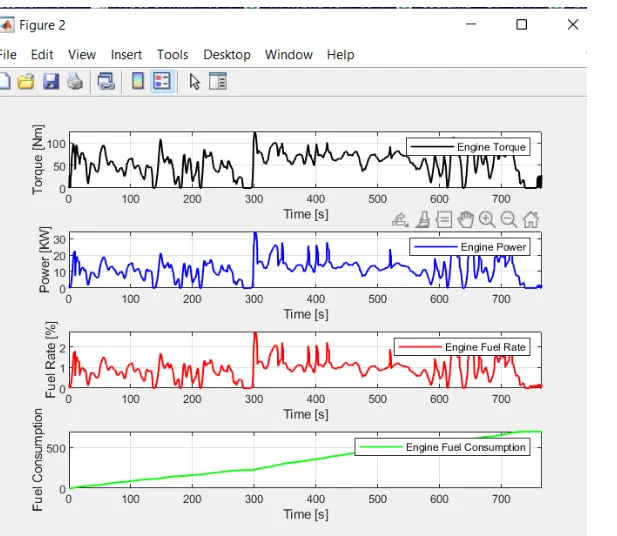
D) d. Plot accelerator and brake pedal, gear command, vehicle desired and actual speed, vehicle distance using subplots.
A) 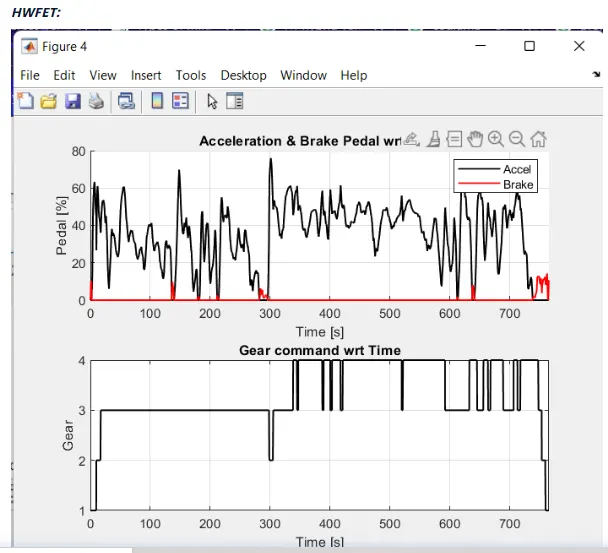
g. Plot pack voltage, current and SoC using subplots.
A)