Project
simulation of all terrain vehicle :
here in this were gonna see components about BAJA ATV ,
vehicle modeling : in vehicle modelling were gonna that defining geare ration and effect of parameter variation
and weere gonna learn about( cvt) continuous variabnle transmission in to the model and key take aways
components of BAJA ATV
1Vehicle body
2)suspension
3)tire
4)engine
5)CVT
vehicle body is nothing
lest see the ssimulink diagram of BAHA ATV
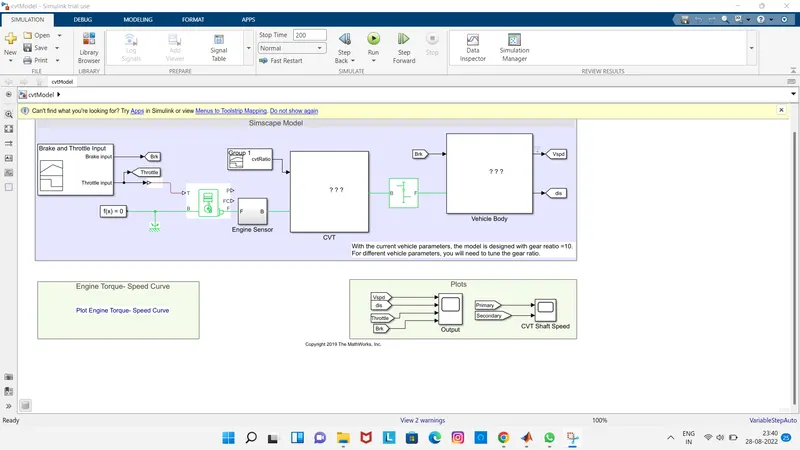
we can observe in the above model we have a differnt blocks like cvt ,vehicle body ,engine , gear ratio ans simple gear and signal builder
here in the we used a generic engine it represents a general internal combustion engine this block suitbale for generic engine for spark ignition and diesel speed vector and torque vecctor parameters provided in that
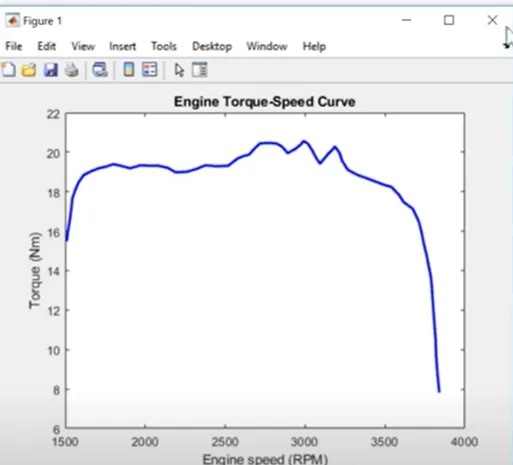
this is the speed toreque charecteruistics of a geniric engine given as a input these values the torque is 16n-m and the maximum speed in rpm is nearly 3840 we can observe in the pabove it ends at the point 3840 it is the maximum speed point of a engine by using a grabit file exchange we can feed a differnt input values to a generic engine and we can see the different torque speed charecteristics by giving thjat values
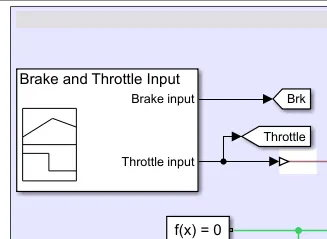
here in the above we used a signal builder block and givbing some break and throttle inputs and lets see in the graph how would be the inputs look like
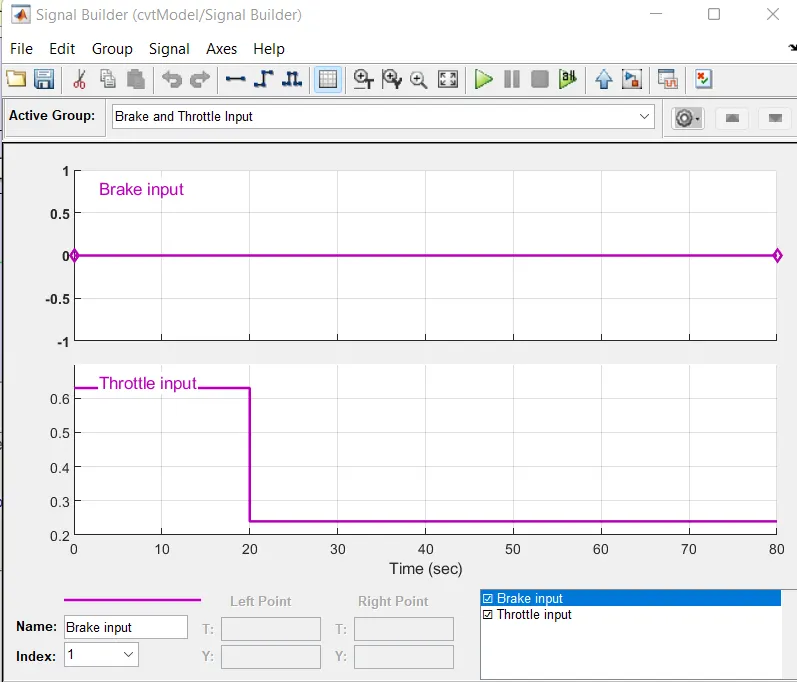
here in the above we give the throttle input 0.65 for 20seconds and after 20sec we gave 0.1 and we run the simulation for these inputs lets see the output results of velocity in scope
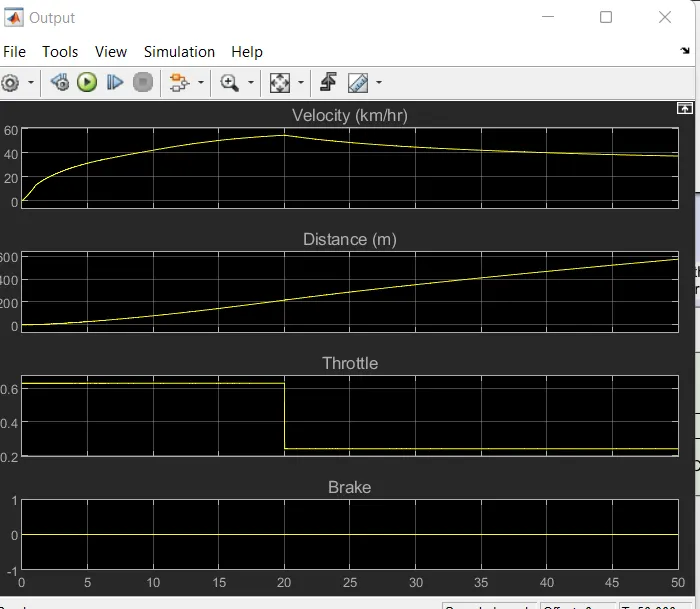
here we can observe the break input as 0 and the throttle input is 0.65 for 20 seconds after 20 seconds it would be like 0.1and the corrosponding velocity results we can observe it increasing rapidly for 20seconds and after that decrease a little bit and tried rto maintain constant
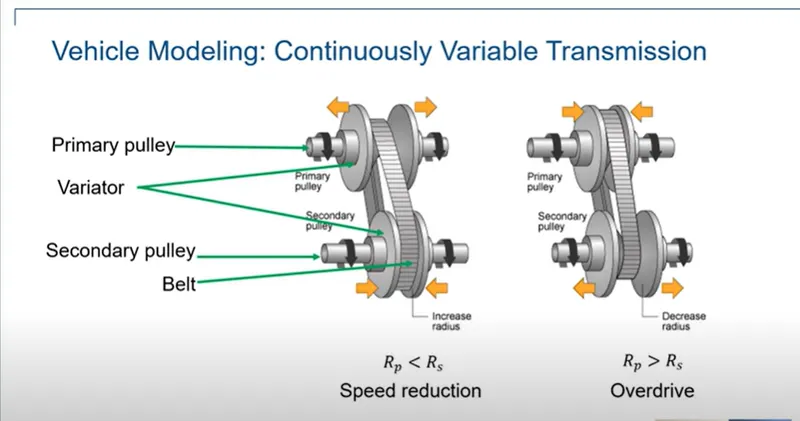
here in the above diagram we can the cvt modelling it has primary pulley and secondary pulley and the belt and finally the variator
pulleyes are connected to motor shaft and roataed when the motor rotates one pulley connected to motor shaft and other pulley rotates with the help of a belt and variators connected to both pulley ..variator of primary pulley when goes outward the variator of secondary pulley come inwards this causes the radius of secondary pulley is greater than the primnary pulley it causes the speed reduction becuause if primary pulley rotates 10 rounds it is equal to rotation of secondary pulley 1 round means if the radius is more it takes much time to complete the rtotation and if the radius is less it takes less time to cokmplete the rotation it causes the speed reduction means rpm would be less
like wise in secondary diagram the variator comes inside at the primary pulley and the secondary pulley side variator goes outside primary pulley radius is more and the sedcondary pulley radius is less means primary pulley takes more time to complete the one rotation and the secondary pulley takes less time to comlete the rotation it causes speed will be more causes higher speeds
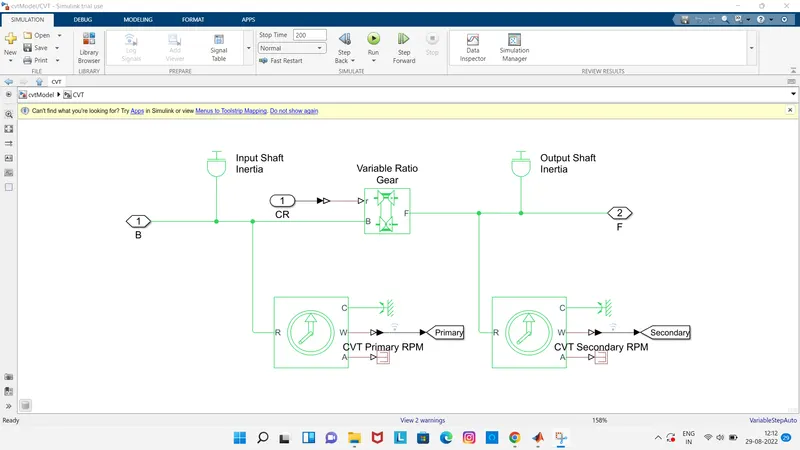
this is the blocks which are connected inside the cvt here in above we can see the input shaft inertia and output shaft inertia is nothing but primary pulley and secondary pulley and the bottom side we can see the cvt primary rpm it is nothing but rpm of a primary pulley and the cvt secondary rpm is nothing but rpm of a secondary pulley and the above gear rarion is connected in between input shaft inertia and output shaft inertia gear ratio we use to reduce the speed based on what gear ratio we giving speed and velocity depends
and above model is open loop system we given the values randomly and obnserved the assumed results
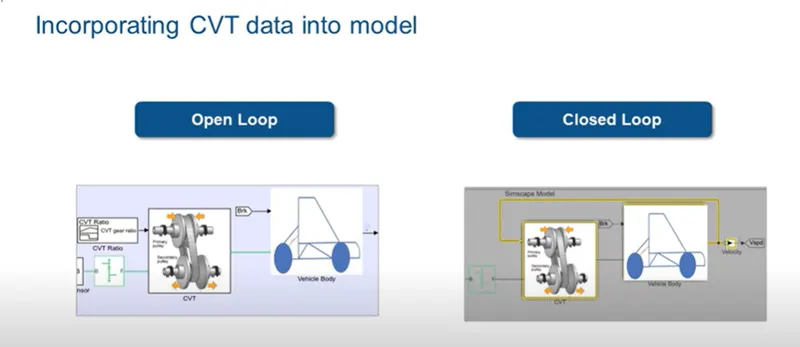
here in the above we can observe that open loop and closed loop difference here in open loop they used a cvt ratio as a input to the cvt block and in the closed loop system they used a vehicle body velocity output taken the input to cvt block
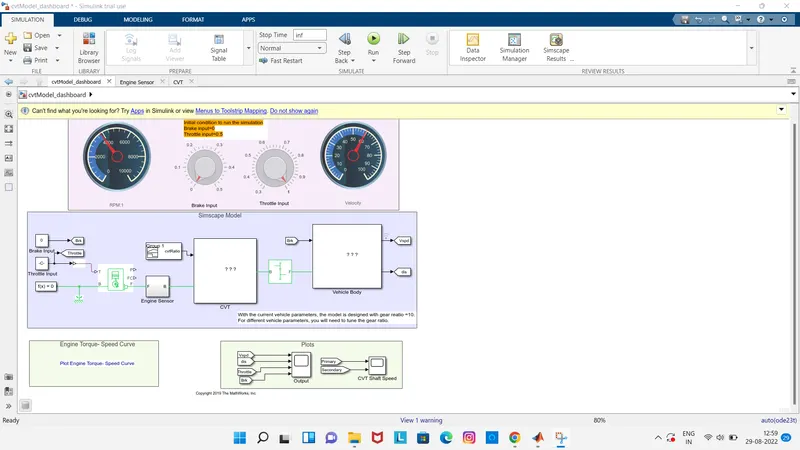
here we can see in the above model as compared to the first model here they removed the signal buiilder block in the input side and connected some extra rpm and velocity ranges and provided some throtlle by changing the throttle we can change the velocity range and we can see that in scope
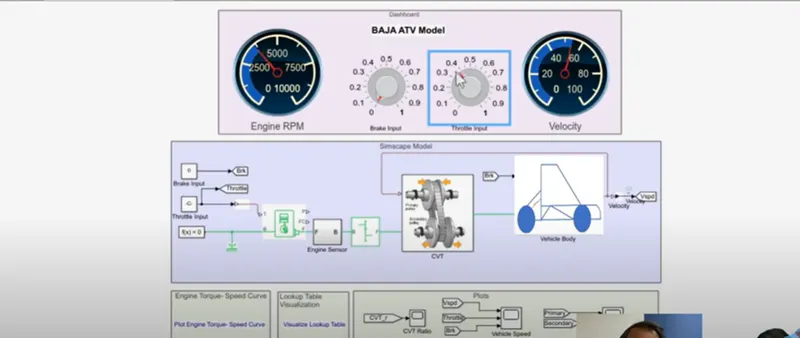
here in the above if we run the simulation and while simulation ios running we change throttle to a different values and and stop the simulation and check after how it would be the velocity results
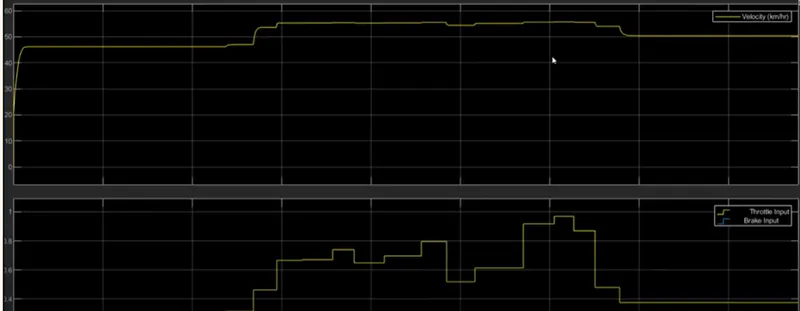
Here we can observe in the above the brake input is 0 and the throttle input is varying and the accroding the throttlee input we can see the velocity output it increasing and decreasing based on the throttle input were giving
here we can conclude that closed loop system gives the better results as compared to open loop system, because in open loop system we doesnt have any feed back and in closed loop system were having a feed back and system automatically changes the output as per our requirement