Project-1: Powertrain for aircraft in runways
Q1. Search and list out the total weight of various types of aircraft.
ANS:
AIRCRAFT:
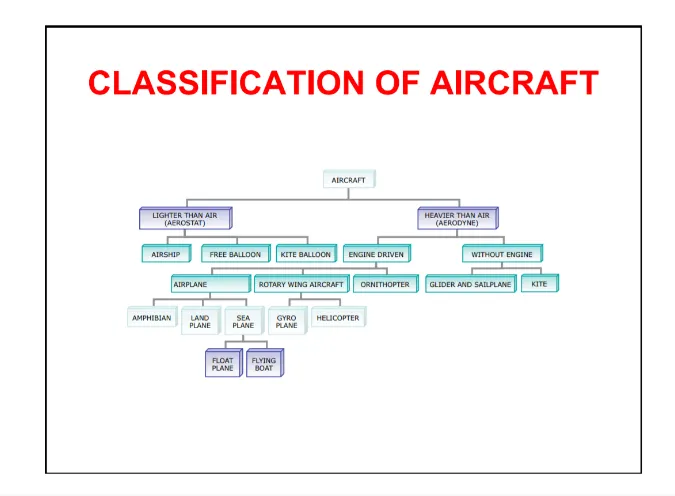
An aircraft is a vehicle that is able to fly by gaining support from the air. It counters the force of gravity by using either static lift or by using the dynamic lift of an airfoil, or in a few cases the downward thrust from jet engines. Common examples of aircraft include airplanes, helicopters, airships (including blimps), gliders, paramotors, and hot air balloons.
The aircraft gross weight (also known as the all-up weight and abbreviated AUW) is the total aircraft weight at any moment during the flight or ground operation.
An aircraft's gross weight will decrease during a flight due to fuel and oil consumption. An aircraft's gross weight may also vary during a flight due to payload dropping or in -flight refuelling.
At the moment of releasing its brakes, the gross weight of an aircraft is equal to its takeoff weight. During the flight, an aircraft's gross weight is referred to as the en-route weight or in-flight weight.
Design weight limits:
An aircraft's gross weight is limited by several weight restrictions in order to avoid overloading its structure or to avoid unacceptable performance or handling qualities while in operation.
Aircraft gross weight limits are established during an aircraft's design and certification period and are laid down in the aircraft's type certificate and manufacturer specification documents.
The absolute maximum weight capabilities of a given aircraft are referred to as the structural weight limits. The structural weight limits are based on aircraft maximum structural capability and define the envelope for the CG charts (both maximum weight and CG limits).
An aircraft's structural weight capability is typically a function of when the aircraft was manufactured, and in some cases, old aircraft can have their structural weight capability increased by structural modifications.
Authorised weight limits:
Aircraft authorised gross weight limits (also referred to as certified weight limits) are laid down in the AFM and/or associated certificate of airworthiness (C of A). The authorised or permitted limits may be equal to or lower than the structural design weight limits.
The authorised weight limits that can legally be used by an operator or airline are those listed in the AFM and the weight and balance manual.
The authorised (or certified) weight limits are chosen by the customer/airline and they are referred to as the "purchased weights". An operator may purchase a certified weight below the maximum design weights because many of the airport operating fees are based on the aircraft AFM maximum allowable weight values. An aircraft purchase price is, typically, a function of the certified weight purchased.
Maximum weights established, for each aircraft, by design and certification must not be exceeded during aircraft operation (ramp or taxying, takeoff, en-route flight, approach, and landing) and during aircraft loading (zero fuel conditions, the centre of gravity position, and weight distribution).
Weights could be restricted on some type of aircraft depending on the aircraft handling requirements; for example, aerobatic aircraft, where certain aerobatic manoeuvres can only be executed with a limited gross weight.
In addition, the authorised maximum weight limits may be less as limited by the centre of gravity, fuel density, and fuel loading limits.
Maximum taxi weight (MTW)
The maximum taxi weight (MTW) (also known as the (MRW) is the maximum weight authorized for manoeuvring (taxiing or towing) an aircraft on the ground as limited by aircraft strength and airworthiness requirements. It includes the weight of taxi and run-up fuel for the engines and the APU.
It is greater than the maximum takeoff weight due to the fuel that will be burned during the taxi and runup operations.
The difference between the maximum taxi/ramp weight and the maximum take-off weight (maximum taxi fuel allowance) depends on the size of the aircraft, the number of engines, APU operation, and engines/APU fuel consumption, and is typically assumed for 10 to 15 minutes allowance of taxi and run-up operations.
Maximum takeoff weight (MTOW)
The maximum takeoff weight (also known as the maximum brake-release weight) is the maximum weight authorised at brake release for takeoff, or at the start of the takeoff roll.
The maximum takeoff weight is always less than the maximum taxi/ramp weight to allow for fuel burned during taxi by the engines and the APU.
In operation, the maximum weight for takeoff may be limited to values less than the maximum takeoff weight due to aircraft performance, environmental conditions, airfield characteristics (takeoff field length, altitude), maximum tire speed and brake energy, obstacle clearances, and/or en route and landing weight requirements.
Maximum landing weight (MLW)
The maximum weight authorised for the normal landing of an aircraft.
The MLW must not exceed the MTOW.
The operation landing weight may be limited to a weight lower than the Maximum Landing Weight by the most restrictive of the following requirements:
- Aircraft performance requirements for a given altitude and temperature:
-
- landing field length requirements,
- approach and landing climb requirements
- Noise requirements
If the flight has been of short duration, fuel may have to be jettisoned to reduce the landing weight.
Overweight landings require a structural inspection or evaluation of the touch-down loads before the next aircraft operation.
Maximum zero-fuel weight (MZFW)
The maximum permissible weight of the aircraft less all usable fuel and other specified usable agents (engine injection fluid, and other consumable propulsion agents). It is the maximum weight permitted before usable fuel and other specified usable fluids are loaded in specified sections of the aeroplane.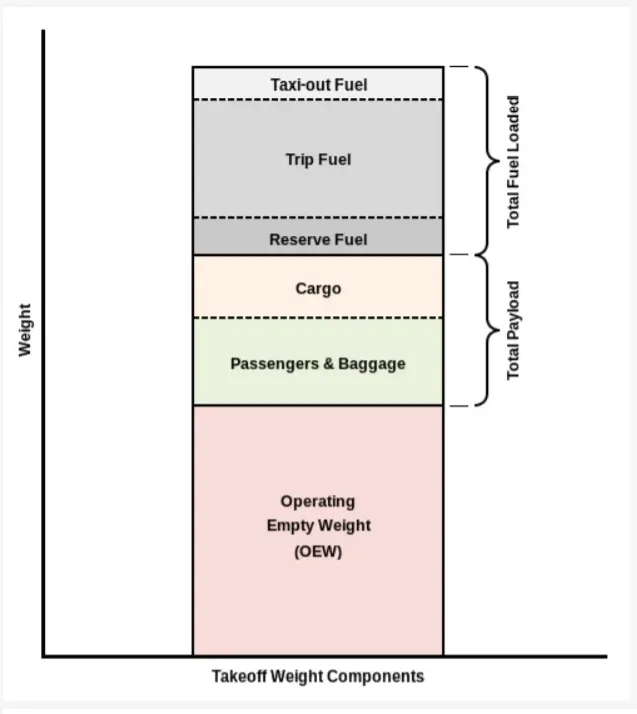
Airplanes:
MTOW = Maximum take-off weight, MLW = Maximum landing weight, TOR = Take-off run (SL, IAS+15°, MTOW), LR = Landing run (SL, ISA+15°, MLW)
| Type | MTOW [kg] | MLW [tonnes] | TOR [m] | LR [m] |
|---|---|---|---|---|
| Scaled Composites Model 351 Stratolaunch | 589,670 | 3660 | ||
| Antonov An-225 | 640,000 | 591.7 | 3500 | |
| Concorde | 185,000 | 111.1 | 3440 | 2220 |
| Boeing 767-400ER | 204,000 | 158.758 | 3414 | |
| Boeing 777-300 | 299,370 | 237.683 | 3380 | |
| Boeing 777-200ER | 297,550 | 213.00 | 3380 | 1550 |
| Boeing 747-200[7] | 377,840 | 285.700 | 3338 | 2109 |
| Boeing 787-8[10] | 228,000 | 172.365 | 3300 | 1695 |
| Boeing 747-300[7] | 377,840 | 260.320 | 3222 | 1905 |
| Ilyushin Il-96M | 270,000 | 195.04 | 3115 | 2118 |
| Airbus A380-800[1][2][3] | 575,000 | 394 | 3100 | 1930 |
| Boeing 747-8F | 447,700 | 346.091 | 3100 | 1800 |
| Boeing 747-8 | 443,613 | 306.175 | 3100 | |
| Airbus A340-600[8] | 367,400 | 256 | 3100 | 2100 |
| Boeing 777-300ER | 351,800 | 251.29 | 3100 | |
| Boeing 747-400ER | 412,770 | 295.742 | 3090 | |
| Airbus A340-500[8] | 371,950 | 240 | 3050 | 2010 |
| Boeing 747-400 | 396,900 | 295.742 | 3018 | 2179 |
| Boeing 777-200LR | 347,450 | 223.168 | 3000 | |
| Airbus A340-300[8][9] | 276,700 | 190 | 3000 | 1926 |
| McDonnell Douglas MD-11 | 273,300 | 185 | 2990 | 1890 |
| McDonnell Douglas DC-10 | 256,280 | 183 | 2990 | 1890 |
| Airbus A340-200[8][11] | 253,500 | 181 | 2990 | |
| Boeing 787-9[10] | 254,000 | 192.777 | 2900 | |
| Boeing 777F | 347,800 | 260.816 | 2830 | |
| Boeing 737-900ER | 85,000 | 71.35 | 2804 | 1829 |
| Boeing 767-300ER | 187,000 | 136.08 | 2713 | 1676 |
| Boeing 767-300 | 159,000 | 136.078 | 2713 | 1676 |
| Airbus A350-900 | 270,000 | 175 | 2670 | 1860 |
| Lockheed L-1011-500 | 231,300 | 166.92 | 2636 | |
| Ilyushin IL-96-300 | 250,000 | 175 | 2600 | 1980 |
| Boeing 757-300 | 124,000 | 101.6 | 2550 | 1750 |
| Boeing 737-400 | 68,000 | 54.9 | 2540 | 1540 |
| Lockheed C-5 Galaxy[4][5][6] | 381,000 | 288.417 | 2530 | 1494 |
| Antonov An-124-100M | 405,060 | 330 | 2520 | 900 |
| Airbus A330-300[12][13] | 242,000 | 185 | 2500 | 1750 |
| Boeing 737-900 | 85,000 | 66.36 | 2500 | 1704 |
| Airbus A300-600R[14] | 192,000 | 140 | 2385 | 1555 |
| Boeing 757-200 | 116,000 | 89.9 | 2347 | 1555 |
| Airbus A300-600[14] | 163,000 | 138 | 2324 | 1536 |
| Boeing 737-800 | 79,000 | 65.32 | 2308 | 1634 |
| Airbus A310-300[14] | 157,000 | 124 | 2290 | 1490 |
| Embraer ERJ 145 | 22,000 | 19.3 | 2270 | 1380 |
| Tupolev Tu-204SM | 104,000 | 87.5 | 2250 | |
| Embraer 175[20] | 37,500 | 32.8 | 2244 | 1304 |
| Airbus A330-200[12][13] | 242,000 | 180 | 2220 | 1750 |
| Airbus A321-100[18] | 83,000 | 77.8 | 2200 | 1540 |
| McDonnell-Douglas MD-90-30 | 71,000 | 64.41 | 2165 | 1520 |
| Embraer 190[19] | 48,000 | 43 | 2056 | 1323 |
| Airbus A320-100[18] | 68,000 | 66 | 1955 | 1490 |
| Boeing 717-200HGW | 55,000 | 47.174 | 1950 | |
| Boeing 717-200BGW | 50,000 | 46.265 | 1950 | |
| Boeing 737-300 | 63,000 | 51.7 | 1939 | 1396 |
| Boeing 737-700 | 70,000 | 58.06 | 1921 | 1415 |
| Bombardier CRJ200 | 23,000 | 21.319 | 1918 | 1479 |
| Airbus A220-300 | 65,000 | 57.61 | 1890 | 1494 |
| Airbus A310-200[14] | 142,000 | 123 | 1860 | 1480 |
| Airbus A319[18] | 64,000 | 62.5 | 1850 | 1470 |
| Boeing 737-500 | 60,000 | 49.9 | 1832 | 1360 |
| Boeing 737-600 | 66,000 | 54.66 | 1796 | 1340 |
| Bombardier CRJ900[21] | 36,500 | 33.345 | 1778 | 1596 |
| Embraer 170[22] | 36,000 | 32.8 | 1644 | 1274 |
| Fokker 100 | 46,000 | 39.95 | 1621 | 1350 |
| Bombardier CRJ700 | 33,000 | 30.39 | 1564 | 1478 |
| Embraer 120 Brasilia | 11,500 | 11.25 | 1560 | 1380 |
| BAe Jetstream 41 | 10,890 | 10.570 | 1493 | 826 |
| Airbus A220-100 | 59,000 | 50.80 | 1463 | 1356 |
| Airbus A318[18] | 59,000 | 57.5 | 1375 | 1340 |
| Learjet 75[23] | 9,752 | 8.709 | 1353 | 811 |
| ATR 72-600 | 22,800 | 22.35 | 1333 | 914 |
| Saab 2000 | 22,800 | 21.5 | 1300 | |
| Saab 340 | 13,150 | 12.930 | 1300 | 1030 |
| Bombardier Q400 | 28,000 | 28.01 | 1219 | 1295 |
| ATR 42-500 | 18,600 | 18.3 | 1165 | 1126 |
| Cessna Citation CJ4[26] | 7,761 | 7.103 | 1039 | 896 |
| Beechcraft 1900D | 7,765 | 7.605 | 1036 | 853 |
| Airbus A400M | 141,000 | 122 | 980 | 770 |
| Embraer Phenom 100 | 4,800 | 4.43 | 975 | 741 |
| Embraer Phenom 300[25] | 8,150 | 7.65 | 956 | 677 |
| Pilatus PC-24[24] | 8,300 | 7.665 | 893 | 724 |
| Boeing 747-100[7] | 340,200 | 265.300 | ||
| Airbus A350-1000 | 308,000 | 233.5 | ||
| Boeing 787-10[10] | 254,000 | 201.849 | ||
| Lockheed L-1011-200 | 211,400 | |||
| Ilyushin IL-86 | 208,000 | 175 | ||
| Vickers VC10 | 152,000 | 151.9 | ||
| Boeing 707-320B[15] | 151,000 | 97.5 | ||
| Boeing 707-320C[15] | 151,000 | 112.1 | ||
| Douglas DC-8-61 | 147,000 | |||
| Douglas DC-8-32 | 140,000 | |||
| Douglas DC-8-51 | 125,000 | |||
| Boeing 707-120B[15] | 117,000 | 86.3 | ||
| Boeing 720B[16] | 106,000 | 79.5 | ||
| Boeing 720[16] | 104,000 | 79.5 | ||
| Tupolev Tu-154M | 104,000 | 80 | ||
| Convair 880 | 87,500 | |||
| Boeing 727-200 Advanced[17] | 84,000 | 70.1 | ||
| Boeing 727-200[17] | 78,000 | 68.1 | ||
| McDonnell-Douglas MD-83 | 73,000 | 63.28 | ||
| Boeing 727-100[17] | 72,500 | 62.4 | ||
| Boeing 727-100C[17] | 72,500 | 62.4 | ||
| de Havilland Comet 4 | 70,700 | |||
| de Havilland Comet 3 | 68,000 | |||
| Boeing 377 | 67,000 | |||
| Hawker Siddeley Trident 2E | 65,000 | |||
| Douglas DC-7 | 55,000 | |||
| de Havilland Comet 2 | 54,000 | |||
| de Havilland Comet 1 | 50,000 | |||
| Douglas DC-6A | 48,600 | |||
| Douglas DC-6B | 48,500 | |||
| Caravelle III | 46,000 | |||
| Douglas DC-6 | 44,000 | |||
| Avro RJ-85 | 42,000 | 36.74 | ||
| Handley Page Hermes | 39,000 | |||
| Douglas DC-4 | 33,000 | |||
| Vickers Viscount 800 | 30,400 | |||
| de Havilland Hercules | 7,000 |
Helicopters:
MTOW = Maximum take-off weight
| Type | MTOW [pounds] | MTOW [kg] | Power output [kW] | Power to weight [W/kg] | Rotor diameter [m] |
|---|---|---|---|---|---|
| Mil Mi-12[27] | 231485 | 105000 | 19200 | 182 | 2 x 35 |
| Mil Mi-26[28] | 123459 | 56000 | 17000 | 343 | 1 x 32 |
| Sikorsky CH-53E[29] | 73500 | 33300 | 9810 | 294 | 1 x 24 |
| Boeing CH-47D/F Chinook[30] | 50000 | 22680 | 7058 | 311 | 2 x 18.3 |
| AgustaWestland AW101[31] | 34,392 | 14600 | 4698 | 321 | 1 x 18.59 |
| Sikorsky S-92[32] | 26500 | 12020 | 3758 | 312 | 1 x 17.17 |
| Eurocopter EC225 Super Puma | 24692 | 11200 | 3552 | 317 | 1 x 16.2 |
| Boeing Vertol CH-46 Sea Knight[33] | 24300 | 11000 | 2800 | 254 | 2 x 15.24 |
| NHIndustries NH90 | 23370 | 10600 | 3324 | 314 | 1 x 16.3 |
| Eurocopter AS532 Cougar | 19840 | 9000 | 2370 | 263 | 1 x 15.6 |
| Bell 412EP | 11900 | 5397 | 1864 | 345 | 1 x 14.0 |
| Eurocopter EC145 C-2 | 7903 | 3585 | 1100 | 307 | 1 x 11.0 |
| Eurocopter EC135 P2+/T2+ | 6415 | 2910 | 944 | 325 | 1 x 10.2 |
| Eurocopter EC635 P2 | 6393 | 2900 | 1218 | 420 | 1 x 10.2 |
| AeroVelo Atlas (human powered) | 282 | 128 | 1.1 | 8.5 | 4 x 20.2 |
Q2. Is there any difference between ground speed and air speed?
ANS:
The 4 types of airspeed:
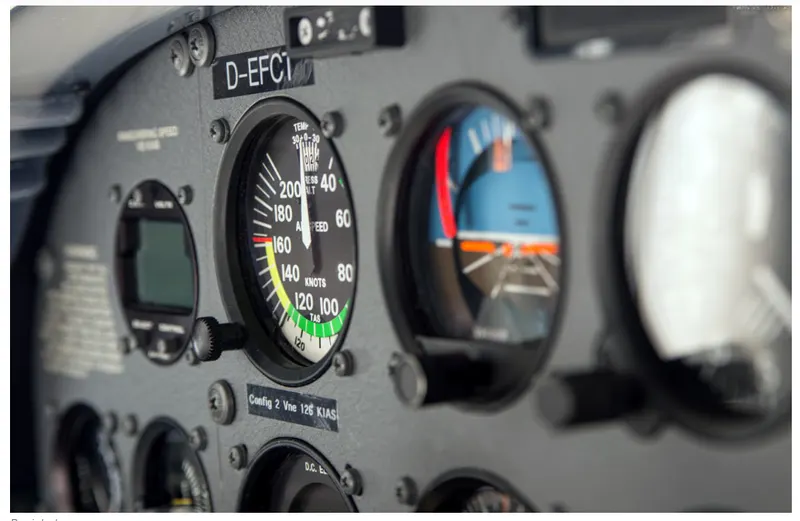
Indicated Airspeed (IAS)
This one's pretty simple. It's read right off your airspeed indicator and is usually what you'll reference in the cockpit for speed changes. The speed limits of the sky, like not exceeding 250 knots below 10,000 feet MSL, are all written as indicated airspeed values.
True Airspeed (TAS):
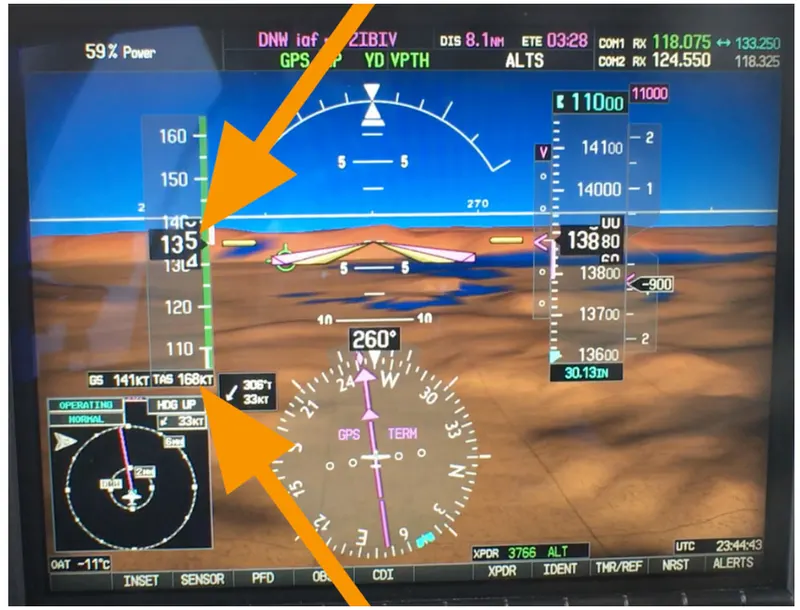
True airspeed is the speed of your aircraft relative to the air it's flying through. As you climb, true airspeed is higher than your indicated airspeed. Pressure decreases with higher altitudes, so for any given true airspeed, as you climb, fewer and fewer air molecules will enter the pitot tube. Because of that, indicated airspeed will be less than true airspeed. In fact, for every thousand feet above sea level, true airspeed is about 2% higher than indicated airspeed. So at 10,000 feet, true airspeed is roughly 20% faster than what you read off your airspeed indicator. Many aircraft, such as those with gas turbine engines, can reach a higher TAS at higher altitudes because their engines are more efficient at higher altitudes.
Ground speed:
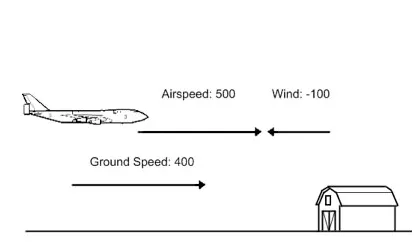
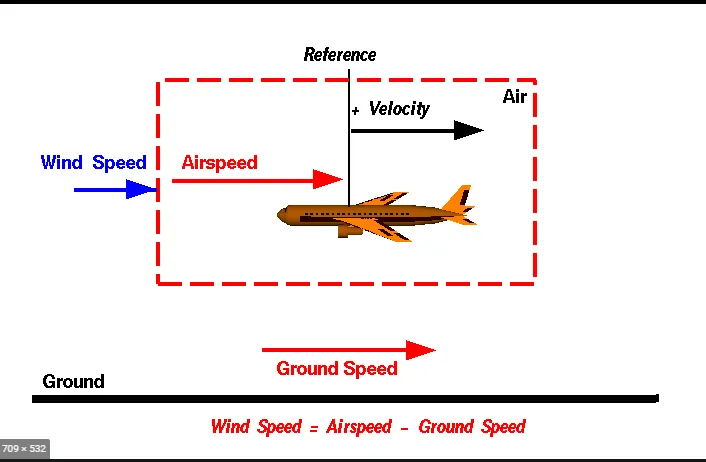
Ground speed is the actual speed that an aircraft travels over the ground, and is also referred to as “shadow speed.” Ground speed combines the aircraft’s air speed and the wind speed relative to the aircraft’s direction of flight. An aircraft’s air speed is determined not by how much distance it covers in a set time, but by a combination of its forward speed and the speed of the wind that is blowing towards the aircraft.
A wing must have air moving over it to create lift. Too little moving air and the airplane will ‘stall,’ or lose elevation very rapidly. The stall speed is when the wings no longer create lift, and the airplane falls from the sky. As an example, let’s say that an aircraft has a stall speed of 20 knots. That does not mean that the aircraft needs to propel itself at 20 knots, but rather that the air moving over the wing must be traveling at 20 knots or more so that the aircraft can stay aloft. Therefore, a gust of wind that is traveling at 20 knots towards the aircraft will allow the airplane to hover stationary over an area.
Ground speed and Air Speed are not always the same speed. On a windy day, an airplane may have an Air Speed of 80 knots but a Ground Speed of only 60 knots. The term “shadow speed” comes from the speed of the airplane’s shadow on the ground. If an aircraft has an Air Speed of 80 knots but a ground speed of 60 knots, a car that follows the shadow will only need to go 60 knots to keep the same speed as the airplane.
Most people have heard of head and tailwinds. Tailwinds will help push an aircraft faster, so that it reaches its destination more quickly, while a headwind pushes against the aircraft and slows it down. A headwind will detract from an aircraft’s Ground Speed, while a tailwind will increase it.
Calibrated Airspeed (CAS):
Calibrated airspeed is indicated airspeed corrected for instrument and positional errors. At certain airspeeds and with certain flap settings, the installation and instrument errors may total several knots. This error is generally greatest at low airspeeds, with nose-high pitch attitudes.
When flying at sea level under International Standard Atmosphere (ISA) conditions (15 degrees Celsius, 29.92 inches of mercury, 0% humidity), calibrated airspeed is the same as true airspeed. If there is no wind it is also the same as ground speed.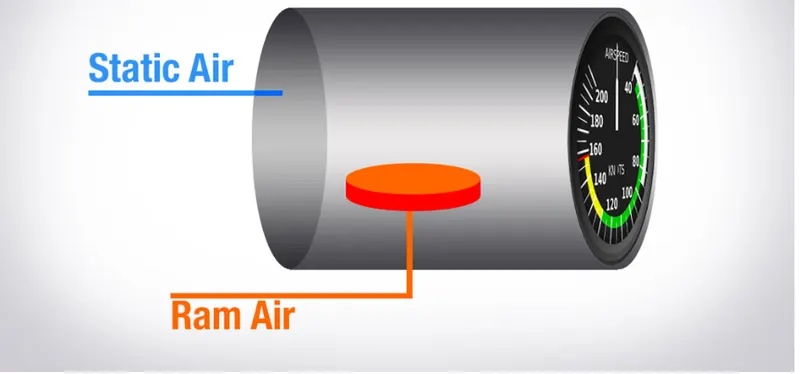
Airspeed vs. Ground Speed:
As mentioned above, true airspeed is simply the speed at which an aircraft is moving relative to the air it is flying in. As such, it’s also the speed at which the air is flowing around the aircraft’s wings.
Ground speed, on the other hand, is the aircraft’s speed relative to the ground. One thing that should be noted here is that it’s its horizontal rather than vertical speed – an aircraft climbing completely vertically would have a ground speed of zero.
In other words, while airspeed is what determines whether there is enough airflow around an aircraft to make it fly, ground speed is what determines how fast an aircraft will get to its destination.
Q3. Why is it not recommended to use aircraft engine power to move it on the ground at the Airport?
ANS:
We are assuming passenger commuter aircraft and large airliners. Aircraft move using their own engine power all the time on the airport apron and taxiways under their own power to go towards runways and after landing taxi to their assigned gate.
The only time they use external assistance is to pushback from the gate. Large turbofan aircraft need help to reverse via a pushback tractor. The engines are turned on after the pushback is complete and the aircraft can move forward under Its own power.
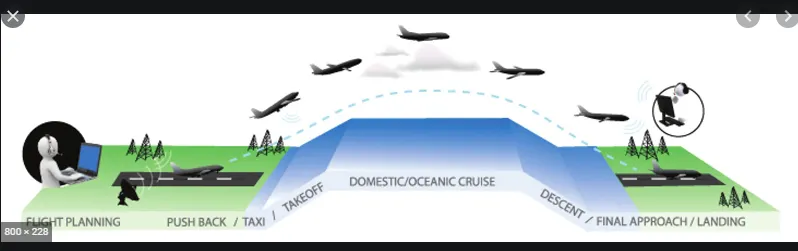
To be accurate, some aircraft can reverse using a variable pitch prop or thrust reversing on turbofans but generally reversing is done via pushback tractors. Blasting jet reversers blows debris In the crowded gate area creating foreign object damage hazards for adjacent aircraft, gate equipment, or terminal waiting area glass windows.
Q4. How an aircraft is pushed to the runway when it's ready to take off?
Phases of A flight:
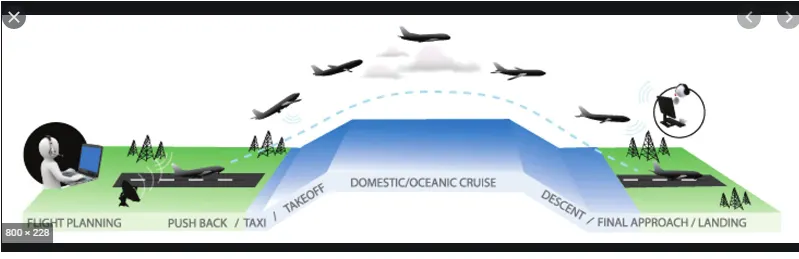
Taxiing refers to the movement of an aircraft on the ground, under its own power. The aircraft moves on wheels. An airplane uses taxiways to taxi from one place on an airport to another; for example, when moving from a terminal to the runway.
The aircrafts always moves on the ground following the yellow lines, to avoid any collision with the surrounding buildings, vehicles or other aircrafts. The taxiing motion has a speed limit. Before making a turn, the pilot reduces the speed further to prevent tire skids. Just like cars, there is a certain list of priorities during taxiing. The aircrafts that are landing or taking off have higher priority. The other aircrafts have to wait for these aircrafts before they start or continue taxiing.
The thrust to propel the aircraft forward comes from its propellers or jet engines. Steering is achieved by turning a nose wheel or tail wheel/rudder; the pilot controlling the direction travelled with their feet. The use of engine thrust near terminals is restricted due to the possibility of jet blast damage. This is why the aircrafts are pushed back from the buildings by a vehicle before they can start their own engines for taxiing.
Take-Off:
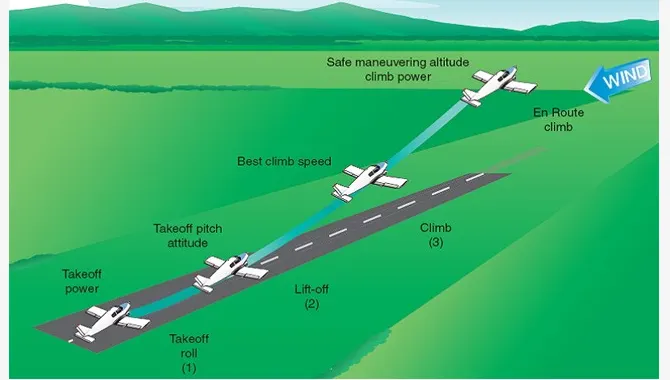
Takeoff is the phase of flight in which an aircraft goes through a transition from moving along the ground (taxiing) to flying in the air, usually starting on a runway. Usually the engines are run at full power during takeoff. Following the taxi motion, the aircraft stops at the starting line of the runway. Before takeoff, the engines, particularly piston engines, are routinely run up at high power to check for engine-related problems. This makes a consid- erable noise. When the pilot releases the brakes, the aircraft starts accelerating rapidly until the necessary speed for take-off is achieved.
The takeoff speed required varies with air den- sity, aircraft weight, and aircraft configuration (flap and/or slat position, as applicable). Air density is affected by factors such as field ele- vation and air temperature.
Operations with transport category aircraft employ the concept of the takeoff V-Speeds, V1 and V2. These speeds are determined not only by the above factors affecting takeoff perform- ance, but also by the length and slope of the runway. Below V1, in case of critical failures, the takeoff should be aborted; above V1 the pilot continues the takeoff and returns for land- ing. After the co-pilot calls V1, Then, V2 (the safe takeoff speed) is called. This speed must be maintained after an engine failure to meet per- formance targets for rate of climb and angle of climb.
The speeds needed for takeoff are relative to the motion of the air (indicated airspeed). A head wind will reduce the ground speed needed for takeoff, as there is a greater flow of air over the wings. This is why the aircrafts always take off against the wind. Side wind is not preferred as it would disturb the stability of the aircraft. Typical takeoff air speeds for jetliners are in the 130–155 knot range (150–180 mph, 240–285 km/h). For a given aircraft, the takeoff speed is usually directly proportional to the aircraft weight; the heavier the weight, the greater the speed needed. Some aircraft have difficulty generating enough lift at the low speeds encountered during takeoff. These are therefore fitted with high-lift devices, often including slats and usually flaps, which increase the camber of the wing, making it more effective at low speed, thus creating more lift. These have to be deployed from the wing before performing any maneuver.
At the beginning of the climb phase, the wheels are retracted into the aircraft and the undercarriage doors are closed. This operation is audible by the passengers as a noise coming from below the floor.
Climb:
Following take-off, the aircraft has to climb to a certain altitude (typically 30,000 ft or 10 km) before it can cruise at this altitude in a safe and economic way. A climb is carried out by increasing the lift of wings supporting the aircraft until their lifting force exceeds the weight of the aircraft. Once this occurs, the aircraft will climb to a higher altitude until the lifting force and weight are again in balance. The increase in lift may be accomplished by increasing the angle of attack of the wings, by increasing the thrust of the engines to increase speed (thereby increasing lift), by increasing the surface area or shape of the wing to produce greater lift, or by some combination of these techniques. In most cases, engine thrust and angle of attack are simultaneously increased to produce a climb.
Because lift diminishes with decreasing air density, a climb, once initiated, will end by itself when the diminishing lift with increasing altitude drops to a point that equals the weight of the aircraft. At that point, the aircraft will return to level flight at a constant altitude. During climb phase, it is normal that the engine noise diminishes. This is because the engines are operated at a lower power level after the take-off. It is also possible to hear a whirring noise or a change in the tone of the noise during climb. This is the sound of the flaps that are retracting. A wing with retracted flap produces less noise.
Cruise:
Cruise is the level portion of aircraft travel where flight is most fuel efficient. It occurs between ascent and descent phases and is usually the majority of a journey. Technically, cruising consists of heading (direction of flight) changes only at a constant airspeed and altitude. It ends as the aircraft approaches the destination where the descent phase of flight commences in preparation for landing.
For most commercial passenger aircraft, the cruise phase of flight consumes the majority of fuel. As this lightens the aircraft considerably, higher altitudes are more efficient for additional fuel economy. However, for operational and air traffic control reasons it is necessary to stay at the cleared flight level. Typical cruising speed for long-distance commercial passenger flights is 475-500 knots (878-926 km/h; 547-578 mph).
Commercial or passenger aircraft are usually designed for optimum performance at their cruise speed. There is also an optimum cruise altitude for a particular aircraft type and conditions including payload weight, center of gravity, air temperature, humidity, and speed. This altitude is usually where the drag is minimum and the lift is maximum. As in any phase of the flight, the aircraft in cruise mode is always in communication with an Air Traffic Control (ATC) station. Although the general tendency is to follow a straight line towards the destination, there may be some deviations from the flight plan for weather, turbulence or air traffic rea- sons, after receiving clearance from ATC.
Descent
A descent during air travel is any portion where an aircraft decreases altitude. Descents are an essential component of an approach to landing. Other partial descents might be to avoid traffic, poor flight conditions (turbulence or bad weather), clouds (particularly under visual flight rules), to see something lower, to enter warmer air (in the case of extreme cold), or to take advantage of wind direction of a different altitude. Normal descents take place at a con- stant airspeed and constant angle of descent (3 degree final approach at most airports). The pilot controls the angle of descent by varying engine power and pitch angle (lowering the nose) to keep the airspeed constant.
At the beginning of and during the descent phase, the engine noise diminishes further as the engines are operated at low power settings. However, towards the end of the descent phase, the passenger can feel further accelerations and an increase in the noise. This is to realize the “final approach” before taking “landing posi- tion”.
Landing
Landing is the last part of a flight, where the aircraft returns to the ground. Aircraft usually land at an airport on a firm runway, generally constructed of asphalt concrete, concrete, gravel or grass. To land, the airspeed and the rate of descent are reduced to where the object descends at a slow enough rate to allow for a gentle touch down. Landing is accomplished by slowing down and descending to the runway. This speed reduction is accomplished by reducing thrust and/or inducing a greater amount of drag using flaps, landing gear or speed brakes. As the plane approaches the ground, the pilot will execute a flare (roundout) to induce a gentle landing. Although the pilots are trained to perform the landing operation, there are “Instrument Landing Systems” in most of the airports to help pilots land the aircrafts. An instrument landing system (ILS) is a ground-based instrument approach system that provides precision guid- ance to an aircraft approaching and landing on a runway, using a combination of radio signals and, in many cases, high-intensity lighting arrays to enable a safe landing during instrument meteorological conditions (IMC), such as low ceilings or reduced visibility due to fog, rain, or blowing snow.
At the beginning of the landing phase, the pas- sengers will hear the opening of the doors of the landing gears. As the landing gears are deployed, they will create an additional drag and an additional noise. Immediately after touch-down, the passengers can hear a blowing sound, sometimes with increasing engine sound. This is the engine’s thrust reverses, helping the aircraft to slow down to taxi speeds by redirecting the airflow of the engines for- ward. Once the aircraft is decelerated to low speed, it can taxi to the terminal building.
Q5. Learn about take-off power, tire design, rolling resistance, tire pressure, brake forces when landing.
ANS:
TAKE-off power:
A normal takeoff is one in which the airplane is headed into the wind; there are times that a takeoff with a tail wind is
necessary. However, the pilot must consult the POH/AFM to ensure the aircraft is approved for a takeoff with a tail wind and that there is sufficient performance and runway length for the takeoff. Also, the takeoff surfaces are firm and of sufficient length to permit the airplane to gradually accelerate to normal lift-off and climb-out speed, and there are no obstructions along the takeoff path.
The amount of power that an engine is allowed to produce for a limited period of time for takeoff. The use of takeoff power is usually limited to 5 min for reciprocating engines and up to 2½ min for gas turbine engines. This may not always be the case. Specifically, with respect to reciprocating engines, it is the brake horsepower developed under standard, sealevel conditions and under the maximum conditions of the crankshaft rotational speed and the engine manifold pressure approved for the normal takeoff. It is limited in continuous use to the period of time shown in the approved engine specifications. With respect to gas turbine engines, it is the thrust developed under static conditions at a specified altitude and atmospheric conditions of the rotor shaft rotational speed and gas temperature approved for the normal takeoff. It is limited in continuous use to the period of time shown in the approved engine specifications.
tire design:
Tire construction:
An aircraft tire is constructed for the purpose it serves. Unlike an automobile or truck tire, it does not have to carry a load for a long period of continuous operation. However, an aircraft tire must absorb the high impact loads of landing and be able to operate at high speeds even if only for a short time. The deflection built into an aircraft tire is more than twice that of an automobile tire. This enables it to handle the forces during landings without being damaged. Only tires designed for an aircraft as specified by the manufacturer should be used.
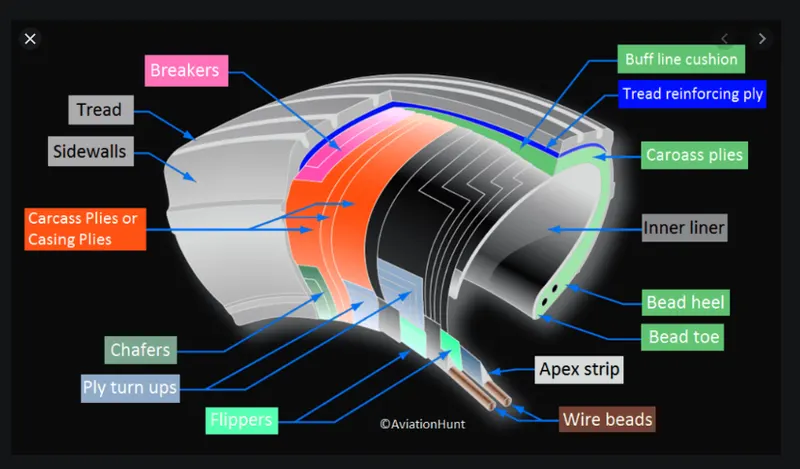
It is useful to the understanding of tire construction to identify the various components of a tire and the functions contributed to the overall characteristics of a tire. Refer to Figure 6 for tire nomenclature used in this discussion.
Bead:
An apex strip is additional rubber formed around the bead to give a contour for anchoring the ply turn-ups. Layers of fabric and rubber called flippers are placed around the beads to insulate the carcass from the beads and improve tire durability. Chafers are also used in this area. Chafer strips made of fabric or rubber are laid over the outer carcass plies after the plies are wrapped around the beads. The chafers protect the carcass from damage during mounting and demounting of the tire. They also help reduce the effects of wear and chafing between the wheel rim and the tire bead especially during dynamic operations.
Carcass Plies:
Once the plies are in place, bias tires and radial tires each have their own type of protective layers on top of the plies but under the tread of the running surface of the tire. On bias tires, these single or multiple layers of nylon and rubbers are called tread reinforcing plies. On radial tires, an undertread and a protector ply do the same job. These additional plies stabilize and strengthen the crown area of the tire. They reduce tread distortion under load and increase stability of the tire at high speeds. The reinforcing plies and protector plies also help resist puncture and cutting while protecting the carcass body of the tire.
Tread:
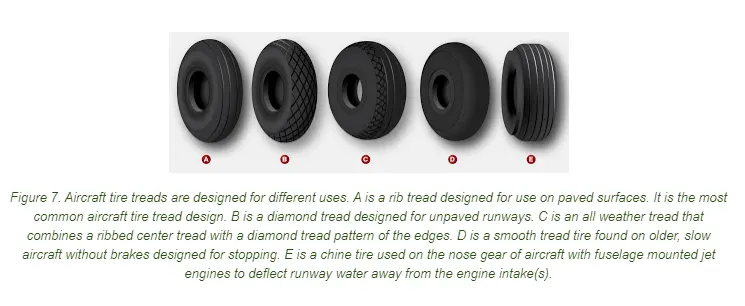
The inner sidewall of a tire is covered by the tire inner liner. A tube-type tire has a thin rubber liner adhered to the inner surface to prevent the tube from chafing on the carcass plies. Tubeless tires are lined with a thicker, less permeable rubber. This replaces the tube and contains the nitrogen or inflation air within the tire and keeps from seeping through the carcass plies.
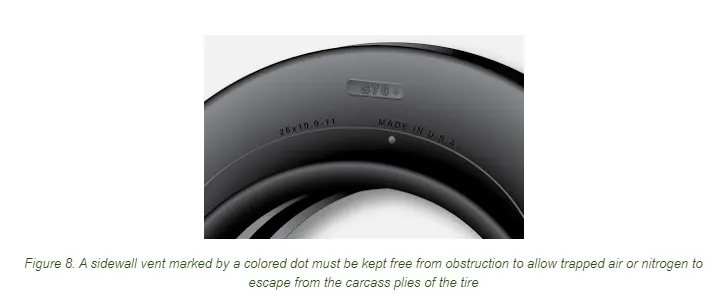
The inner liner does not contain 100 percent of the inflation gas. Small amounts of nitrogen or air seep through the liner into the carcass plies. This seepage is released through vent holes in the lower outer sidewall of the tires. These are typically marked with a green or white dot of paint and must be kept unobstructed. Gas trapped in the plies could expand with temperature changes and cause separation of the plies, thus weakening the tire leading to tire failure. Tube-type tires also have seepage holes in the sidewall to allow air trapped between the tube and the tire to escape.
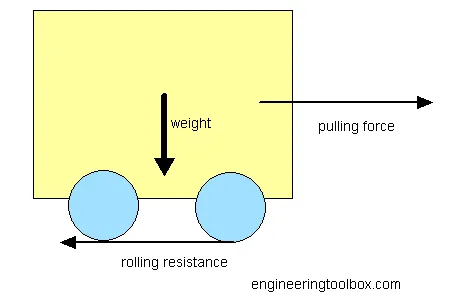
The rolling resistance can be expressed by the generic equation
Fr = c W (1)
where
Fr = rolling resistance or rolling friction (N, lbf)
c = rolling resistance coefficient - dimensionless (coefficient of rolling friction - CRF)
W = m ag
= normal force - or weight- of the body (N, lbf)
Rolling Coefficients Cars
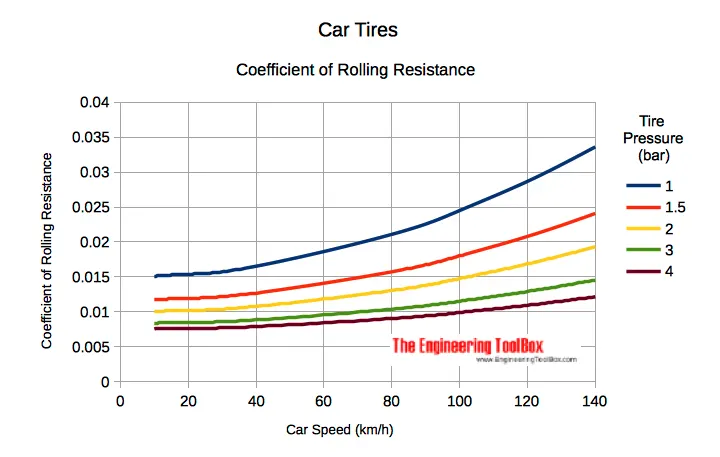
The rolling coefficients for air filled tires on dry roads can be estimated
c = 0.005 + (1 / p) (0.01 + 0.0095 (v / 100)2) (3)
where
c = rolling coefficient
p = tire pressure (bar)
v = velocity (km/h)
m = mass of body (kg, lb)
ag = acceleration of gravity (9.81 m/s2, 32.174 ft/s2)
Note that the rolling resistance coefficient - c - is influenced by different variables like wheel design, rolling surface, wheel dimensions and more.
The rolling resistance can alternatively be expressed as
Fr = cl W / r (2)
where
cl = rolling resistance coefficient - dimension length (coefficient of rolling friction) (mm, in)
r = radius of wheel (mm, in)
Tyre pressure:
Aircraft brakes also prevent motion of the aircraft when it is parked, limit its speed during taxiing and can even help steer the aircraft on the ground by applying different levels of braking force to the left- and right-side brakes.
Aircraft brakes work in conjunction with other brake mechanisms such as thrust reversers, air brakes and spoilers. Thrust reversers are surfaces that are deployed into the path of the jet blast from the engines to redirect propulsive thrust in a direction that opposes the motion of the aircraft. Air brakes and spoilers are flight control surfaces that create additional aerodynamic drag when deployed into the path of air flowing around the aircraft.
How aircraft brakes work
The most common type of brake used on aircraft is the disc brake. Disc brakes function by exploiting friction between rotating and stationary discs inside the brake.
Upon receiving a command signal to brake — from the pilot depressing a foot pedal or from the autobrake system — actuators in the brake move a piston to squeeze the discs together, generating a frictional force that slows the rotation of the wheel. The friction between the discs generates heat as the aircraft’s kinetic energy is converted to heat energy. In this function, the brakes act as a heat sink, absorbing tremendous amounts of heat as the aircraft sheds kinetic energy. During RTO stops, the temperature of carbon disc brakes can exceed 1,800° C.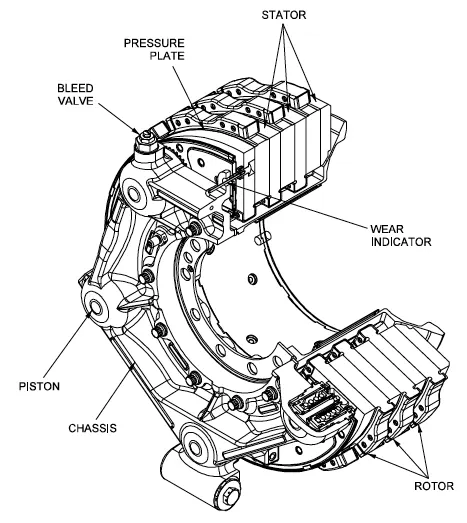
Gulfstream G450 main landing gear brake assembly. Source: G450 Maintenance Manual via Code 7700
The discs are mounted on a carrier assembly consisting of a torque tube, which resists and transmits brake torque to the landing gear structure. Sandwiched together between the carrier assembly housing and a backing plate, the discs are arranged in an alternating pattern of rotors and stators. Notch and groove geometry around the circumference of each rotor fits into corresponding geometry in the wheel, keying the rotors to the wheel so that they rotate with it. The stators are keyed to the torque tube and are thus held stationary since the torque tube is connected to the axle and landing gear structure.
Cylindrical spaces within the carrier assembly hold actuator pistons. Braking occurs as piston force squeezes the discs together.
During each application of the brakes, disc material is worn away by frictional forces. A wear indicator in the form of a pin that protrudes out of the carrier assembly indicates the thickness of the stack of discs. Over hundreds of brake applications, material wears away and discs become thinner, requiring replacement following periodic maintenance intervals.
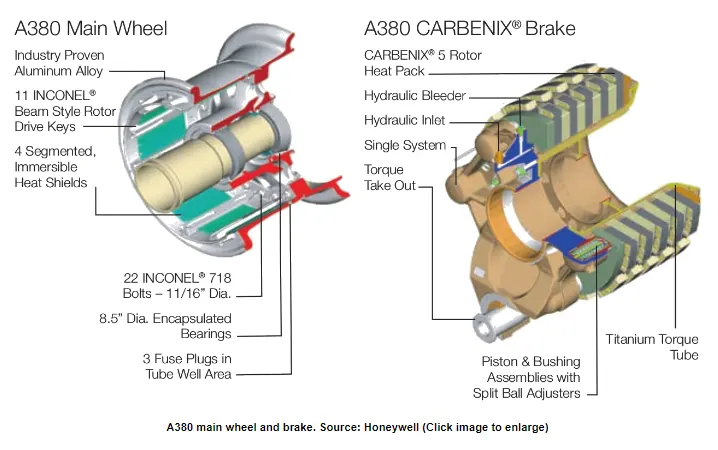
Brake design
Q6. With necessary assumptions, calculate the force and power required to push / pull an aircraft by a towing vehicle.
ANS:
a. Rolling Resistance Force
The rolling resistance force is mainly experienced by the tire when the vehicle moves over any surface.
The rolling resistance force is given by the expression
`F_(rr)=mu_(rr)*M*g`
Where `mu_(rr)`= coefficient of rolling resistance
M*g = weight in Newtons
The coefficient of rolling resistance depends on many factors like tire pressure, the material of the tire, thread pattern of the tire, temperature of the tire, and road roughness and liquids on the road.
Here, we are taking the heaviest flight as a reference to design our electric-powered towing tractor because if we design for heavy application all the light aircraft can push/pulled too.
Solution:
Weight of the aircraft (Antonov-AN 225) = 640000 kg
Weight of the towing tractor = 50000 kg (To provide enough traction)
Rolling resistance coefficient of towing vehicle (`mu_(rr)`) = 0.002 (Assume)
Rolling resistance coefficient of an aircraft tire (`mu_(rr)`) = 0.00 (Assume)
Rolling resistance force of towing tractor = `mu_(rr)*M*g`
= 0.002*50000*9.81
= 981 N
Rolling resistance force of aircraft = `mu_(rr)*M*g`
= 0.005*640000*9.81
= 31392 N
Total rolling resistance force = Rolling resistance force of aircraft + Rolling resistance force of towing tractor
= 981 + 31392
= 32373 N
= 32.373 KN
b. Air drag force
The air drag force is the force that occurs due to air striking effects on the vehicle when it moves.
The vehicle moves through an air medium of particular density value with a certain speed, this causes the air to strike against the vehicle and it causes a drag on the vehicle.
The aerodynamic drag force is given by the expression
`F_(ad)= 1/2*rho*A*V^2*C_d`
Where `rho` = density of air medium
A = frontal area of the vehicle
V = Velocity of the vehicle
`C_d` = drag coefficient
Solution:
The velocity of the aircraft while towing = 30 kmph = 8.33 m/s (Assume)
The density of Air medium = 1.3 (Assume)
The frontal area of the aircraft = 20 `m^2`
The drag coefficient of the aircraft = 0.025 (Assume)
Air drag force = `1/2*rho*A*V^2*C_d`
= `1/2*1.3*20*30^2*0.025`
= 292.5 N
= 0.292 KN
Therefore, the total force that the motor needs to overcome = Rolling resistance force + Air drag force
= 32.373 + 0.292
= 32.665 KN
c. Power requirement
The power required by the motor is given by the velocity with which the towing operation takes place.
The average speed of push/pull = 25 kmph = 6.95 m/s (Assume)
The power required by the motor = Total forces * push/pull velocity
= 32.665*6.95
= 227.02175 KW
We know that the total tractive force (`F_(te)`) = T * G/r
Where T = output torque
G = Gear ratio
r = radius of tire
For a heavy-duty towing tractor, we assume
G = 11 (for delivering high torque)
r = 30 inches = 0.762 m
Therefore, `T= (F_(te)*r)/G`
`T=(32.665*0.762)/11`
T = 2.2628 KN-m
Results: The total tractive force, the power required, and the torque required to push/pull an aircraft by a towing vehicle are 32.665 KN, 227.02175 KW, and 2.2628 KN-m respectively.
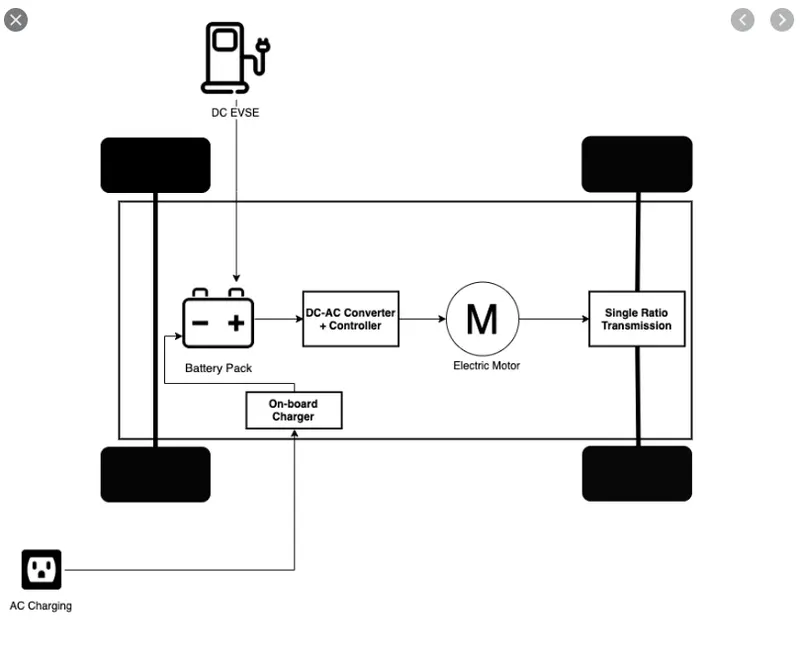
Q7. Design an electric powertrain with type of motor, it’s power rating, and energy requirement to fulfill aircraft towing application. Estimate the duty cycle range to control the aircraft speed from zero to highest. Make all required assumptions. Prepare a table of assumed parameters. Draw a block diagram of powertrain.
ANS:
Taking values of some parameters calculated in the previous question as a reference for this question.
Energy is the capacity to do work. Energy is power integrated over time.
Assuming the operational time of the Towing truck to be around 12 minutes for one cycle
12 minutes = 0.2 hours
Therefore, Energy = Power * Time
= 227 * 0.2
= 45.4 KW/hr
Therefore, the battery must be able to store the energy of 45.4 KW/hr and should deliver the energy throughout the run time in order for the motor to produce 2.26 KN-m of torque instantaneously.
Thus the storage of energy in batteries with high-performance ultracapacitors is selected to fulfill the required power delivery.
Motor selection:
Here we have selected a Brushless DC Motor that has a power rating of 227 KW and with the proper gear ratio and transmission, it should be able to deliver 2.26 KN-m of torque instantaneously.
Assuming the Battery armature voltage = 450 V
And Battery armature current = 350 A
For getting the maximum output from the motor (227 KW), the voltage applied to the motor terminals must be 900 Volts at the positive and negative terminals.
Here we are using a DC-DC Boost Converter to upscale the voltage level from the battery to the required level so that when supplied to the motor we can get the desired power output from the motor.
The boost converter converts the 400 V of the armature voltage to a high voltage level of 1000 V.
Accordingly, a battery of 250 KW power rating is selected for supplying to the motor of 227 KW rating.
Therefore, the duty cycle range to control the speed from 0 to max speed (here 6.95 m/s) is
d = Required power/ Rated power = `227/250` = 0.908
This means the controller should provide a duty cycle ranging from 0 to 90.8% in order to control the towing speed.
Now, Motor terminal voltage = Armature voltage * Duty cycle
= 1000 * 0.908
= 908 V
Since Motor terminal voltage > Required voltage
With 90.8% of duty cycle the voltage at Motor terminals = 900 V, which gives the full power with all gearings instantaneously.
Thus, by varying the Duty Cycle value the speed of towing vehicle is controlled.
The table for all the assumed parameters is as below
| Parameter | Value |
| Mass of Aircraft (kg) | 640000 |
| Mass of Towing vehicle (kg) | 50000 |
| Coefficient of rolling resistance for Aircraft | 0.002 |
| Coefficient of rolling resistance for Towing vehicle | 0.005 |
| Drag coefficient for Aircraft | 0.025 |
| Drag coefficient for Towing vehicle | 0.015 |
| Frontal area of Aircraft (m^2) | 20 |
| Frontal area of Towing vehicle (m^2) | 5 |
| Towing speed (kmph) | 30 |
| Air density | 1.3 |
| Time for towing (secs) | 12 |
| Tire radius (inches) | 30 |
| Gear ratio | 11 |
| Battery rating (KW) | 250 |