Project-1: Powertrain for aircraft in runways
Part-A:
Solution to Question 1:
In a aircraft we can define the weight of the aircraft using the following definitions:
Aircraft Empty Weight (AEW)
This is sometimes referred to as OEW – Operating Empty Weight and it is the weight of the aircraft with all its equipment on board but no fuel, no passengers or no cargo. Think of this like the aircraft has just come out of the factory and is sitting waiting to be fueled up for delivery to the customer.
Aircraft Maximum Gross Takeoff Weight (MGTW)
This is the maximum permissible weight the aircraft can weigh as it lifts off the ground at takeoff. This includes the aircraft’s empty weight, the fuel, the crew, the passengers, and all the cargo.
This weight limit is set by the manufacturer and is gospel. Many aircraft accidents have been caused by an aircraft being overweight and the pilot/s have not had enough power or maneuverability to prevent the accident.
Aircraft Useful Load
This is the weight that a pilot can place in the aircraft. Take the MGTW figure and subtract the AEW and this is the total useful load that can be placed into the aircraft. This is the fuel, crew, passengers, and cargo. The bigger the load, the more useful the aircraft can be to its customers.
Because the maximum Gross Takeoff Weight of an aircraft is so important it a listed in the Limitations Section of every aircraft flight manual. The exceedance of any weight in the limitations section deems the aircraft unairworthy.
Even the mammoth Antanov AN-225 has a maximum weight limit which the flight crew must adhere to, albeit considerably higher than the maximum takeoff weight of a Gulfstream G650!
This compromising is what pilots do for every flight to ensure the maximum fuel can be taken given the load to be lifted by the aircraft. No matter what aircraft are taking to the skies, the same calculations are the same for every aircraft! Fuel, Passengers, Cargo – That’s all the pilots can manipulate!
The folowing list showa the weights of different air carriers:
| Type | MTOW [kg] | MLW [tonnes] | TOR [m] | LR [m] | ICAO category | FAA category |
|---|---|---|---|---|---|---|
| Antonov An-225 | 640,000 | 591.7 | 3,500 | Heavy | Super | |
| Scaled Composites Model 351 Stratolaunch | 589,670 | 3,660 | Heavy | Super | ||
| Airbus A380-800[1][2][3] | 575,000 | 394 | 3,100 | 1,930 | Heavy | Super |
| Boeing 747-8F | 447,700 | 346.091 | 3,100 | 1,800 | Heavy | Heavy |
| Boeing 747-8 | 443,613 | 306.175 | 3,100 | Heavy | Heavy | |
| Boeing 747-400ER | 412,770 | 295.742 | 3,090 | Heavy | Heavy | |
| Antonov An-124-100M | 405,060 | 330 | 2,520 | 900 | Heavy | Heavy |
| Boeing 747-400 | 396,900 | 295.742 | 3,018 | 2,179 | Heavy | Heavy |
| Lockheed C-5 Galaxy[4][5][6] | 381,000 | 288.417 | 2,530 | 1,494 | Heavy | Heavy |
| Boeing 747-200[7] | 377,840 | 285.7 | 3,338 | 2,109 | Heavy | Heavy |
| Boeing 747-300[7] | 377,840 | 260.32 | 3,222 | 1,905 | Heavy | Heavy |
| Airbus A340-500[8] | 371,950 | 240 | 3,050 | 2,010 | Heavy | Heavy |
| Airbus A340-600[8] | 367,400 | 256 | 3,100 | 2,100 | Heavy | Heavy |
| Boeing 777F | 347,800 | 260.816 | 2,830 | Heavy | Heavy | |
| Boeing 777-300ER | 351,800 | 251.29 | 3,100 | Heavy | Heavy | |
| Boeing 777-200LR | 347,450 | 223.168 | 3,000 | Heavy | Heavy | |
| Boeing 747-100[7] | 340,200 | 265.3 | Heavy | Heavy | ||
| Airbus A350-1000 | 308,000 | 233.5 | Heavy | Heavy | ||
| Boeing 777-300 | 299,370 | 237.683 | 3,380 | Heavy | Heavy | |
| Boeing 777-200ER | 297,550 | 213 | 3,380 | 1,550 | Heavy | Heavy |
| Airbus A340-300[8][9] | 276,700 | 190 | 3000 | 1926 | Heavy | Heavy |
| McDonnell Douglas MD-11 | 273,300 | 185 | 2,990 | 1,890 | Heavy | Heavy |
| Airbus A350-900 | 270,000 | 175 | 2,670 | 1,860 | Heavy | Heavy |
| Ilyushin Il-96M | 270,000 | 195.04 | 3,115 | 2,118 | Heavy | Heavy |
| McDonnell Douglas DC-10 | 256,280 | 183 | 2,990 | 1,890 | Heavy | Heavy |
| Boeing 787-9[10] | 254,000 | 192.777 | 2,900 | Heavy | Heavy | |
| Boeing 787-10[10] | 254,000 | 201.849 | Heavy | Heavy | ||
| Airbus A340-200[8][11] | 253,500 | 181 | 2990 | Heavy | Heavy | |
| Airbus A330-900 | 251,000 | 191 | 3,100 | Heavy | Heavy | |
| Ilyushin IL-96-300 | 250,000 | 175 | 2,600 | 1,980 | Heavy | Heavy |
| Airbus A330-300[12][13] | 242,000 | 185 | 2500 | 1750 | Heavy | Heavy |
| Airbus A330-200[12][13] | 242,000 | 180 | 2,220 | 1,750 | Heavy | Heavy |
| Lockheed L-1011-500 | 231,300 | 166.92 | 2,636 | Heavy | Heavy | |
| Boeing 787-8[10] | 228,000 | 172.365 | 3,300 | 1,695 | Heavy | Heavy |
| Lockheed L-1011-200 | 211,400 | Heavy | Heavy | |||
| Ilyushin IL-86 | 208,000 | 175 | Heavy | Heavy | ||
| Boeing 767-400ER | 204,000 | 158.758 | 3,414 | Heavy | Heavy | |
| Airbus A300-600R[14] | 192,000 | 140 | 2,385 | 1,555 | Heavy | Heavy |
| Boeing 767-300ER | 187,000 | 136.08 | 2,713 | 1,676 | Heavy | Heavy |
| Concorde | 185,000 | 111.1 | 3,440 | 2,220 | Heavy | Heavy |
| Airbus A300-600[14] | 163,000 | 138 | 2,324 | 1,536 | Heavy | Heavy |
| Boeing 767-300 | 159,000 | 136.078 | 2,713 | 1,676 | Heavy | Heavy |
| Airbus A310-300[14] | 157,000 | 124 | 2,290 | 1,490 | Heavy | Heavy |
| Vickers VC10 | 152,000 | 151.9 | Heavy | Heavy | ||
| Boeing 707-320B[15] | 151,000 | 97.5 | Heavy | Heavy | ||
| Boeing 707-320C[15] | 151,000 | 112.1 | Heavy | Heavy | ||
| Douglas DC-8-61 | 147,000 | Heavy | Heavy | |||
| Airbus A310-200[14] | 142,000 | 123 | 1,860 | 1,480 | Heavy | Heavy |
| Airbus A400M | 141,000 | 122 | 980 | 770 | Heavy | Heavy |
| Douglas DC-8-32 | 140,000 | Heavy | Heavy | |||
| Douglas DC-8-51 | 125,000 | Medium | Large | |||
| Boeing 757-300 | 124,000 | 101.6 | 2,550 | 1,750 | Medium | Large |
| Boeing 707-120B[15] | 117,000 | 86.3 | Medium | Large | ||
| Boeing 757-200 | 116,000 | 89.9 | 2,347 | 1,555 | Medium | Large |
| Boeing 720B[16] | 106,000 | 79.5 | Medium | Large | ||
| Boeing 720[16] | 104,000 | 79.5 | Medium | Large | ||
| Tupolev Tu-154M | 104,000 | 80 | Medium | Large | ||
| Tupolev Tu-204SM | 104,000 | 87.5 | 2,250 | Medium | Large | |
| Convair 880 | 87,500 | Medium | Large | |||
| Boeing 737-900 | 85,000 | 66.36 | 2,500 | 1,704 | Medium | Large |
| Boeing 737-900ER | 85,000 | 71.35 | 2,804 | 1,829 | Medium | Large |
| Boeing 727-200 Advanced[17] | 84,000 | 70.1 | Medium | Large | ||
| Airbus A321-100[18] | 83,000 | 77.8 | 2,200 | 1,540 | Medium | Large |
| Boeing 737-800 | 79,000 | 65.32 | 2,308 | 1,634 | Medium | Large |
| Boeing 727-200[17] | 78,000 | 68.1 | Medium | Large | ||
| McDonnell-Douglas MD-83 | 73,000 | 63.28 | Medium | Large | ||
| Boeing 727-100[17] | 72,500 | 62.4 | Medium | Large | ||
| Boeing 727-100C[17] | 72,500 | 62.4 | Medium | Large | ||
| McDonnell-Douglas MD-90-30 | 71,000 | 64.41 | 2,165 | 1,520 | Medium | Large |
| de Havilland Comet 4 | 70,700 | Medium | Large | |||
| Boeing 737-700 | 70,000 | 58.06 | 1,921 | 1,415 | Medium | Large |
| Airbus A320-100[18] | 68,000 | 66 | 1,955 | 1,490 | Medium | Large |
| Boeing 737-400 | 68,000 | 54.9 | 2,540 | 1,540 | Medium | Large |
| de Havilland Comet 3 | 68,000 | Medium | Large | |||
| Boeing 377 | 67,000 | Medium | Large | |||
| Boeing 737-600 | 66,000 | 54.66 | 1,796 | 1,340 | Medium | Large |
| Airbus A220-300 | 65,000 | 57.61 | 1,890 | 1,494 | Medium | Large |
| Hawker Siddeley Trident 2E | 65,000 | Medium | Large | |||
| Airbus A319[18] | 64,000 | 62.5 | 1,850 | 1,470 | Medium | Large |
| Boeing 737-300 | 63,000 | 51.7 | 1,939 | 1,396 | Medium | Large |
| Boeing 737-500 | 60,000 | 49.9 | 1,832 | 1,360 | Medium | Large |
| Airbus A220-100 | 59,000 | 50.8 | 1,463 | 1,356 | Medium | Large |
| Airbus A318[18] | 59,000 | 57.5 | 1,375 | 1,340 | Medium | Large |
| Boeing 717-200HGW | 55,000 | 47.174 | 1,950 | Medium | Large | |
| Douglas DC-7 | 55,000 | Medium | Large | |||
| de Havilland Comet 2 | 54,000 | Medium | Large | |||
| Boeing 717-200BGW | 50,000 | 46.265 | 1,950 | Medium | Large | |
| de Havilland Comet 1 | 50,000 | Medium | Large | |||
| Douglas DC-6A | 48,600 | Medium | Large | |||
| Douglas DC-6B | 48,500 | Medium | Large | |||
| Embraer 190[19] | 48,000 | 43 | 2,056 | 1,323 | Medium | Large |
| Caravelle III | 46,000 | Medium | Large | |||
| Fokker 100 | 46,000 | 39.95 | 1,621 | 1,350 | Medium | Large |
| Douglas DC-6 | 44,000 | Medium | Large | |||
| Avro RJ-85 | 42,000 | 36.74 | Medium | Large | ||
| Handley Page Hermes | 39,000 | Medium | Large | |||
| Embraer 175[20] | 37,500 | 32.8 | 2,244 | 1,304 | Medium | Large |
| Bombardier CRJ900[21] | 36,500 | 33.345 | 1,778 | 1,596 | Medium | Large |
| Embraer 170[22] | 36,000 | 32.8 | 1,644 | 1,274 | Medium | Large |
| Bombardier CRJ700 | 33,000 | 30.39 | 1,564 | 1,478 | Medium | Large |
| Douglas DC-4 | 33,000 | Medium | Large | |||
| Vickers Viscount 800 | 30,400 | Medium | Large | |||
| Bombardier Q400 | 28,000 | 28.01 | 1,219 | 1,295 | Medium | Large |
| Bombardier CRJ200 | 23,000 | 21.319 | 1,918 | 1,479 | Medium | Large |
| ATR 72-600 | 22,800 | 22.35 | 1,333 | 914 | Medium | Large |
| Saab 2000 | 22,800 | 21.5 | 1,300 | Medium | Large | |
| Embraer ERJ 145 | 22,000 | 19.3 | 2,270 | 1,380 | Medium | Large |
| ATR 42-500 | 18,600 | 18.3 | 1,165 | 1,126 | Medium | Small |
| Saab 340 | 13,150 | 12.930 | 1,300 | 1,030 | Medium | Small |
| Embraer 120 Brasilia | 11,500 | 11.25 | 1,560 | 1,380 | Medium | Small |
| BAe Jetstream 41 | 10,890 | 10.57 | 1,493 | 826 | Medium | Small |
| Learjet 75[23] | 9,752 | 8.709 | 1,353 | 811 | Medium | Small |
| Pilatus PC-24[24] | 8,300 | 7.665 | 893 | 724 | Medium | Small |
| Embraer Phenom 300[25] | 8,150 | 7.65 | 956 | 677 | Medium | Small |
| Beechcraft 1900D | 7,765 | 7.605 | 1,036 | 853 | Medium | Small |
| Cessna Citation CJ4[26] | 7,761 | 7.103 | 1039 | 896 | Medium | Small |
| de Havilland Hercules | 7,000 | Medium | Small | |||
| Embraer Phenom 100 | 4,800 | 4.43 | 975 | 741 | Light | Small |
Where, MTOW = Maximum take-off weight, MLW = Maximum landing weight, TOR = Take-off run (SL, ISA+15°, MTOW), LR = Landing run (SL, ISA+15°, MLW)
Solution to Question 2:
In order to understand the difference between airspeed and ground speed first we have to mlearn about wind speed and the relation between the ground speed and air speed with repect to wind speed.
So, let us first understnad about the wind speed, air speed and ground speed.
Wind Speed
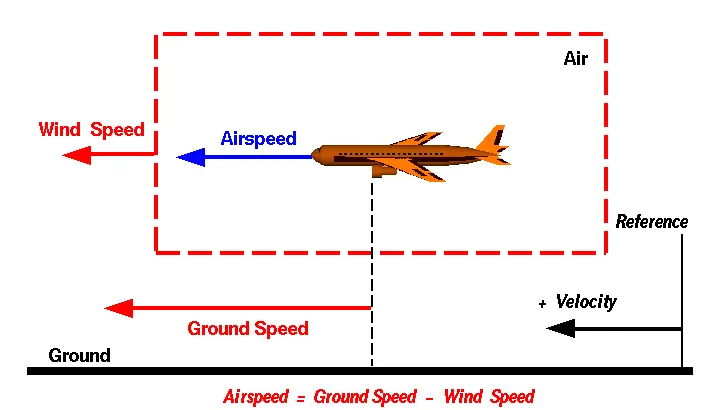
For a reference point picked on the ground, the air moves relative to the reference point at the wind speed. Notice that the wind speed is a vector quantity and has both a magnitude and a direction. Direction is important. A 20 mph wind from the west is different from a 20 mph wind from the east. The wind has components in all three primary directions (north-south, east-west, and up-down). In this figure, we are considering only velocities along the aircraft's flight path. A positive velocity is defined to be in the direction of the aircraft's motion. We are neglecting cross winds, which occur perpendicular to the flight path but parallel to the ground, and updrafts and downdrafts, which occur perpendicular to the ground.
Ground Speed
For a reference point picked on the ground, the aircraft moves relative to the reference point at the ground speed. Ground speed is also a vector quantity so a comparison of the ground speed to the wind speed must be done according to rules for vector comparisons.
Airspeed
The important quantity in the generation of lift is the relative velocity between the object and the air, which is called the airspeed. Airspeed cannot be directly measured from a ground position, but must be computed from the ground speed and the wind speed. Airspeed is the vector difference between the ground speed and the wind speed.
Airspeed = Ground Speed - Wind Speed
On a perfectly still day, the airspeed is equal to the ground speed. But if the wind is blowing in the same direction that the aircraft is moving, the airspeed will be less than the ground speed. The below image shows the relation of ground speed and air speed with respect to wind speed.
Solution to Question 3:
For movement on the ground the aircraft uses it own engine power, which is called taxing.
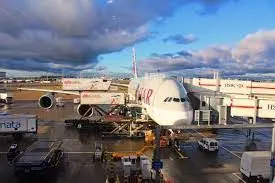
Although many aircrafts are capable of moving in backward using reverse thrust, as result the jet blast or prop wash might cause damage to the terminal building or equipment. Engine close to ground may also blow sand and debris forward and then suck them into the engine, causing damage to the engine. Therefore there are pushback trucks in the airport. A pushback truck lifts the front weel of the aircraft, their role in most airports is to move the aircraft away from the parking spot on to the taxiways, which is called towing.
i) Effectively a loss of control can happen, especially during high power engine running. Damage can occur to the aircraft itself, other aircraft nearby or to airside structures.
ii) There is a risk of injury to ground support personnel who may be in relatively close proximity to the aircraft. iii) It is easier for truck driver to see the surroundings better than the pilot sitting in the cockpit with limited window. The pushback driver knows the airport better than the pilot.
iv) It also saves fuel. virgin Atlantic had proposed a new system in which pushback truck will move the aircraft all the way to runway to save fuel and reduce impact of environment. v) The plane engines are very loud. When more than one plane will add up their sound, than it will not be pleasent for passangers and others near airport.
Solution to Question 4 :
TOWING In the parking areas, where taxing the aircraft is not practical or is unsafe, such as moving aircraft in and out of mainteance hangars, or moving aircraft that are not under their own power or moving backward, then towing of aircraft is performed using the power of a specialized ground vehicle attached to or supporting the nose landing gear. The traditional method of allowing the ground vehicle to move an aircraft is to attach it to the aircraft nose landing gear by means of towbar.
As the pilot can't see what is behind the aircraft, steering is done by pushback tractor driver and depending on the aircraft type and airline procedure, a bypass pin may be temporarily installed into the nose gear to disconnect it from the aircraft's normal steering mechanism. Once the towing is completed, the towbar is disconnected and the aircraft can taxiing forward under its own power.
TAXIING Taxiing is the movement of an aircraft on the ground under its own power while on the suface. The aircraft always moves following the yellow lines, to avoid collision with the surrounding buildings, vehicle or other aircrafts. The taxiing motion has a speed limit. Before making turn the pilot reduces speed further to prevent tire skids just like other vehicles. The reason for taxing is to reach the vehicle into runway or from runway to terminal.
Following the taxiway aircraft reaches the runway. Takeoff is the phase of flight in which an aircraft goes through a transition from moving along the ground (taxiing) to flying in the air, usually starting on a runway. Usually the engines are run at full power during takeoff. Following the taxi motion, the aircraft stops at the starting line of the runway. Before takeoff, the engines, particularly piston engines, are routinely run up at high power to check for engine-related problems. This makes a considerable noise. When the pilot releases the brakes, the aircraft starts accelerating rapidly until the necessary speed for take-off is achieved.
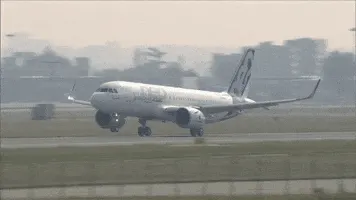
The takeoff speed required varies with air density, aircraft weight, and aircraft configuration (flap and/or slat position, as applicable). Air density is affected by factors such as field elevation and air temperature.
Solution to Question 5 :
Take off power
Power Requirement to Keep a Jet Aircraft in the Air
The total energy of an aircraft flying in the atmosphere can be calculated using equation,
E = ½ m v2+ mgh
However, the engines mounted onto the wings of the plane are required to provide additional energy per time, power, in order to keep the aircraft flying at a constant altitude and speed. This extra power needed to overcome the drag acting on the airplane and is calculated using
P = (dh/dt) m g
where (dh/dt) is the decent speed required to keep the plane's speed constant if the engines fail.
Takeoff and Climb :
When ready for takeoff, and cleared by Air Trafic Control to proceed, the pilot or first officer of an aircraft releases the brakes and advances the throttle to increase engine power to accelerate down the runway.
Once aligned on the runway, steering the aircraft is normally accomplished by using foot pedals that manipulate the nose wheel until the speed is sufficient enough that wind rushing by the rudder on the aircraft tail makes nose wheel steering unnecessary.
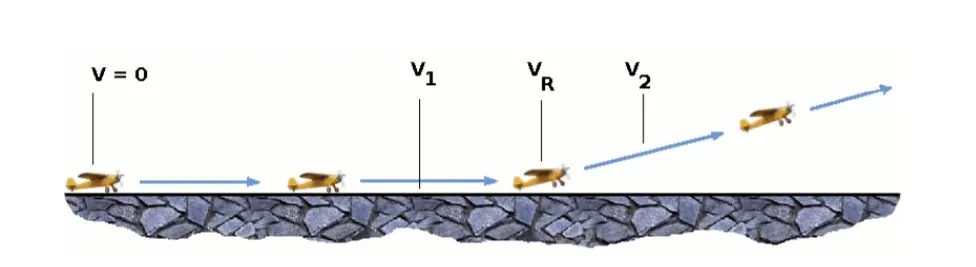
As the aircraft gains speed, air passes faster and faster over its wings and lift is created. Instruments onboard the aircraft display this airspeed, which equals not only the speed of the plane relative to the ground, but also the speed of any wind that may be blowing toward the aircraft (aircraft normally take off headed into the wind). When the airspeed reaches a certain predetermined point known as rotation speed, the pilot manipulates panels on the tail of the aircraft to rotate the nose of the plane upward. This creates even stronger lift and the plane leaves the ground.
Rotation speed, abbreviated VR, is one of three important airspeed settings calculated before every flight.
The others are V1 - the speed beyond which a safe stop on a runway is no longer possible; and V2 - the minimum speed needed to keep a plane flying should an engine fail after the aircraft surpasses V1. Some of the factors affecting VR and V2 are the weight of the aircraft, the air temperature and the altitude of the airport. The heavier the aircraft, the more lift, and thus speed is needed to get it off the ground. Aircraft also need to go faster to y on a hot day than on a cool day. Hot air is less dense than cool air and less density produces less lift for the same speed.
Similarly, the higher the altitude, the less dense the air. Aircraft need more speed to leave the ground at a place like Denver than at a place like New York, with all other factors such as weight being equal. Some of these factors also are important in calculating V1, although the key factor is the length of the runway that is being used.
Most large jets leave the ground at about 160 miles per hour and initially climb at an angle in excess of 15 degrees. The angle of a plane's wings to the air owing around them is extremely important to maintaining lift. If the so-called angle of attack is too severe, the ow of air around the wings becomes disrupted and the plane loses lift.
To make an aircraft more aerodynamically effcient, the wheels on which an aircraft rolls when it is on the ground are retracted into a cavity in the belly of the plane after it is airborne. There is less drag (wind resistance), and an aircraft can fly faster when its landing gear is retracted.
Tyre design
When it comes to safety tyres are one of the most important components of aircraft. They help to absorb the shock of landing and provide cushioning. It also provides the necessary traction for braking and stopping of an aircraft.
An aircraft tyre is designed to withstand extremely heavy loads while landing, take off, taxing and parking. The number of wheels required for aircraft increases with the weight of the aircraft, as the weight of the aeroplane needs to be distributed more evenly.
A Boeing 737NG & 737MAX uses 6 wheels, Boeing 787 uses 10 wheels, Boeing 777 uses 14 wheels and Airbus A380 uses 22 wheels. Aircraft tyres work under extreme conditions, carrying up to 340 tons and accelerating at over 250 km/hour at takeoff, in addition to enduring varied environmental stress when in flight and taxiing.
Design and Construction of Aircraft tyre
Carcass plies are used to form the tire. They are sometimes called casing plies. An aircraft tyre is constructed for the purpose it serves.
1. They support the weight of an aircraft while it is on the ground.
2. It also provides the necessary traction for braking and stopping of an aeroplane.
3. Tyre also helps to absorb the shock of landing and provide cushioning the roughness of takeoff, roll-out, and taxi operations.
Unlike an automobile or truck tyre, it does not have to carry a load for a long period of continuous operation. However, an aircraft tyre absorbs the high impact loads of landing and also it’s operating at high speeds for a short time when required.
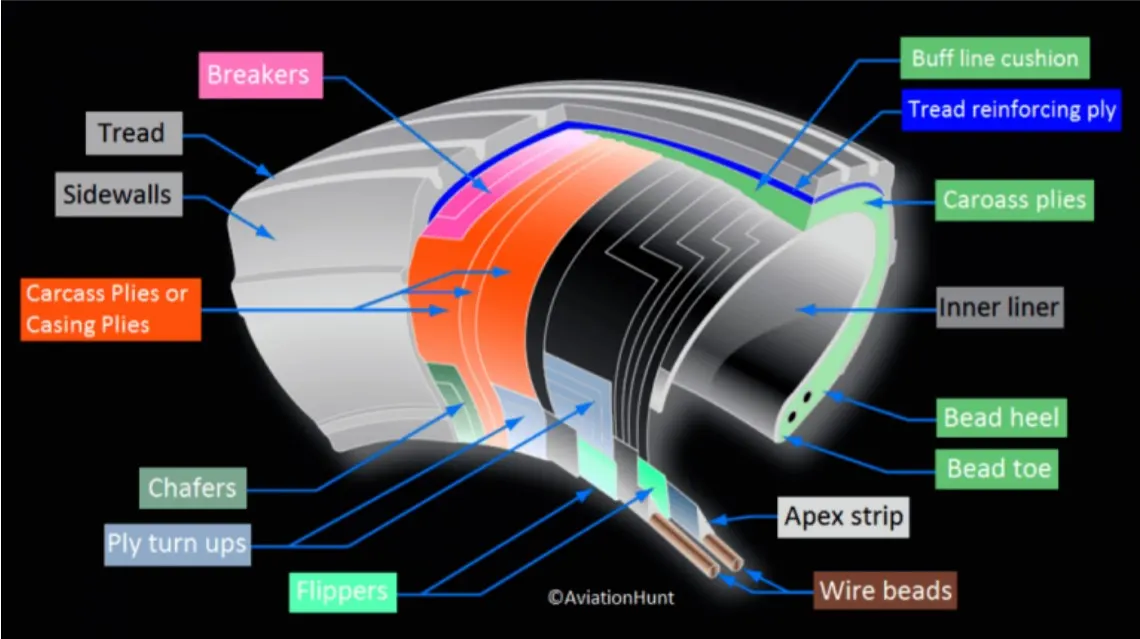
Some technical aspects of the tyre :
Retreading – Retreading is methods of restoring a worn tyre by renewing the tread area or by renewing the tread area plus one or both sidewalls. Repairs are included in the tyre retreading process.
Load Rating – Load rating is the maximum permissible load at a specified inflation pressure.
Ply Rating – Ply Rating is used to identify the maximum recommended load rating and inflation pressure for a specified tyre. It is an index of tyre strength.
Speed Rating – The speed rating is the maximum takeoff speed to which the tyre has been tested.
Skid Depth – Skid depth is the distance between the tread surface and the deepest groove as measured in the mould.
Aircraft tyres must have an approved speed and load rating and have sufficient clearance when retracted through landing gear to allow for tyre growth. Tyre growth is the increase in the size of the tyre due to centrifugal forces at high speed.
Aircraft tyres may be Tube-type or Tubeless
Tubeless tyres are more advantageous over tube-type. There is no longer the use of tube-type tyre in recent aviation. Nowadays all airliners are using tubeless tyres. Tubeless that are meant to be used without a tube has the word TUBELESS on the sidewall of the tyre.
Aircraft tyres may be Radial or Bias
Almost all airliners are using Radial tyre. Bias is an older design, and it’s mainly used for road vehicles. Radial tyres have the word RADIAL on the sidewall. Radial tires are more expensive than bias-ply tyres. Radial tires are in demand because of their lower life cycle cost and long term value.
Radial tyre construction :
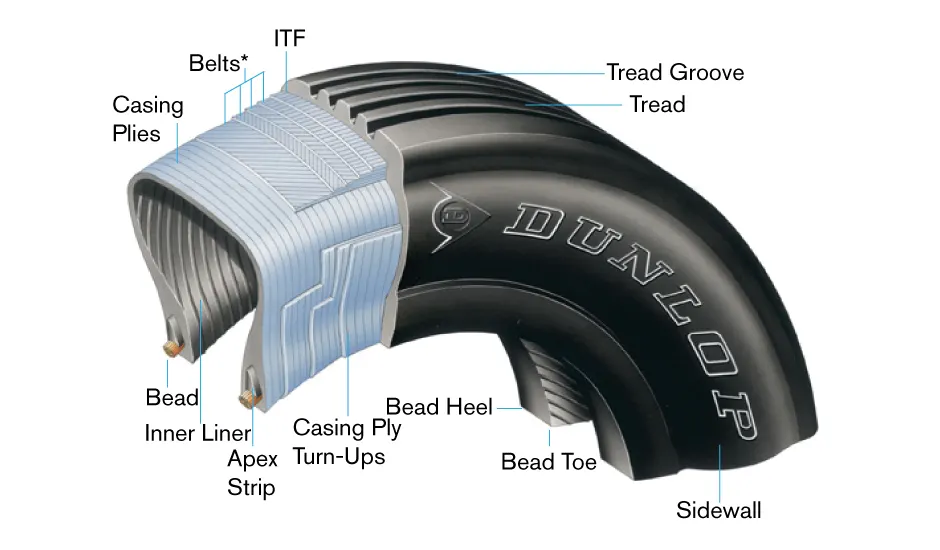
Radial tires are the most modern design of aircraft tyres. It is a design that is similar to that of car tyres. Typically, the radial tyre offers more landings per tread and lighter weight than a bias tyre; though sometimes at the expense of retread lives.
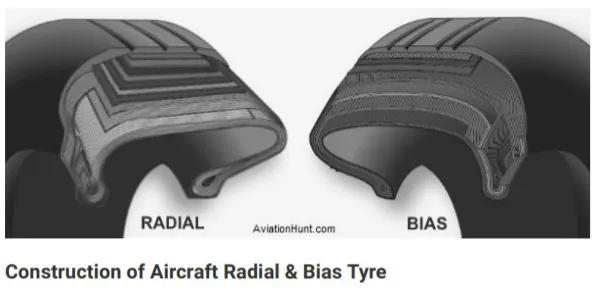
Radial aircraft tyres differ to bias aircraft tyres in that the plies all run radially from bead to bead at approximately 90° to the centre-line of the tyre. Angled belt plies are laid between the tread and the top casing ply, resulting in a flatter tread and adding strength to the tyre.
Bias ply tyre :
A bias-ply tyre has the fabric bias oriented with and across the direction of rotation and the sidewall. Since fabric can stretch on the bias, the tyre is flexible and can absorb loads. Tyre strength is obtained by adding plies.
Rolling resistance
Rolling resistance is one of the forces that act to oppose the motion of a cyclist. It is caused mainly because of deformation of the tyre and can be understood by thinking about:
1. energy losses due to heat (hysteresis)
2. the forces pushing on the tyre.
Energy is lost as heat
As the tyre comes into contact with the road, it changes shape as it is compressed (pushed in a bit). This compression causes parts of the rubber tube and the casing of the tyre to heat up. It also causes the tread on the outside of the tyre to heat up as it comes into contact with the road. A tyre with knobbly tread will have a lot more rolling resistance than a smooth tyre because there will be more rubber being compressed and so there will be more heat.
The tyre is a bit like a spring or a rubber band. Some of the energy is stored as the tyre becomes compressed (squeezed in). As the tyre comes back off the road, there is not as much of this stored energy returned because some of it has gone towards making the tyre heat up. This loss of available energy due to heating is called hysteresis. This means there will be less energy available to make the bike go faster.
If you feel the temperature of your tyres when you have been biking fast, you will notice this heat. If your tyres are not pumped up hard, there will be even more heat created.
The force of rolling resistance does not change at higher speeds. However, because there is a lot more heat being produced at higher speeds, the cyclist uses more power (energy per second) to work against rolling resistance.
Forces on the front part of the tyre are greater
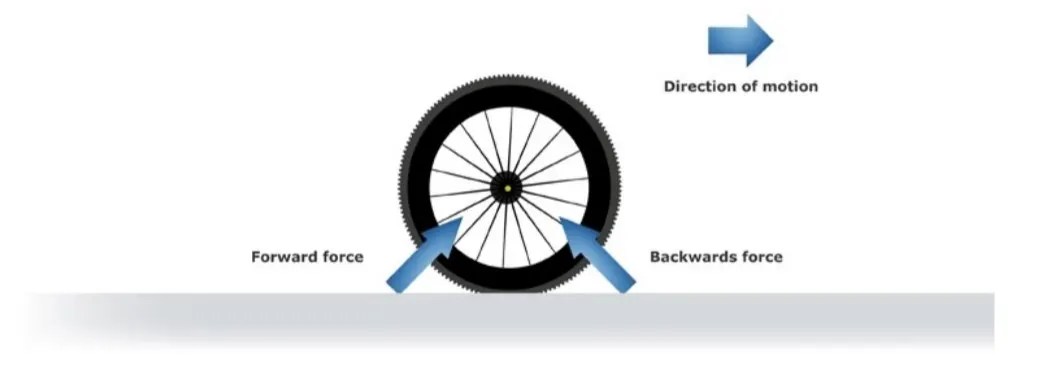
Forces on a tyre
Rolling resistance happens because the force pushing backwards against the tyre as it comes into contact with the road is bigger than the force pushing forwards as it leaves.
As the front part of the tyre touches the road, it takes a lot of force to squeeze in the tyre. This causes a backwards force on the wheel. As the tyre comes back off the road, there is a force pushing forwards on the wheel, but this forwards force is not as great. This is because of internal friction in the tyre.
If you could design a tyre that didn’t have internal friction and didn’t heat up, the force at the front section of the tyre contacting the road would be the same size as the force on the back section. This would mean zero rolling resistance, assuming there was no energy loss due to compression of the road surface.
Some things that affect rolling resistance
Rolling resistance depends on the mass of the cyclist and the bike, cornering, the design of your tyres, tyre pressure and road surface.
Mass – more mass means more downwards force due to gravity onto the road. This results in more tyre compression so rolling resistance increases. Carrying things like extra water bottles increases your rolling resistance.
Cornering – going through corners causes track cyclists to slow down, partly because cornering results in a greater downwards force into the track, which increases rolling resistance. (Cornering also increases rolling resistance because the rubber is twisting sideways on the road a bit, and this twisting produces more friction and heat.)
Design of tyres – choosing materials and construction that don’t heat up as much will result in less rolling resistance. One way to do this is to make your tubes out of specialised latex rubber. Racing tyres are very smooth, narrow and pumped up hard. The casing is also designed to minimise heat loss as it deforms. With as little of the tyre being compressed in as possible, there will not be as much of this heating effect, so there will be more energy available for more speed. There are many options for cyclists to consider.
Rolling resistance, sometimes called rolling friction or rolling drag, is the force resisting the motion when a body (such as a ball, tire, or wheel) rolls on a surface. It is mainly caused by non-elastic effects; that is, not all the energy needed for deformation (or movement) of the wheel, roadbed, etc., is recovered when the pressure is removed. Two forms of this are hysterises losses and permanent (plastic) deformation of the object or the surface (e.g. soil). Another cause of rolling resistance lies in the slippage between the wheel and the surface, which dissipates energy.
The rolling resistance force will be given by the equation as :
F = μ*mg
here :
μ = rolling resistance coefficient
m = total mass of aircraft
g = acceleration due to gravity
But when we consider the extreme condition the surace when considered with a snow we take many considerations into account :
When taking off from a runway covered with slush, standing water or snow, the required take-off ground-run distance will be longer than on a dry runway. This is the result of the fact thatslush, standing water and snow on the runway will generate a rolling resistance that increasesthe total resistance on the aircraft during the ground-run.
Snow is a porous, permeable aggregate of ice grains, which can be single crystals, or closegroupings of several crystals. Air and water vapor surround the crystals. Snow is a complicatedmaterial because of the variety of forms it can take and because it is thermodynamicallyunstable, which means that the physical properties of the snow can change with time (known assnow metamorphism). A large number of different types of snow are known. A possibleclassification of these types including typical densities, is given as follows:
•New snow (50-200 kg/m3)
•Powder snow (200-450 kg/m3)
•Compacted snow (450-700 kg/m3)
•Wet snow (300-700 kg/m3)
All these types of snow are compressible. This means that the volume changes when the snow isloaded. This volume change becomes evident as surface compaction. Density is probably themost useful single parameter of snow properties because e.g. structural characteristics showsome correlation with density. The compression strength of snow, and thus its bearing capacity,also appears to be strongly influenced by its density. Below a density of 400 kg/m3 the bearingcapacity of snow is usually very low resulting in large volume changes of the snow when it isloaded. At higher densities higher loads are required to compress the snow. Whenever snow issubjected to loads e.g. by moving the snow with a bulldozer or running a tire over it, the snowbecomes stronger than natural snow of the same density. This is a result of bond growthbetween the ice crystals. As already pointed out, snow is metamorphic. Environmentalinfluences like wind, temperature fluctuations, and rain can change the characteristics of snowwithin days and even within hours.
The total rolling resistance of an aircraft rolling along a snow-covered runway is given by:
Drolling = Dr+Dc+Dd
In which Dr is the rolling resistance on a dry hard surface. The equations presented in this paperfor Dc and Dd are for single tires. A complete aircraft has at least 3 tires, one on each mainlanding gear and one on the nose landing gear. To obtain the total aircraft rolling resistance dueto snow, the resistance Dc and Dd for each single tire have to be calculated and summed.
TYRE PRESSURE :
An aircraft tire or tyre is designed to withstand extremely heavy loads for short durations. The number of tires required for aircraft increases with the weight of the aircraft, as the weight of the airplane needs to be distributed more evenly. Aircraft tire tread patterns are designed to facilitate stability in high crosswood conditions, to channel water away to prevent hydroplaning, and for braking effect.
Aircraft tires also include fusible plugs (which are assembled on the inside of the wheels), designed to melt at a certain temperature. Tires often overheat if maximum braking is applied during an aborted takeoff or an emergency landing. The fuses provide a safer failure mode that prevents tire explosions by deflating in a controlled manner, thus minimizing damage to aircraft and objects in the surrounding environment.
The below image shows the comparision between the car and aircraft tyre pressure comparision :
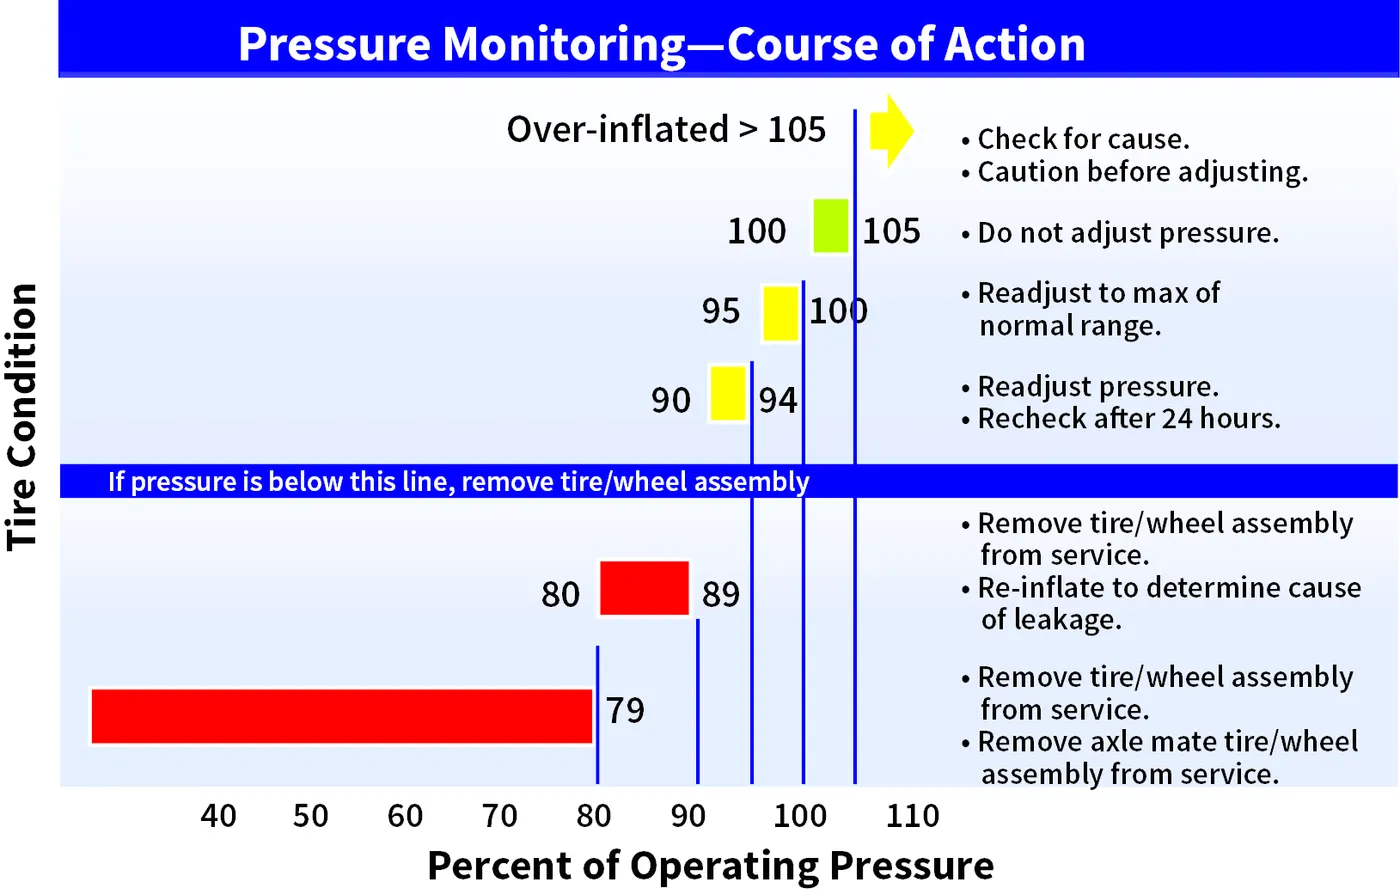
| CAR TYRE | AIRCRAFT (1) | AIR CRAFT (2) | |
| Typical | (737 NLG) | (737 NLG) | (F-16 Blk 40 MLG) |
| Size | P205/75 R15 | 27x7.75 R15 | 27.75x8.75R14.5 |
| Outside Diameter | 27.2 inch | 27 inch | 27.75 inch |
| Selection Width | 8.1 inch | 7.75 inch | 8.75 inch |
| Max Inflation | 35 psi | 200 psi | 320psi |
| Max Load | 1,598 lbs | 9,650 lbs | 21,500 lbs. |
| Speed Rating | 106 mph | 225 mph | 259 mph |
| Operation | Continuous | Intermittent | Intermittent |
| Temperature | Equilibrium | No Equilibrium | No Equilibrium |
By the above variation we can assume that what will be the pressure of aircrafts with respect to the normal 4 wheeler vehicles.
BRAKES FORCES WHILE LANDING :
Early aircraft had a single braking system with no backup or redundancy. This was seen as impractical by the operators and unacceptable by the regulating authorities so manufacturers were soon incorporating more robust braking systems into their designs. Some of the earlier solutions simply addressed the loss of the primary hydraulic pump and incorporated hand pumps or electrically driven hydraulic pumps to provide an alternate source of hydraulic pressure. These solutions did not address failures due to loss of fluid and were deemed inadequate. To overcome this, some manufacturers such as Convair incorporated a compressed air system into their designs for emergency braking. While it achieved the requirement of providing an independent means of activating the brakes, it was limited in that it did not allow for differential braking and in that the tank contained a finite amount of compressed air. Braking redundancy in most large passenger aircraft today is achieved by multiple, independent hydraulic systems backed up by accumulators. These systems allow for several layers of failure without resulting in total loss of braking capability.
Brake System Enhancements
Anti-skid, auto-brake, brake temperature indicators and brake fans are all systems which enhance the performance of the aircraft brakes.
Anti-skid System
The anti-skid system, through various mechanisms, compares the speed of the aircraft with the rotational speed of each main wheel. If the speed of any wheel is too slow for the existing aircraft speed, the brake on that wheel (or wheels) is released momentarily to allow the wheel speed to increase and prevent the wheel from skidding. The system is fully automatic and is active from immediately after initial wheel spin up on landing (during which time brake activation might (or might not) be inhibited) down to a design limited minimum speed; usually about 15 knots. Anti-skid systems are designed to minimise aquaplanning and the potential tyre damage which can occur when a wheel is locked or rotating at a speed which does not correspond to the speed of the aircraft. Anti-skid removes the possibility of reverted rubber skids caused by locked wheels. An anti-skid system also greatly improves stopping distance on substandard surfaces such as gravel or grass and is particularly effective on surfaces contaminated with frozen contaminants such as ice or slush by ensuring maximum effective breaking.
Auto-brake Systems
Auto-brake systems can be used on takeoff where they will provide maximum braking in the event of a rejected take-off and on landing where they will provide a scheduled rate of deceleration (dependent upon the auto-brake level selected) using only a single brake application. These features combine to optimize the brake usage with respect to the requirement and to minimize brake wear.
Solution to Part B:
6A)
push or pull an aircraft by a towing vehicle, 3 type of forces will act on that vehicle. Those are -
(i) Rolling resistance force
(ii) Aerodynamic drag force &
(iii) Hill climbing force.
(i) Rolling resistance force(Frr) : Rolling resistance is the force resisting the motion when a body rolls on a surface. It is the friction force that is needed to be overcome to move a vehicle. The kinetic energy of the wheels is partially converted into heat. The rolling resistance is proportional to the normal force perpendicular to the rolling wheel and is approximated by the rolling resistance coefficient urr. Therefore, Equation that can be used for the rolling resistance force of the entire system is-
Frr = Urr * m * g where,
urr= Rolling resistance co-efficient (It depends on the tire material, tire structure, tire temperature, road roughness, road material etc.)
m= Total mass of the vehicle (vehicle mass + payload) in kg g = gravitational constant , that is 9.8 m/s^2
| Urr of Car for different condition- | |
| CONDITION | Urr |
| Tires on concrete or asphalt | 0.013 |
| Tires on rolled gravel | 0.02 |
| Tar macadam | 0.025 |
| Unpaved road | 0.05 |
| Field | 0.1 - 0.35 |
Here in this case for towing vehicle for aircraft Urr= 0.013
(ii) Aerodynamic drag force(Fad) : Aerodynamic drag force is the force which is required to keep a vehicle moving. There are two component of this force , one is shape drag (due to the shape of the vehicle) and another is skin friction (due to friction between air and skin of the vehicle). When the vehicle moves the velocity of air near boundary is higher than the air surrounding. Both the tug and the aircraft will experience some aerodynamic drag. For completeness, the aerodynamic drag force caused by the aircraft and towing vehicle can be given by Equation below-
Fad = (1/2) * ρ * V^2 * A * (Cd_t + Cd_a);
where, ρ = Air density, that is normally 1.25 kg/m^3 A = Frontal area of the vehicle in m^2 Cd_t = Air drag co-efficient of towing vehicle Cd_a = Air drag co-efficient of aircraft
v = Velocity of the vehicle in m/s
With regard to the drag equation, the term A simply refers to some reference area. For airplanes, this is generally the planform area of the wing The designers design an aircraft in such a way that the reference area is optimal. So, for calculation this has been neglected.
| Cd for different types of vehicle- | |
| VEHICLE TYPE | Cd |
| Open Convertible | 0.5 - 0.7 |
| Van body | 0.5 - 0.7 |
| Ponton body | 0.4 - 0.55 |
| wedge- shaped body, head lamps and bumpers are integrated into the body, covered undeready optimized cooling air flow |
0.3 - 0.4 |
| Motor cycle | 0.6 - 0.7 |
| racing car | 0.2 - 0.25 |
In this case air drag co-efficient for towing vehicle(Cd_t)= 0.5 and for aircraft or payload(Cd_a)= 0.045
(iii) Hill climbing force(Fhc) : Hill climbing force is the force needed to move the vehicle in up gradient. To Hill Climbing force the expression of the equation is given below-
Fhc = m * g * sinφ where,
m = Total mass of the vehicle(vehicle mass + payload) in kg g = Gravitational constant that is 9.8 m/s^2 φ = up gradient angle or inclination angle in radian
In this case up gradient angle(φ) = 0, as there is no inclination.
Let's assume, (1) The towing vehicle mass = 50000 Kg (2) The aircraft mass or payload on towing vehicle = 183700 Kg S0, total mass of the system is (m) = (50000+183700) = 233700 Kg Frontal area of towing vehicle is (A) = 20 m^2 speed of the vehicle(V) = 30 Km/hr = 8.333 m/s
Rolling Resistance Force is calculated as shown here
(Frr) = urr * m * g =0.013 * (50000+183700) * 9.8 =29,773.38 N
Aerodynamic Drag Force(Fad) = (1/2) * ρ * V^2 * A * (Cd_t + Cd_a) = (1/2) * 1.225 * (2.778)^2 * 20 * (0.5+0.045) = 51.514 N
Hill Climbing Force(Fhc) = m * g * sinφ =(50000+183700) * 9.8 * sin(0) = 0 N
Total required traction Force (Tf) = Frr + Fad + Fhc =29773.38 + 51.514 + 0 =29.824kN
6B)
The Simulink model is attached here for reference.
Solution to Question 7:
The parameters for this problem are considered to be same as the previous question. Hence we can use the same values for the required tractive force and power. The required torque will be based on the radius of the wheel and is calculated as below:
Table for the necessary assumed parameters-
| Parameters Assumed For Powertrain Design- | |
| Aircraft Mass | 183700 Kg |
| Towing Vehicle Mass | 50000 Kg |
| Rolling Resistance Co-efficient | 0.013 |
| Air Density | 1.225 kg/m^3 |
|
Towing Vehicle Drag Co-efficient |
0.5 |
| Aircraft Drag Co-efficient | 0.045 |
| Frontal area | 20 m^2 |
| Inclination Angle | 0 rad |
| Tyre Pressure | 203 PSI/14 bar |
| Towing Velocity(V) |
10km/h =2.778m/s |
| Towing Time(t) | 2 min |
| Radius of the towing vehicle wheel |
0.38 m |
Therefore from the excel power calculator we have got the necessary Traction force(F) quantity that is = 29824.89427 N
and Required power(P) = F * V = 29824.894 * 2.778 =82846.928 W = 82.846 KW As we know Torque(T) = Force(F) * Wheel radious(r)
So, from the above equation we have got the required torque(T) = 29824.894 * 0.38 = 11333.45972 N-m.
Required Energy(E) for towing application based on the assumed time, that is
E = P * t = 82.846 * (120/3600) = 2.761 KWh
Depending on the initial requirement of torque in this case it should be maximum torque for smaller time we can use a DC series motor or an Induction motor for towing application.
The motor output power is the input power of the towing vehicle so to obtain maximum speed, the duty cycle needed is calculated as below-
Duty Cycle = Output Power/Input Power = (82.846/90)*100 = (0.921*100)%
So the duty cycle will be 92.1% The duty cycle range to control the aircraft speed from zero to highest is from 0 to 92.1 %
Block Diagram of the power train of the towing vehicle is as shown below:
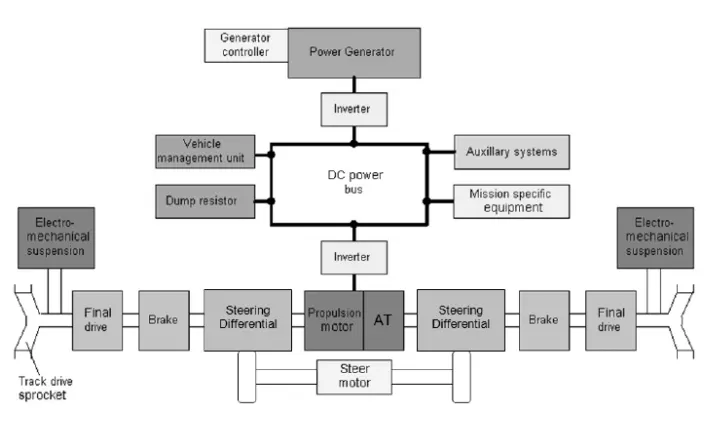
In the power train we can see that a towing vehicle is having a DC power Bus (usually batteries), will be there to store energy.So initally the AC input power will be converted to DC using a rectifier circuit and stored in batteries. Whenever the vehicle is powered on the energy from the batteries will be supplied to various systems of the vehicle for generating the required torque. In this case we need to have a battery storage of around 40KWH.