Project-1: Powertrain for aircraft in runways
1. TOTAL WEIGHT OF VARIOUS TYPES OF AIRCRAFT:
Design weight limits (structural design weights)
An aircraft's gross weight is limited by several weight restrictions in order to avoid overloading its structure or to avoid unacceptable performance or handling qualities while in operation.
Aircraft gross weight limits are established during an aircraft's design and certification period and are laid down in the aircraft's type certificate and manufacturer specification documents.
The absolute maximum weight capabilities of a given aircraft are referred to as the structural weight limits. The structural weight limits are based on aircraft maximum structural capability and define the envelope for the CG charts (both maximum weight and CG limits).
An aircraft's structural weight capability is typically a function of when the aircraft was manufactured, and in some cases, old aircraft can have their structural weight capability increased by structural modifications.
Maximum design taxi weight (MDTW)
The maximum design taxi weight (also known as the maximum design ramp weight (MDRW)) is the maximum weight certificated for aircraft manoeuvring on the ground (taxiing or towing) as limited by aircraft strength and airworthiness requirements.
Maximum design takeoff weight (MDTOW)
Is the maximum certificated design weight when the brakes are released for takeoff and is the greatest weight for which compliance with the relevant structural and engineering requirements has been demonstrated by the manufacturer.
Maximum design landing weight (MDLW)
The maximum certificated design weight at which the aircraft meets the appropriate landing certification requirements. It generally depends on the landing gear strength or the landing impact loads on certain parts of the wing structure.
The MDLW must not exceed the MDTOW.
The maximum landing weight is typically designed for 10 feet per second (600 feet per minute) sink rate at touch down with no structural damage.
Maximum design zero-fuel weight (MDZFW)
The maximum certificated design weight of the aircraft less all usable fuel and other specified usable agents (engine injection fluid, and other consumable propulsion agents). It is the maximum weight permitted before usable fuel and other specified usable fluids are loaded in specified sections of the airplane. The MDZFW is limited by strength and airworthiness requirements. At this weight, the subsequent addition of fuel will not result in the aircraft design strength being exceeded. The weight difference between the MDTOW and the MDZFW may be utilised only for the addition of fuel.
Minimum flight weight (MFW)
Minimum certificated weight for flight as limited by aircraft strength and airworthiness requirements.
Authorised weight limits
Aircraft authorised gross weight limits (also referred to as certified weight limits) are laid down in the aircraft filght manual (AFM) and/or associated certificate of airworthiness (C of A). The authorised or permitted limits may be equal to or lower than the structural design weight manual.
The authorised weight limits that can legally be used by an operator or airline are those listed in the AFM and the weight and balance manual.
The authorised (or certified) weight limits are chosen by the customer/airline and they are referred to as the "purchased weights". An operator may purchase a certified weight below the maximum design weights because many of the airport operating fees are based on the aircraft AFM maximum allowable weight values. An aircraft purchase price is, typically, a function of the certified weight purchased.
Maximum weights established, for each aircraft, by design and certification must not be exceeded during aircraft operation (ramp or taxying, takeoff, en-route flight, approach, and landing) and during aircraft loading (zero fuel conditions, centre of gravity position, and weight distribution).
Weights could be restricted on some type of aircraft depending on the aircraft handling requirements; for example aerobatic aircraft, where certain aerobatic manoeuvres can only be executed with a limited gross weight.
In addition, the authorised maximum weight limits may be less as limited by centre of gravity, fuel density, and fuel loading limits.
Maximum taxi weight (MTW)
The maximum taxi weight (MTW) (also known as the maximum ramp weight (MRW) is the maximum weight authorized for maneuvering (taxiing or towing) an aircraft on the ground as limited by aircraft strength and airworthiness requirements. It includes the weight of taxi and run-up fuel for the engines and the APU.
It is greater than the maximum takeoff weight due to the fuel that will be burned during the taxi and runup operations.
The difference between the maximum taxi/ramp weight and the maximum take-off weight (maximum taxi fuel allowance) depends on the size of the aircraft, the number of engines, APU operation, and engines/APU fuel consumption, and is typically assumed for 10 to 15 minutes allowance of taxi and run-up operations.
Maximum takeoff weight (MTOW)
The maximum takeoff weight (also known as the maximum brake-release weight) is the maximum weight authorised at brake release for takeoff, or at the start of the takeoff roll.
The maximum takeoff weight is always less than the maximum taxi/ramp weight to allow for fuel burned during taxi by the engines and the APU.
In operation, the maximum weight for takeoff may be limited to values less than the maximum takeoff weight due to aircraft performance, environmental conditions, airfield characteristics (takeoff field length, altitude), maximum tire speed and brake energy, obstacle clearances, and/or en route and landing weight requirements.
Maximum landing weight (MLW)
The maximum weight authorised for normal landing of an aircraft.
The MLW must not exceed the MTOW.
The operation landing weight may be limited to a weight lower than the Maximum Landing Weight by the most restrictive of the following requirements:
- Aircraft performance requirements for a given altitude and temperature:
-
- landing field length requirements,
- approach and landing climb requirements
- Noise requirements
If the flight has been of short duration, fuel may have to be jettisoned to reduce the landing weight.
Overweight landings require a structural inspection or evaluation of the touch-down loads before the next aircraft operation.
Maximum zero-fuel weight (MZFW)
The maximum permissible weight of the aircraft less all usable fuel and other specified usable agents (engine injection fluid, and other consumable propulsion agents). It is the maximum weight permitted before usable fuel and other specified usable fluids are loaded in specified sections of the airplane.
MTOW = Maximum take-off weight, MLW = Maximum landing weight, TOR = Take-off run (SL, ISA+15°, MTOW), LR = Landing run (SL, ISA+15°, MLW)
| Type | MTOW [kg] | MLW [tonnes] | TOR [m] | LR [m] | ICAO category | FAA category |
|---|---|---|---|---|---|---|
| Antonov An-225 | 640,000 | 591.7 | 3500 | Heavy | Super | |
| Scaled Composites Model 351 Stratolaunch | 589,670 | 3660 | Heavy | Super | ||
| Airbus A380-800 | 575,000 | 394 | 3100 | 1930 | Super | Super |
| Boeing 747-8F | 447,700 | 346.091 | 3100 | 1800 | Heavy | Heavy |
| Boeing 747-8 | 443,613 | 306.175 | 3100 | Heavy | Heavy | |
| Boeing 747-400ER | 412,770 | 295.742 | 3090 | Heavy | Heavy | |
| Antonov An-124-100M | 405,060 | 330 | 2520 | 900 | Heavy | Heavy |
| Boeing 747-400 | 396,900 | 295.742 | 3018 | 2179 | Heavy | Heavy |
| Lockheed C-5 Galaxy | 381,000 | 288.417 | 2530 | 1494 | Heavy | Heavy |
| Boeing 747-200] | 377,840 | 285.700 | 3338 | 2109 | Heavy | Heavy |
| Boeing 747-300 | 377,840 | 260.320 | 3222 | 1905 | Heavy | Heavy |
| Airbus A340-500 | 371,950 | 240 | 3050 | 2010 | Heavy | Heavy |
| Airbus A340-600] | 367,400 | 256 | 3100 | 2100 | Heavy | Heavy |
| Airbus A330-900 | 352,000 | 251.5 | 3100 | Heavy | Heavy | |
| Boeing 777-300ER | 351,800 | 251.29 | 3100 | Heavy | Heavy | |
| Boeing 777F | 347,800 | 260.816 | 2830 | Heavy | Heavy | |
| Boeing 777-200LR | 347,450 | 223.168 | 3000 | Heavy | Heavy | |
| Boeing 747-100 | 340,200 | 265.300 | Heavy | Heavy | ||
| Airbus A350-1000 | 308,000 | 233.5 | Heavy | Heavy | ||
| Boeing 777-300 | 299,370 | 237.683 | 3380 | Heavy | Heavy | |
| Boeing 777-200ER | 297,550 | 213.00 | 3380 | 1550 | Heavy | Heavy |
| Airbus A340-300[8][9] | 276,700 | 190 | 3000 | 1926 | Heavy | Heavy |
| McDonnell Douglas MD-11 | 273,300 | 185 | 2990 | 1890 | Heavy | Heavy |
| Airbus A350-900 | 270,000 | 175 | 2670 | 1860 | Heavy | Heavy |
| Ilyushin Il-96M | 270,000 | 195.04 | 3115 | 2118 | Heavy | Heavy |
| McDonnell Douglas DC-10 | 256,280 | 183 | 2990 | 1890 | Heavy | Heavy |
| Boeing 787-9[10] | 254,000 | 192.777 | 2900 | Heavy | Heavy | |
| Boeing 787-10[10] | 254,000 | 201.849 | Heavy | Heavy | ||
| Airbus A340-200[8][11] | 253,500 | 181 | 2990 | Heavy | Heavy | |
| Ilyushin IL-96-300 | 250,000 | 175 | 2600 | 1980 | Heavy | Heavy |
| Airbus A330-300[12][13] | 242,000 | 185 | 2500 | 1750 | Heavy | Heavy |
| Airbus A330-200[12][13] | 242,000 | 180 | 2220 | 1750 | Heavy | Heavy |
| Lockheed L-1011-500 | 231,300 | 166.92 | 2636 | Heavy | Heavy | |
| Boeing 787-8[10] | 228,000 | 172.365 | 3300 | 1695 | Heavy | Heavy |
| Lockheed L-1011-200 | 211,400 | Heavy | Heavy | |||
| Ilyushin IL-86 | 208,000 | 175 | Heavy | Heavy | ||
| Boeing 767-400ER | 204,000 | 158.758 | 3414 | Heavy | Heavy | |
| Airbus A300-600R[14] | 192,000 | 140 | 2385 | 1555 | Heavy | Heavy |
| Boeing 767-300ER | 187,000 | 136.08 | 2713 | 1676 | Heavy | Heavy |
| Concorde | 185,000 | 111.1 | 3440 | 2220 | Heavy | Heavy |
| Airbus A300-600[14] | 163,000 | 138 | 2324 | 1536 | Heavy | Heavy |
| Boeing 767-300 | 159,000 | 136.078 | 2713 | 1676 | Heavy | Heavy |
| Airbus A310-300[14] | 157,000 | 124 | 2290 | 1490 | Heavy | Heavy |
| Vickers VC10 | 152,000 | 151.9 | Heavy | Heavy | ||
| Boeing 707-320B[15] | 151,000 | 97.5 | Heavy | Heavy | ||
| Boeing 707-320C[15] | 151,000 | 112.1 | Heavy | Heavy | ||
| Douglas DC-8-61 | 147,000 | Heavy | Heavy | |||
| Airbus A310-200[14] | 142,000 | 123 | 1860 | 1480 | Heavy | Heavy |
| Airbus A400M | 141,000 | 122 | 980 | 770 | Heavy | Heavy |
| Douglas DC-8-32 | 140,000 | Heavy | Heavy | |||
| Douglas DC-8-51 | 125,000 | Medium | Large | |||
| Boeing 757-300 | 124,000 | 101.6 | 2550 | 1750 | Medium | Large |
| Boeing 707-120B[15] | 117,000 | 86.3 | Medium | Large | ||
| Boeing 757-200 | 116,000 | 89.9 | 2347 | 1555 | Medium | Large |
| Boeing 720B[16] | 106,000 | 79.5 | Medium | Large | ||
| Boeing 720[16] | 104,000 | 79.5 | Medium | Large | ||
| Tupolev Tu-154M | 104,000 | 80 | Medium | Large | ||
| Tupolev Tu-204SM | 104,000 | 87.5 | 2250 | Medium | Large | |
| Convair 880 | 87,500 | Medium | Large | |||
| Boeing 737-900 | 85,000 | 66.36 | 2500 | 1704 | Medium | Large |
| Boeing 737-900ER | 85,000 | 71.35 | 2804 | 1829 | Medium | Large |
| Boeing 727-200 Advanced[17] | 84,000 | 70.1 | Medium | Large | ||
| Airbus A321-100[18] | 83,000 | 77.8 | 2200 | 1540 | Medium | Large |
| Boeing 737-800 | 79,000 | 65.32 | 2308 | 1634 | Medium | Large |
| Boeing 727-200 | 78,000 | 68.1 | Medium | Large | ||
| McDonnell-Douglas MD-83 | 73,000 | 63.28 | Medium | Large | ||
| Boeing 727-100] | 72,500 | 62.4 | Medium | Large | ||
| Boeing 727-100C | 72,500 | 62.4 | Medium | Large | ||
| McDonnell-Douglas MD-90-30 | 71,000 | 64.41 | 2165 | 1520 | Medium | Large |
| de Havilland Comet 4 | 70,700 | Medium | Large | |||
| Boeing 737-700 | 70,000 | 58.06 | 1921 | 1415 | Medium | Large |
| Airbus A320-100 | 68,000 | 66 | 1955 | 1490 | Medium | Large |
| Boeing 737-400 | 68,000 | 54.9 | 2540 | 1540 | Medium | Large |
| de Havilland Comet 3 | 68,000 | Medium | Large | |||
| Boeing 377 | 67,000 | Medium | Large | |||
| Boeing 737-600 | 66,000 | 54.66 | 1796 | 1340 | Medium | Large |
| Airbus A220-300 | 65,000 | 57.61 | 1890 | 1494 | Medium | Large |
| Hawker Siddeley Trident 2E | 65,000 | Medium | Large | |||
| Airbus A319[18] | 64,000 | 62.5 | 1850 | 1470 | Medium | Large |
| Boeing 737-300 | 63,000 | 51.7 | 1939 | 1396 | Medium | Large |
| Boeing 737-500 | 60,000 | 49.9 | 1832 | 1360 | Medium | Large |
| Airbus A220-100 | 59,000 | 50.80 | 1463 | 1356 | Medium | Large |
| Airbus A318[18] | 59,000 | 57.5 | 1375 | 1340 | Medium | Large |
| Boeing 717-200HGW | 55,000 | 47.174 | 1950 | Medium | Large | |
| Douglas DC-7 | 55,000 | Medium | Large | |||
| de Havilland Comet 2 | 54,000 | Medium | Large | |||
| Boeing 717-200BGW | 50,000 | 46.265 | 1950 | Medium | Large | |
| de Havilland Comet 1 | 50,000 | Medium | Large | |||
| Douglas DC-6A | 48,600 | Medium | Large | |||
| Douglas DC-6B | 48,500 | Medium | Large | |||
| Embraer 190[19] | 48,000 | 43 | 2056 | 1323 | Medium | Large |
| Caravelle III | 46,000 | Medium | Large | |||
| Fokker 100 | 46,000 | 39.95 | 1621 | 1350 | Medium | Large |
| Douglas DC-6 | 44,000 | Medium | Large | |||
| Avro RJ-85 | 42,000 | 36.74 | Medium | Large | ||
| Handley Page Hermes | 39,000 | Medium | Large | |||
| Embraer 175] | 37,500 | 32.8 | 2244 | 1304 | Medium | Large |
| Bombardier CRJ900 | 36,500 | 33.345 | 1778 | 1596 | Medium | Large |
| Embraer 170 | 36,000 | 32.8 | 1644 | 1274 | Medium | Large |
| Bombardier CRJ700 | 33,000 | 30.39 | 1564 | 1478 | Medium | Large |
| Douglas DC-4 | 33,000 | Medium | Large | |||
| Vickers Viscount 800 | 30,400 | Medium | Large | |||
| Bombardier Q400 | 28,000 | 28.01 | 1219 | 1295 | Medium | Large |
| Bombardier CRJ200 | 23,000 | 21.319 | 1918 | 1479 | Medium | Large |
| ATR 72-600 | 22,800 | 22.35 | 1333 | 914 | Medium | Large |
| Saab 2000 | 22,800 | 21.5 | 1300 | Medium | Large | |
| Embraer ERJ 145 | 22,000 | 19.3 | 2270 | 1380 | Medium | Large |
| ATR 42-500 | 18,600 | 18.3 | 1165 | 1126 | Medium | Small |
| Saab 340 | 13,150 | 12.930 | 1300 | 1030 | Medium | Small |
| Embraer 120 Brasilia | 11,500 | 11.25 | 1560 | 1380 | Medium | Small |
| BAe Jetstream 41 | 10,890 | 10.570 | 1493 | 826 | Medium | Small |
| Learjet 75 | 9,752 | 8.709 | 1353 | 811 | Medium | Small |
| Pilatus PC-24 | 8,300 | 7.665 | 893 | 724 | Medium | Small |
| Embraer Phenom 300 | 8,150 | 7.65 | 956 | 677 | Medium | Small |
| Beechcraft 1900D | 7,765 | 7.605 | 1036 | 853 | Medium | Small |
| Cessna Citation CJ4 | 7,761 | 7.103 | 1039 | 896 | Medium | Small |
| de Havilland Hercules | 7,000 | Medium | Small | |||
| Embraer Phenom 100 | 4,800 | 4.43 | 975 | 741 | Light | Small |
2. yes there is an difference between ground speed and air speed: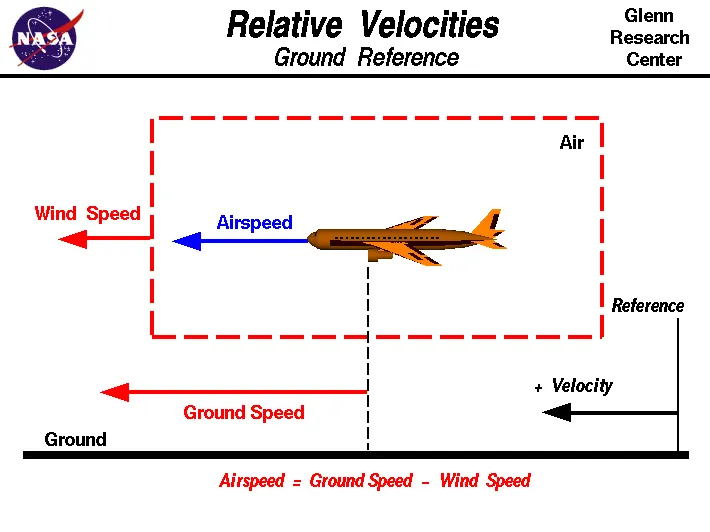
GROUND SPEED:
Ground speed is the horizontal speed of an aircraft relative to the Earth’s surface. It is vital for accurate navigation to the destination that the pilot has an estimate of the ground speed that will be achieved during a flight.
An aircraft diving vertically would have a ground speed of zero. Information displayed to passengers through the entertainment system of airline aircraft usually gives the aircraft ground speed rather than airspeed.
Ground speed can be determined by the vetor sum\ of the aircrd and the current wind speed and direction; a headwind subtracts from the ground speed, while a tailwind adds to it. Winds at other angles to the heading will have components of either headwind or tailwind as well as a crosswind component.
AIR SPEED:
Airspeed
The important quantity in the generation of lift is the relative velocity between the object and the air, which is called the airspeed. Airspeed cannot be directly measured from a ground position, but must be computed from the ground speed and the wind speed. Airspeed is the vector difference between the ground speed and the wind speed.
Airspeed = Ground Speed - Wind Speed
On a perfectly still day, the airspeed is equal to the ground speed. But if the wind is blowing in the same direction that the aircraft is moving, the airspeed will be less than the ground speed.
Examples
Suppose we had an airplane that could take off on a windless day at 100 mph (liftoff airspeed is 100 mph). We are at an airport with an east-west runway that is 1 mile long. The wind is blowing 20 mph towards the west and the airplane takes off going east. The wind is blowing towards the aircraft which we call a headwind. Since we have defined a positive velocity to be in the direction of the aircraft's motion, a headwind is a negative velocity. While the plane is sitting still on the runway, it has a ground speed of 0 and an airspeed of 20 mph:
Airspeed = Ground Speed (0) - Wind Speed (-20) = 20 mph
The airplane starts its take off roll and has a constant acceleration a. From Newton's second law of motion, the ground speed V at any time t is:
V = a * t
and the distance d down the runway at any time is:
d = 1/2 * a * t^2
For a fixed length runway, this specifies the time to be used in the velocity equation. Let's assume that at 5000 feet down the runway, the velocity is 80 mph. Then the airspeed is given by
Airspeed = Ground Speed (80) - Wind Speed (-20) = 100 mph
and the airplane begins to fly. Now another pilot, with exactly the same airplane decides to take off to the west. The wind is now in the same direction as the motion and this is called a tailwind. The sign on the wind speed is now positive, not negative as with the headwind. The acceleration along the ground is the same, so at 5000 feet down the runway, the ground speed is again 80 mph. The airspeed is then given by:
Airspeed = Ground Speed (80) - Wind Speed (20) = 60 mph
This airplane doesn't have enough airspeed to fly. It runs off the end of the runway!
3.
Jet blast effect while taxiing( single ENGINE TAXIING)
There is also a blast effect during taxiing, although it is not as powerful as when the aircraft is taking off. Unlike taking off or landing, taxiing often occurs in the vicinity of passengers, employees and unsecured objects. This can lead to hazardous situations if the blast is too powerful. The risk therefore has to be minimised while starting up the engines and taxiing.
To cut a long story short, to achieve this, most airlines set the maximum thrust percentage at 40% of total capacity per engine during taxiing. Airports are designed to be a safe places to work and visit, but this depends on only 40% of the engine’s thrust being used during taxiing. An aircraft that taxies using both engines can easily keep below that limit. But if you were to turn off one engine, the remaining engine would need to use much more power. Particularly when the aircraft moves away from a standing position, the so-called breakaway thrust would need to exceed the safe level of 40%. So whether or not Single-Engine Taxiing is feasible depends on how difficult it is to get the aircraft moving. If the aircraft is on a gradient, and especially if the aircraft is relatively heavy, there is a higher chance that too much power would be required. This is the reason why Single-Engine Taxiing is used more f
requently by arriving aircraft than departing aircraft. Departing aircraft are heavier because they are fully laden with fuel.
4,
Pushback means the movement of an aircraft from a nose-in parking stand using the power of a specialised ground vehicle attached to or supporting the nose landing gear. It is commonly the second part of a ‘Taxi In Push Out’ (TIPO) procedure at airport terminal gates and will be necessary to depart from all except self manoeuvring parking stands unless the aircraft type is capable of powerback and local procedures allow this. Occasionally, a pushback may need to be followed by an engines-running pull forward to a position where local procedures allow aircraft to move forward under their own power, but usually, ground vehicle disconnection will occur after the completion of a pushback.
The Procedure
Once the aircraft commander (or other person in charge on the flight deck if the aircraft is not in service) has given their confirmation of ‘brakes released’ to the person in charge of the ground crew who are to carry out the pushback, the ground crew become temporarily responsible for the safe manoeuvring of the aircraft in accordance with either promulgated standard procedures or as specifically agreed beforehand.
Unless the manoeuvre is taking place outside the movement area controlled by ATC, an RTF clearance to carry it out will be required. Usually but not always, this will be obtained by the aircraft commander or other person in charge in the flight deck. The prescribed RTF phraseology for pushback is contained in ICAO PANS-ATM.
Formerly, almost all aircraft types required that the ground locking pin be installed in the nose landing gear during any pushback; however, this is now no longer always the case. If a ground locking pin is installed for the pushback, it will need to be removed after the completion of the ground vehicle manoeuvre if the aircraft has been pushed back prior to intended flight.
The ‘traditional’ method of allowing the ground vehicle to move an aircraft is to attach it to the aircraft nose landing gear by means of a towbar. These must be approved for use with a particular aircraft type and clearly marked as such, since there is no universal towbar specification. The same towbar attachment and ground vehicle may also be used for AIRCRAFT TOWERING in the forward direction. An alternative method which is becoming more common for pushback is the use of a specialised vehicle called a ‘towbarless tug’. This positions two low level ‘arms’ either side of the aircraft nose landing gear and these are used to engage with the aircraft gear leg and raise it slightly off the ground. These specialised vehicles can also be used to tow aircraft forward,
Both pushback methods are subject to the observance of any aircraft limits for maximum nose landing gear steering angle, but these are not usually especially restrictive.
The responsibilities of the ground crew team carrying out a pushback include ensuring that no part of the aircraft structure will impact any fixed object or other aircraft and may include giving clearance to start one or more engines just before, during or immediately after a pushback. The number of people assigned to a ground crew team for a pushback may vary according to aircraft size, but in most cases will be at least three. One will be driving the pushback vehicle, one will be walking in the vicinity of one of the aircraft wingtips and looking beyond the aircraft tail and one will be in charge of the manoeuvre and in communication with the person with aircraft responsibility in the flight deck. Communication between the ground crew supervisor is usually by means of a plug in to an aircraft ground intercom circuit; if so, this is facilitated by a ground crew microphone which acquires the voice of the user whilst excluding background noise, which if the aircraft engines are running can be considerable. If only two ground crew are used for pushback of a smaller aircraft then it is important that the procedure takes full account of the roles of each ground crewmember and that the person in charge of ground crew communications on the flight deck is aware of the number of ground crew being used and the physical location of the supervisor.
Effective communication between the person in charge in the flight deck and the person in charge of the ground crew, and between the members of the ground crew team is critical. If the aircraft is being pushed back prior to intended flight and the person in charge of the flight deck is therefore an aircraft commander, the procedures of the aircraft operator may require that the designated pilot, who may be the co pilot, should oversee the pushback and in this case all communications with the ground crew will be undertaken by that person rather than necessarily by the aircraft commander. If it is considered that communication by hand signals rather than intercom is acceptable then it is essential that the applicable procedures are comprehensive and thoroughly understood by both parties and that they cover all possible abnormal and emergency circumstances.
The case of engines-running pull forward as a supplementary action prior to ground vehicle disconnection after a pushback should be considered as part of the pushback procedure and trained accordingly since it bears little practical resemblance to the towing for longer distances of empty out-of-service with engines stopped.
Engine Starts may be routinely accomplished immediately before or during pushback. Where they are carried out when the aircraft is moving, it is essential that the ground crew supervisor does not allow the checks and communication required in connection with engine starting to interfere with their primary responsibility to control the pushback and remain in full communication with those on the flight deck using the means available. Many aircraft operators require that when push back is accomplished without headset communications, engine starts do not take place whilst the aircraft is being pushed, preferring instead to require that engine starting takes place before or after completion of the pushback. Observations of abnormal circumstances in connection with engine starts or any other matter affecting, or potentially affecting the safety of the aircraft during a pushback are of great importance to those on the flight deck but it is essential that any descriptions of external observations during engine starts are imparted accurately; this may sometimes be demanding using ground intercom but can be extremely difficult with only hand signals available.
The key threat to aircraft safety
If damage is caused to the aircraft on pushback, or to another aircraft by the aircraft on pushback, this must be identified and technically assessed before that aircraft flies. Unfortunately, this is not always the case. It is important to recognise that when part of one aircraft impacts part of another aircraft, the degree of resultant damage may vary between negligible and major, even if the aircraft are identical. Ground Crews must be effectively briefed on this as well as other aspects of the operation. This is especially important when the ground crew are not employed directly by the aircraft operator or if they do not speak the same language fluently for operational communications.
Risk Management
The evidence of accidents and incidents is that there are a number of recurrent features of aircraft damage during pushback:
- Use of hand signals rather than intercom communication,
- Lack of intercom clarity in communications between the aircraft and the ground crew supervisor,
- Ground crew totalling less than three people,
- Departure from non-airbridge gates,
- Failure of vehicle driver to maintain adequate communication with supervisor,
- Lack of clearance between horizontal stabilisers of adjacent ‘T’ tail aircraft,
- Pushback commenced from a parking position different from that marked,
- Ground crew poorly trained or unfamiliar with the immediate pushback environment,
- Unserviceable towbars attributable to lack of ownership clarity,
- Surface contamination obscuring pavement markings.
Accidents and Incidents
The following events in the SKYbrary database occurred during Pushback:
- A320, Bristol UK, 2019 (On 23 March 2019, the crew of a fully-loaded Airbus A320 about to depart Bristol detected an abnormal noise from the nose landing gear as a towbarless tug was being attached. Inspection found that the aircraft nose gear had been impact-damaged rendering the aircraft no longer airworthy and the passengers were disembarked. The Investigation noted that tug driver training had been in progress and that the tug had not been correctly aligned with the nose wheels, possibly due to a momentary lapse in concentration causing the tug being aligned with the nose leg rather than the nose wheels.)
- A332, Karachi Pakistan, 2014 (On 4 October 2014, the fracture of a hydraulic hose during an A330-200 pushback at night at Karachi was followed by dense fumes in the form of hydraulic fluid mist filling the aircraft cabin and flight deck. After some delay, during which a delay in isolating the APU air bleed exacerbated the ingress of fumes, the aircraft was towed back onto stand and an emergency evacuation completed. During the return to stand, a PBE unit malfunctioned and caught fire when one of the cabin crew attempted to use it which prevented use of the exit adjacent to it for evacuation.)
- ATP, Jersey Channel Islands, 1998 (On 9 May 1998, a British Regional Airlines ATP was being pushed back for departure at Jersey in daylight whilst the engines were being started when an excessive engine power setting applied by the flight crew led to the failure of the towbar connection and then to one of the aircraft's carbon fibre propellers striking the tug. A non standard emergency evacuation followed. All aircraft occupants and ground crew were uninjured.)
- B738 / B738, Toronto Canada, 2018 (On 5 January 2018, an out of service Boeing 737-800 was pushed back at night into collision with an in-service Boeing 737-800 waiting on the taxiway for a marshaller to arrive and direct it onto the adjacent terminal gate. The first aircraft’s tail collided with the second aircraft’s right wing and a fire started. The evacuation of the second aircraft was delayed by non-availability of cabin emergency lighting. The Investigation attributed the collision to failure of the apron controller and pushback crew to follow documented procedures or take reasonable care to ensure that it was safe to begin the pushback.)
- B738, London Stansted UK, 2008 (On 13 November 2008, a Boeing 737-800 with an unserviceable APU was being operated by Ryanair on a passenger flight at night was in collision with a tug after a cross-bleed engine start procedure was initiated prior to the completion of a complex aircraft pushback in rain. As the power was increased on the No 1 engine in preparation for the No 2 engine start, the resulting increase in thrust was greater than the counter-force provided by the tug and the aircraft started to move forwards. The towbar attachment failed and subsequently the aircraft’s No 1 engine impacted the side of the tug, prior to the aircraft brakes being applied.)
- B738, Singapore, 2015 (On 6 December 2015, a Boeing 737-800 was being manoeuvred by tug from its departure gate at Singapore to the position where it was permitted to commence taxiing under its own power when the tug lost control of the aircraft, the tow bar broke and the two collided. The Investigation attributed the collision to the way the tug was used and concluded that the thrust during and following engine start was not a contributory factor. Some inconsistency was found between procedures for push back of loaded in-service aircraft promulgated by the airline, its ground handling contractor and the airport operator.)
- B742, Stockholm Arlanda Sweden, 2007 (On 25 June 2007, a Boeing 747-200F being operated by Cathay Pacific on a scheduled cargo flight from Stockholm to Dubai had completed push back for departure in normal daylight visibility and the parking brakes had been set. The tow vehicle crew had disconnected the tow bar but before they and their vehicle had cleared the vicinity of the aircraft, it began to taxi and collided with the vehicle. The flight crew were unaware of this and continued taxiing for about 150 metres until the flight engineer noticed that the indications from one if the engines were abnormal and the aircraft was taxied back to the gate. The tow vehicle crew and the dispatcher had been able to run clear and were not injured physically injured although all three were identified as suffering minor injury (shock). The aircraft was “substantially damaged” and the tow vehicle was “damaged”.)
- B752 / CRJ7, San Francisco CA USA, 2008 (On 13 January 2008, a Boeing 757-200 and a Bombardier CL-600 received pushback clearance from two adjacent terminal gates within 41 seconds. The ground controller believed there was room for both aircraft to pushback. During the procedure both aircraft were damaged as their tails collided. The pushback procedure of the Boeing was performed without wing-walkers or tail-walkers.)
- B763 / A320, Delhi India, 2017 (On 8 August 2017, a Boeing 767-300 departing Delhi was pushed back into a stationary and out of service Airbus A320 on the adjacent gate rendering both aircraft unfit for flight. The Investigation found that the A320 had been instructed to park on a stand that was supposed to be blocked, a procedural requirement if the adjacent stand is to be used by a wide body aircraft and although this error had been detected by the stand allocation system, the alert was not noticed, in part due to inappropriate configuration. It was also found that the pushback was commenced without wing walkers.)
Takeoff is the phase of flight in which an aerospace vehicle leaves the ground and becomes airborne. For aircraft traveling vertically, this is known as liftoff.
takeof and landing performance
For every takeoff and landing which we carry out, we run a performance calculation to ensure that it is safe to do so. A large part of this is based on the braking effectiveness.
On takeoff, we have to calculate the point at which it is no longer safe to stop. This speed, V1, marks the point after which we must continue to get airborne, no matter what the problem is.

The calculation of this speed is based mainly on the ability of the aircraft to stop. If the runway is slippery or a brake unit is inoperative, it will take a greater distance to stop. As a result, the V1 speed will be much slower than in normal dry conditions. This means that we will reach that speed sooner and there will be more runway remaining on which to stop.
The performance on landing isn’t normally as restrictive. The aircraft is a lot lighter having used most of its fuel in flight and we are touching down at the start of the runway. This gives the brakes much more distance to bring the lighter weight aircraft to a safe stop.
For aircraft that take off horizontally, this usually involves starting with a transition from moving along the ground on a runway. For ballons, helicopter and some specialized fixed-wing aircraft (VTOL aircraft such as the Harrier), no runway is needed.
>vertical takeoff
>horizontal takeoff
Horizontal takeoff
Power settings
For light aircraft, usually full power is used during takeoff. Large transport category (airliner) aircraft may use a reduced power for takeoff, where less than full power is applied in order to prolong engine life, reduce maintenance costs and reduce noise emissions. In some emergency cases, the power used can then be increased to increase the aircraft's performance. Before takeoff, the engines, particularly piston engines, are routinely run up at high power to check for engine-related problems. The aircraft is permitted to accelerate to rotation speed (often referred to as Vr). The term rotation is used because the aircraft pivots around the axis of its main landing gear while still on the ground, usually because of gentle manipulation of the flight controls to make or facilitate this change in aircraft attitude (once proper air displacement occurs under / over the wings, an aircraft will lift off on its own; controls are to ease that in).
The nose is raised to a nominal 5°–15° nose up pitch attitude to increase lift from the wings and effect liftoff. For most aircraft, attempting a takeoff without a pitch-up would require cruise speeds while still on the runway.
Operations with transport category aircraft employ the concept of the takeoff V-speeds: V1, VR and V2. These speeds are determined not only by the above factors affecting takeoff performance, but also by the length and slope of the runway and any peculiar conditions, such as obstacles off the end of the runway. Below V1, in case of critical failures, the takeoff should be aborted; above V1 the pilot continues the takeoff and returns for landing. After the co-pilot calls V1, they will call VR or "rotate," marking speed at which to rotate the aircraft. The VR for transport category aircraft is calculated such as to allow the aircraft to reach the regulatory screen height at V2 with one engine failed. Then, V2 (the safe takeoff speed) is called. This speed must be maintained after an engine failure to meet performance targets for rate of climb and angle of climb.
In a single-engine or light twin-engine aircraft, the pilot calculates the length of runway required to take off and clear any obstacles, to ensure sufficient runway to use for takeoff. A safety margin can be added to provide the option to stop on the runway in case of a rejected takeoff. In most such aircraft, any engine failure results in a rejected takeoff as a matter of course, since even overrunning the end of the runway is preferable to lifting off with insufficient power to maintain flight.
If an obstacle needs to be cleared, the pilot climbs at the speed for maximum climb angle (Vx), which results in the greatest altitude gain per unit of horizontal distance travelled. If no obstacle needs to be cleared, or after an obstacle is cleared, the pilot can accelerate to the best rate of climb speed (Vy), where the aircraft will gain the most altitude in the least amount of time. Generally speaking, Vx is a lower speed than Vy, and requires a higher pitch attitude to achieve.
Vertical takeoff
Vertical takeoff refers to aircraft or rockets that take off in a vertical trajectory. Vertical takeoff eliminates the need for airfields. Most vertical take off aircraft are also able to land horizontally, but there were certain rocket-powered aircraft of the Luftwaffe that only took off vertically, landing in other ways. The Bachem Ba 349 Natter landed under a parachute after having taken off vertically. Other late Third Reich projects, such as the Heinkel P.1077 Julia or the Focke-Wulf Volksjäger 2, climbed to their ceiling at a nearly vertical angle and landed later on a skid.
VTOL
Vertical take-off and landing (VTOL) aircraft include fixed-wing aircraft that can hover, take off and land vertically as well as helicopters and other aircraft with powered rotors, such as tiltrotors.Some VTOL aircraft can operate in other modes as well, such as CTOL (conventional take-off and landing), STOL (short take-off and landing), and/or STOVL (short take-off and vertical landing). Others, such as some helicopters, can only operate by VTOL, due to the aircraft lacking landing gear that can handle horizontal motion. VTOL is a subset of V/STOL (vertical and/or short take-off and landing).
Besides the helicopter, there are two types of VTOL aircraft in military service: craft using a tiltrotor, such as the Bell Boeing V-22 Osprey, and some aircraft using directed jet thrust such as the Harrier family.
TYRE DESIGN
Design and Construction of Aircraft tyre
Carcass plies are used to form the tire. They are sometimes called casing plies. An aircraft tyre is constructed for the purpose it serves.
- They support the weight of an aircraft while it is on the ground.
- It also provides the necessary traction for braking and stopping of an aeroplane.
- Tyre also helps to absorb the shock of landing and provide cushioning the roughness of takeoff, roll-out, and taxi operations.
Unlike an automobile or truck tyre, it does not have to carry a load for a long period of continuous operation. However, an aircraft tyre absorbs the high impact loads of landing, and also it’s operating at high speeds for a short time when required.
Retreading – Retreading is methods of restoring a worn tyre by renewing the tread area or by renewing the tread area plus one or both sidewalls. Repairs are included in the tyre retreading process.
Load Rating – Load rating is the maximum permissible load at a specified inflation pressure.
Ply Rating – Ply Rating is used to identify the maximum recommended load rating and inflation pressure for a specified tyre. It is an index of tyre strength.
Speed Rating – The speed rating is the maximum takeoff speed to which the tyre has been tested.
Skid Depth – Skid depth is the distance between the tread surface and the deepest groove as measured in the mould.
Aircraft tyres must have an approved speed and load rating and have sufficient clearance when retracted through landing gear to allow for tyre growth. Tyre growth is the increase in the size of the tyre due to centrifugal forces at high speed.
Aircraft tyres may be Tube-type or Tubeless
Tubeless tyres are more advantageous over tube-type. There is no longer the use of tube-type tyre in recent aviation. Nowadays all airliners are using tubeless tyres. Tubeless that are meant to be used without a tube has the word TUBELESS on the sidewall of the tyre.
Designing aircraft tires is a very intense undertaking. Once an aircraft manufacturer goes to the tire manufacturer with the size and weight requirements, the tire manufacturer begins the process of designing a tire that meets the needs of the aircraft manufacturer as well as all regulatory requirements — including foreign regulations in many cases.
Engineers are challenged with designing tires with cool running, heat-resistant materials while simultaneously exceeding tire service requirements. Tire prototypes are put through rigorous tests that simulate cycles of landings, take-offs, and taxi operations. It is only after the tires pass all mandatory tests and meet the requirements of the aircraft manufacturer and airworthiness authorities that the tires are put into production.
Two types of tires are used in aircraft applications — bias-ply tires and radial tires. Although both types of tires share some similarities in design, there are differences that need to be noted.
Bias-ply tire construction
A cutaway of a typical bias-ply tire is shown in Figure 1. Bias-ply tires are popular choices for aircraft tires because of their durability and retreadability. The tire construction consists of the following components:
Tread: The tread is made of rubber mixed with other additives to obtain the desired level of toughness, durability, and resistance to wear. The tread pattern is designed to aircraft operational requirements, with the ribbed tread design used widely due to its good traction under varying runway conditions.
Sidewall: The sidewall is a protective layer of rubber that covers the outer casing ply. It extends from the tread edge to the bead area.
Tread Reinforcing Ply: One or more layers of fabric that strengthens and stabilizes the tread area for high-speed operation. It also serves as a reference for the buffing process when tires are retreaded.
Buff Line Cushion: The buff line cushion is made of rubber compound to enhance the adhesion between the tread reinforcing ply and the breakers or casing plies. It is of sufficient thickness to allow for the removal of the old tread when the tire is retreaded.
Breakers: Breakers are reinforcing plies of rubber-coated fabric placed under the buff line cushion to protect casing plies and strengthen and stabilize the tread area. They are considered an integral part of the casing construction.
Casing Plies: Alternate layers of rubber-coated fabric (running at opposite angles to one another) provide the strength of the tire.
Wire Beads: Hoops of high tensile strength steel wire that anchor the casing plies and provide a firm mounting surface on the wheel. The outer edge of the bead that fits against the wheel flange is called the bead heel. The inner bead edge is called the bead toe.
Apex Strip: A wedge of rubber affixed to the top of the bead bundle.
Flippers: Layers of rubberized fabric that help anchor the bead wires to the casing and improve the durability of the tire.
Ply Turnups: The casing plies are anchored by wrapping them around the wire beads, thus forming the ply turnups.
Chafer: A protective layer of rubber and/or fabric located between the casing plies and wheel to minimize chafing.
Liner: In tubeless tires, the liner is a layer of low permeability rubber that acts as a built-in tube and restricts gas from diffusing into the casing plies. In tube-type tires, a thinner liner is used to prevent tube chafing against the inside ply.
Radial-ply tire construction:r
A typical radial tire is illustrated in Figure 2. With their rigid belt, they provide increased landings and reduced rolling resistance. They have fewer components in their construction and are lighter than similarly sized bias ply tires. Components that differ from bias-ply construction as follows:
Overlay: A layer of reinforcing rubber coated fabric placed on top of the belts to aid in high speed operation.
Belt Plies: A composite structure that stiffens the tread area for increased landings. The belt plies increase the tire strength in the tread area.
Casing Plies: As in bias-ply tires, the casing plies are layers of rubber-coated fabric. However, unlike those in bias plies that run at opposite angles to one another, radial plies run radially from bead to bead.
Chippers: The chippers are layers of rubber-coated fabric applied at diagonal angles that improve the durability of the tire in the bead area.
Tire inspection
In order to ensure safety and increase tire life, systematic inspections of mounted tires should be performed. A word of warning — Never probe cracks, cuts, or embedded foreign objects while the tire is inflated! Serious injuries could result. In addition, defects such as cuts, cracks, and bulges should be marked with a crayon or chalk prior to deflation since the defects may disappear when the tire is deflated. The following should be checked:
Tread wear: Treads should be visually inspected for wear. The tire should be replaced when tread has worn to the base of any groove at any spot or to a minimum depth specified in the aircraft maintenance manual. Tread wear can also be an indication of improper tire inflation. Refer to Figure 3 for tread wear indications.
Tread cuts: The tire should be inspected for cuts and other foreign damage. Follow the criteria from the applicable aircraft maintenance manual. If no specific criteria is outlined in the manual, the following can be used for guidance in determining tread cuts:
BRAKING
Stopping a 200-tonne aircraft landing at 180 mph requires a lot of braking force. To do this, the 787 has one brake unit on each of the eight wheels on the main gear assembly. On other aircraft types, the brake units are powered by the hydraulics system. An electrical signal is sent from the flight deck to hydraulic actuators near the main landing gear. Here, hydraulic fluid at 3,000 pound per square inch is used to force the brake unit against the wheel, thus slowing it down.
This system works fine, but the pipes and actuators that form this part of the hydraulic system come at a considerable weight cost. Extra weight means more fuel burn, which in turn increases costs and carbon emissions. What if the brakes could be powered a different way?

That’s the case on the 787 Dreamliner. Designers did away with the use of the hydraulic system and all its associated architecture and instead used electricity to power the brakes. When the pilots press on the brake pedals, an electrical signal is sent to the brake unit on the wheel. Here, electrically powered actuators are used to press the carbon brake disc against the wheel, slowing it down.
By changing to electric brakes, a 787-8 saves 141 pounds per aircraft and a 787-9 saves 245 pounds. The brakes are also known as “plug and play” because electrical wiring replaces the traditional hydraulics and it’s much easier and quicker to change the brake units when needed. Smart features also allow engineers to monitor the brake performance more closely, giving a real-time measurement of wear on the carbon disks.
Electric brakes
The brake system on the 787 Dreamliner is controlled by the pilots pressing the tops of the rudder pedals under their feet, demanding the rate of braking which they require. This sends an electronic signal to the Left and Right Brake System Control Units (BSCUs).
These then send signals to the four Electronic Brake Actuator Controllers (EBAC) which control the rate of braking on the wheels. Each wheel has four Electric Brake Actuators (EBA), a kind of piston which presses against the carbon brake discs.
Read more: What are the strange noises and sensations you experience on a flight?

The brake disks themselves are made up of two parts. Firstly, there are the rotors. These are connected to the wheel by drive tabs (in the video below they are the black rectangles on the rotor disks). As these drive tabs are in contact with the inside of the wheel, they spin at the same speed. Depending on the brake manufacturer, there are either four or five of these rotors on each brake assembly.
The second part of the disks are the stators. These sit around each rotor and are fixed in place and thus don’t move. As the wheel turns, the rotors spin round inside the stators.
When the brakes are applied, the four EBAs apply pressure to the first stator. This in turn squeezes the stationary stators up against the spinning rotors and it’s this friction which slows the wheel down. https://www.youtube.com/watch?v=n0nXiQPwHE8
Anti-skid protection
When landing on slippery runways, there’s a chance that the wheels may start to skid as the brakes are applied. To stop this from happening and to maintain maximum effective braking, each wheel has anti-skid protection.
Using a variety of sources to determine the aircraft speed, the brake units know how fast the wheels should be spinning. If that speed drops significantly, it’s because the current brake pressure on that wheel is too great and the wheel is just skidding over the surface.
In this situation, the anti-skid system automatically reduces the braking on that wheel to a point where the skid stops before reapplying the pressure. All this is done in a fraction of a second.
Autobrake
Pressing on the brakes is pretty straight forward when taxiing in a straight line at low speed. However, when we’re landing in strong winds, it can be a little tricky. We need to use our feet on the rudder pedals to line the nose of the aircraft up with the runway centerline at the last moment. Then, whilst holding that position, slide our feet up to press the toe brakes. Really not very easy when moving at 160 mph.
To help us get the braking underway as soon as we touch down, we have the autobrake system.This provides automatic braking at a preselected rate as soon as the aircraft senses that it is on the ground. It also provides full braking pressure in the case of a rejected takeoff if the speed is above 85 knots (98 mph).
Brake temperature indication
With friction comes heat. As a result, each brake unit displays its temperature on the wheel synoptic page in the flight deck. Here, numerical values relating to brake temperature are shown next to each wheel. A value of 0-4.9 is in the normal range. When a temperature becomes 5.0 or above, an advisory message is displayed to the pilots.
Should the brakes become too hot, there’s a chance that the heat transferred to the wheels could cause the tires to explode. To stop this from happening, when a certain temperature is reached, fuse plugs in the tires melt. This allows the air to be released safely and slowly deflate the tires.
Parking brake
Every so often we need to engage the brakes and keep them on. This is particularly useful on long taxis to the runway and obviously when parked at the gate. The park brake is set by fully pressing down both toe brakes and pulling the parking brake lever up. With this set, we can then release the pressure from the pedals. To release, we just press the brake pedals again.
A helping hand
In addition to the brakes, there are two other systems which help slow the aircraft down on landing. The spoilers and the reverse thrust.
Spoilers
Have you noticed the large panels on the top of the wings raise up on touch down? These are the called the spoilers as they literally spoil the airflow over the wing. This dumps any remaining lift the wings are generating, allowing the wheels to take all the weight and achieve maximum efficiency from the brakes.
Reverse thrust
The final part of the braking process comes from reverse thrust. Just after we have touched down, we pull two levers on top of the thrust levers to engage the reverse thrust, a sort of “reverse gear” for jet engines.
This causes blockers inside the engine to deploy and a door in the side of the engine to slide backward. The air which normally leaves the engine out the back is deflected forward by the blockers and out through the door.
Read more: 10 years of the Dreamliner — why pilots love flying the 787 https://www.youtube.com/watch?v=NBFM8yCBqa4
There are two stages of reverse thrust — idle reverse and max reverse. Idle reverse is used on most landings and max reverse is used when the landing performance requires it, normally when the aircraft is landing at hot or high elevation airfields.
This forward directed airflow helps slow the aircraft down but is most efficient at high speeds. If using max reverse, we drop this down to idle reverse at 60 knots (70 mph) and then back to normal thrust as we vacate the runway at around 20 knots (25 mph).
6,types of force:
aerodynamic force.
rolling resistance force.
BRAKING FORCE
rolling resistance =u*m*g
g=9.81 m/s
for aircraft m=36000kg,u=0.02
Frr (aircraft)=u*m*g=36000*0.02*9.81=7082 N
for pushback truck m=1000kg,u=0.09
Frr(pushback)=u*m*g=1000*0.09*9.81=883 N
Total rolling resistance =7082+883=7915 N
AERODYNAMIC FORCE=0.5*P*A*Cd*V^2;
f ad=0.5*1.22*6.8*8=53.1 N
fnet=313920+53.1+max brake force=7915+53.1+800=8767.1 N
power =F*v (velocity where truck pulls the airplane)
power=8767.1*9.72=85.28 Kw
7,
Methodology Effective HEV design requires optimising the choice of mechanical and electrical components to meet the vehicle’s get dynamic performance with the longest
S. Cash et
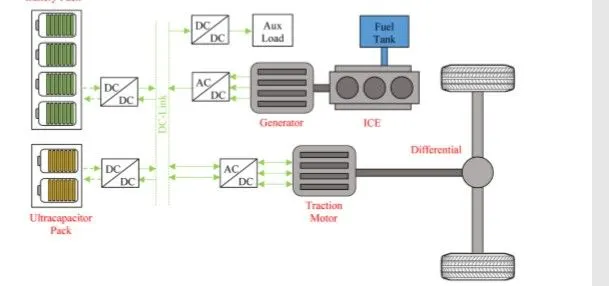
Figure 1. Conventional series HEV powertrain topology showing the main components required.
driving range possible [18]. Numerous design iterations are often deliberated to ensure the mechanical and electrical parameters of the system allow the vehicle to achieve its target performance objectives. Part of the iterative process also requires compromising between other vehicle constraints such as the unloaded performance, cost, and component size. The pushback vehicle must be able to generate a large towing tractive force, but also have a relatively high top speed to travel quickly between pushback operations (~30 kph unloaded). The airport regulations and aeroplane manufacturers require that the tug must be able to generate a minimum tractive force for each aeroplane weight class the tug is designated to tow, an example of the tractive force requirements for a Boeing 737-7 is referenced . Therefore a suitable combination of traction motor, transmission ratios and final drive ratios should be used to meet these regulations. As the mass of the conventional pushback vehicle is already very large, the additional mass of a battery pack which would normally be a constraint in the vehicle design is not of concern for this application. The iterative design process for this vehicle was separated into two areas; finding appropriate mechanical components that will allow the vehicle to achieve its target longitudinal dynamics and the electrical storage/generation parameters that would allow the vehicle to fulfil its mission. The mechanical components under investigation include specifying a traction motor with appropriate torque-speed characteristics, final drive ratio and transmission ratios. The vehicle dynamics iterations target was to enable the vehicle achieve a performance comparable to the ICE equivalent vehicle. The vehicle dynamics of the hybrid vehicle must be comparable to the ICE to be a viable equivalent for customers. The electrical components under investigation include battery pack capacity, battery pack peak power outputs, genset size, and genset control methods.
A Fuzzy Logic (FL) speed controller was used to control the speed of the conventional pushback vehicle model and the HEV model which attempts to follow a target velocity profile by generating appropriate accelerator [ ] 0,1acc γ ∈ and brake pedal [ ] 0,1brk γ ∈ activation levels [20]. The membership functions for the FL speed controller are given in Table 1 and the rule base is given in Figure 2. This controller uses the longitudinal velocity error x V∆ (1) between the target velocity x V∗ and the instantaneous velocity x V at time t as the first input and its time derivative as the second input to generate a suitable pedal activation level. An input range of ±5 kph in Figure 2(a) is used for the controller’s first input xV∆ because this offers the best trade-off between a low steady-state velocity error and control realism. Reducing this input range improves the steady-state error of the vehicle, but it also results in erratic pedal control. The second input range ±20 kph/s in Figure 2(b) for the time derivative of x V∆ is used because 20 kph/s approaches the acceleration ability of high performance sports vehicles (0 - 60 mph time ≈ 4.8 s). Most typical drivers would accept ±20 kph/s to be a large acceleration value. A controller output with a magnitude 1 indicates that the accelerator or brake pedal is fully activated. Positive speed controller outputs represent accelerator pedal activation levels and negative outputs represent brake pedal activation levels. An accelerator pedal activation level corresponds to the driver requesting a motor torque output to either accelerate the vehicle or maintain a steady cruising speed. ( ) ( ) ( ) * xxx V t V t V t ∆=− (1) A vehicle model created in MATLAB/Simulink contains the basic forces acting upon the vehicle. The tractive force Traction F at the road-wheel interface (2), the rolling resistance Rolling F of the tyres (3), the aerodynamic drag Aero F (4) and the brake force Brake F (5) are all included in the model
PM fd T fd
Traction
NN
F
R τη = (2)
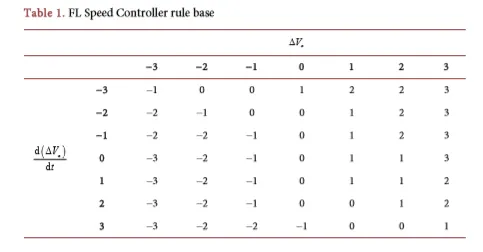
Figure 2. FL speed controller membership functions, (a) Input 1: x V∆ , (b) Input 2:
d xV t ∆ , (c) Output: Pedal movement.
( ) Rolling Veh Aero r F M M gf = + (3) 21 2 Aero D air x f F C A V ρ = (4)
maxBrake brk B FF γ −= (5) The tractive force requires the output torque from the prime mover PM τ , gear ratio of the final drive fd N , transmission ratio T N , their combined efficiency
Tfd η
and the wheel’s rolling radius R . As the vehicle under investigation is an aeroplane pushback vehicle, the mass of the aeroplane Aero M is included in (3) to account for the additional rolling resistance from the aeroplane. Removal of AeroM allows this vehicle model to be used for conventional passenger vehicle simulations. The aerodynamic drag force Aero F requires the frontal area of the vehicle f A , coefficient of aerodynamic drag D C and the density of the air air ρ . The combined brake force Brake F uses a linear relationship between the brake pedal activation level brk γ and the maximum brake force available to the road-wheel conditions max BF − . The effective additional towing mass of the vehicle r M (6) is dependent on the rotational inertias of the prime mover PM I ,
transmission T I , final drive Fd I and the wheels Wh I [17]. The longitudinal acceleration x a of the vehicle is then calculated using (7), and the rotational speed of the prime mover PM ω is then calculated using (8) [17].
Details of the parameters of the existing vehicle are shown in Table 2. It uses an IC engine with the torque-speed profile provided in Table 3, along with a final drive ratio and three gear ratios T N . Gear ratio 1 is used for the towing operation, gear ratio 2 is used for the maintenance runs, and gear ratio 3 is used for the unloaded solo runs. These gears cannot change while the vehicle is moving
Table 2. Vehicle parameters of the typical ICE powered pushback vehicle to be converted into a HEV.
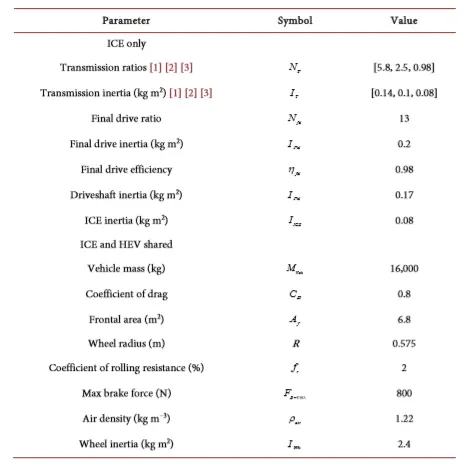
Table 3. ICE Speed-Torque characteristics for the conventional aeroplane pushback vehicle.
Speed (rpm) 600 700 900 1100 1300 1500 1900 2300 2500
Torque (Nm) 595 630 741 864 987 990 932 915 830
and must be set before the operation begins. The ICE is accompanied by a fuel consumption map as shown in Figure 3 and a series of emissions maps shown in Figure 4 which show the CO, NOx, PM, Hydrocarbons (HC) and fuel consumption
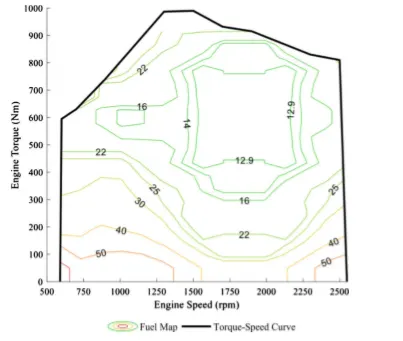
Figure 3. Convention ICE powered pushback vehicle torque-speed curve and fuel map (L/hr).
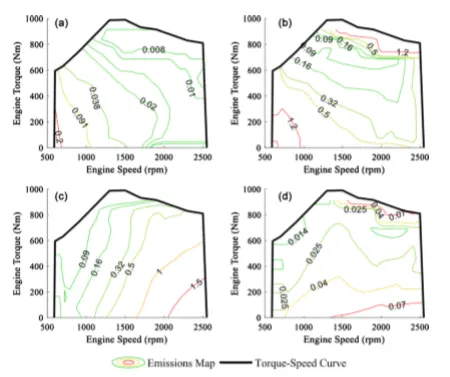
Figure 4. Convention ICE powered pushback vehicle emissions maps, (a) Hydrocarbons (HC) (g/s), (b) Carbon Monoxide (CO) (g/s), (c) Nitrous Oxides (NOx) (g/s), (d) Particulate Matter (PM)
for each operating point and allow the vehicle model to predict the engine’s emissions over the duty cycle. A traction motor typically has a continuous operating region and an overcurrent region as shown in Figure 5. The continuous operating region limits the motor’s supply current to prevent overheating. The overcurrent region permits a larger supply current for a short amount of time to permit a higher torque output. As this increases the rate of temperature increase, this zone can only be utilised for a short period of time. The time period for overcurrent is usually publically available from motor suppliers. The rate of change in temperature using this model is estimated using the position of the output motor torque [ ] 0,1 τδ ∈ between the peak continuous torque ( ) Cm τω and the peak overcurrent torque ( ) Om τω . A diagrammatical view of how τδ is obtained is shown in Figure 5 where ( ) ( ) 12 mm ττ δ ω δ ω > . This model is based on the overcurrent-tolerant prediction model developed by the authors [17]. When the driver of the vehicle model activates the accelerator pedal [ ] 0,1acc γ ∈ , the motor model initially attempts to access the overcurrent torque curve, wherePM O = in (9). For a series-HEV or pure EV, the torque will be fully accommodated by the traction motor. For a parallel or power-spit HEV, the fraction of the command torque required to be supplied by the traction motor will take the role of the required output torque in (9). ( ) ( ) , PM m acc acc PM m τ ω γ γ τ ω = (9) where , PM O C = . An efficiency map can be used to find the motor’s electrical power consumption at each point on the torque-speed curve using Equation (10). The tug also has a high auxiliary power demand from providing power to the aeroplane’s air conditioning during pushback operations, warning lights, heating, and ventilation to the cabin. It is assumed that the auxiliary power would be constant throughout the duty cycle to indicate a worst case scenario.
( ) , PM PM e PM PM τω η ω τ
(10)
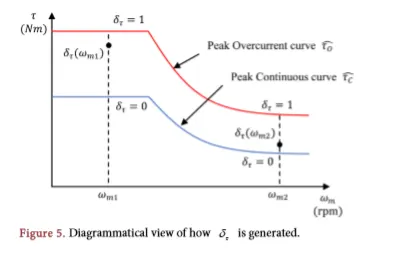
Figure 5. Diagrammatical view of how τδis generated.
The torque-speed characteristics of an ICE are simulated in a similar method to the simplified traction motor models using Equation (9) by replacing PM ICE = or via an equivalent throttle map. The full load torque-speed curve of the traction motors are now representative of the ICE peak torque-speed curve ICE τ and the efficiency maps of Equation (10) are replaced by the ICE’s fuel consumption and tailpipe output emissions maps. The APU is defined by numerous criteria including; output power (kW), fuel consumption (L/hr) and output emissions (g/s). These parameters are integrated over time to produce the total fuel consumption, total output emissions and total energy provided by the APU. The electrical storage/generation is based around the State of Energy (SOE) of the battery pack and the net power of the DC link. The net DC link power is integrated to represent the energy supply/demand of the battery pack and is added to the battery pack’s initial energy at the start of the duty cycle. The battery SOE control uses a relay system which at its core revolves around upper and lower SOE limits to turn on/off the generator. The genset provides electrical power to the DC link to directly power the traction motor or charge the battery pack. The genset can only operate in one of 3 ways; full power, idle and off. During full power operation the genset consumes fuel at its rated value, when at idle the fuel consumption is reduced. Idle mode aids in the warm-up and cool-down of the genset to prolong longevity. The electrical power required for pushback operations is larger than what most battery packs can provide, therefore the genset must be turned on during pushback operations to provide additional power to the DC link. For the hybrid aeroplane tug to truly be comparable with the ICE counterpart, the battery pack SOE should be at the upper limit by the end of the duty cycle. This is analogous to the ICE tug having the fuel tank filled at the end of the working day. Therefore, once the last pushback operation of the duty cycle is completed, the genset will turn on to begin charging the battery pack while the tug returns to the overnight storage area. The genset will remain on until the SOE reaches the upper limit where all auxiliary power can then be turned off. Duty cycle data was recorded from the conventional ICE powered pushback vehicle (engine speed, output torque, longitudinal velocity, etc.) via the CAN bus. This data was used to construct a target duty cycle for the HEV to follow. The pushback vehicle’s duty cycle, obtained from several days’ actual operation in the field, is broken down into four major areas as shown in Table 4 and explained as follows: • Low velocity pushback operations of heavy aircraft. This scenario occurs when the pushback vehicle is required to move aeroplanes away from the airport terminal. • Medium velocity towing operations of medium weight aircraft. This represents a maintenance run where the pushback vehicle tows an empty aeroplane for a longer duration across an airfield to receive routine maintenance.
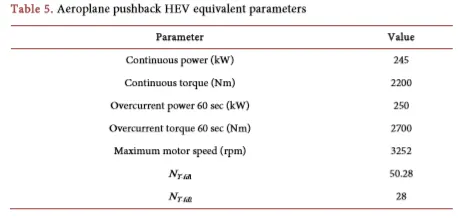
• High velocity unloaded solo runs. Here the pushback vehicle is travelling back and forth between resting areas where it must wait until the next operation. • Stationary resting periods. Here the vehicle is waiting for its next pushback operation. All hazard warning lights must remain on as the vehicle is still on the operating airfield. 3. Results The final tug design parameters are given in Table 5 where a single large traction motor using a 2-speed transmission was used. The torque-speed curves for this motor and an efficiency map based on a 9-phase 245 kW IM is shown in Figure 6 [23]. A high gear ratio 1 T fdN − is used during towing and maintenance operations as it achieves the minimum tractive force requirement. A low gear ratio 2 T fdN − was chosen for unloaded solo runs which allows the vehicle to reach its top unloaded speed. The traction motor’s torque-speed output throughout the duty cycle is shown of Figure 7 in relation to the chosen traction motor’s torque curves. This particular traction motor and gear ratio combination is oversized for the current duty cycle allowing room for future expansion of aeroplane weight class compatibility. It can be seen that the required torque does not exceed the motor’s continuous torque curve, enabling the traction motor to repeat the duty cycle operations indefinitely without the risk of overheating the electrical components. The results in Figure 8 show that the dynamic and electrical performance conditions of the hybrid aeroplane tow vehicle have been met.
Table 4. Pushback operation descriptions for the typical ICE vehicle and the HEV equivalent.
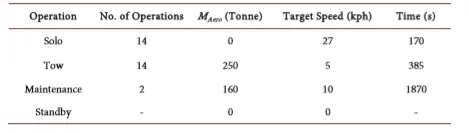
Table 5. Aeroplane pushback HEV equivalent parameters
DUTY CYCLE
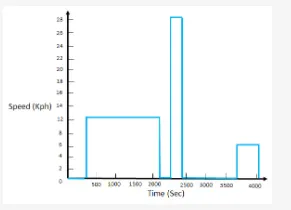
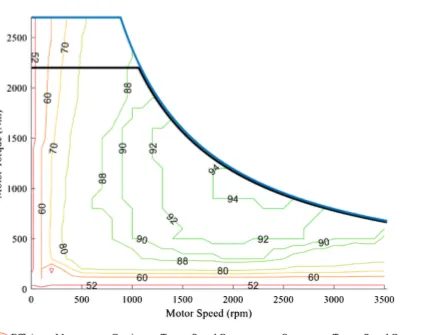
Figure 6. Torque Speed curves and efficiency map (%) for the traction motor used in HEV pushback vehicle.
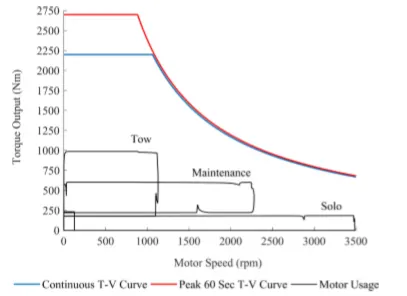
Figure 7. Traction motor usage over the duty cycle.
The hybrid vehicle’s dynamic profile is comparable to the target ICE counterpart, the battery SOE remains within safe working limits and the genset does not turn on/off rapidly throughout the duty cycle. The blue shaded areas of Figure 8 show that the genset is providing full power to the DC-Link and that the traction motors are fully utilising this power during towing operations with the surplus power demand coming from the battery pack. The yellow shaded regions show that the genset provides full power to the DC-Link and the battery pack is being charged.
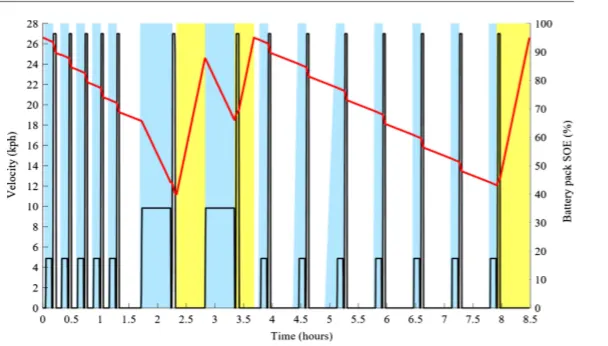
Figure 8. Velocity profile and battery pack SOE over the complete duty cycle.
Table 6. Aeroplane pushback vehicle powertrain configuration energy requirement and fuel consumption comparison.
Powertrain configuration Energy required (kWh) Fuel consumed (L) Difference (%) ICE - 189.7 - HEV Configuration 2 261 91.22 51.9%
only used 91.22 L of fuel over the duty cycle compared to the 189.7 L used by the ICE vehicle, i.e. 51.9% reduction, as shown in Table 6. Assuming that the genset provided a similar reduction in engine emissions, the total volume of CO, NOx, PM, and HC’s at the end of the duty cycle was also reduced. 4. Conclusion This paper presented some of the design and modelling methods for a series hybrid conversion for an aeroplane pushback tug with comparable performance to the previous ICE counterpart. The design constraints of this vehicle were discussed along with their effect on the final vehicle design. The HEV equivalent managed to meet the target dynamic requirements and remained within the electrical operational boundaries. The final vehicle design proved to be overpowered for this application as the regulatory requirements had overruled the optimal design, but left room for future compatibility with larger aeroplanes. The hybrid vehicle reduced fuel consumption by around 52% over the ICE equivalent vehicle, reducing the overall fuel costs with an equivalent reduction in engine emissions. The vehicle is currently undergoing validation experiments where the vehicle is challenged with following similar duty cycle operations to

the ones investigated in this paper. The main constraint in this design is the regulatory requirement which overruled the optimal design. Future studies will focus on the use of an ultra-capacitor to enable the battery capacity to be reduced to save costs as well as an energy recovery system to improve the efficiency of the powertrain.
FROM THE ABOVE PARAMETER
AERODYNAMIC FORCE=0.5*P*A*Cd*V^2;
f ad=0.5*1.22*6.8*8=53.1 N
frr=u*m*g=2*16000*9.81=313920 N
fnat=313920+53.1+max brake force=313920+53.1+800=314773 N
CONCLUSION:
power = F*V =314773*4=1259KW
maximum torque on wheels = 0.575*314773=180kNm