Project 1 _Parsing NASA thermodynamic data using MATLAB
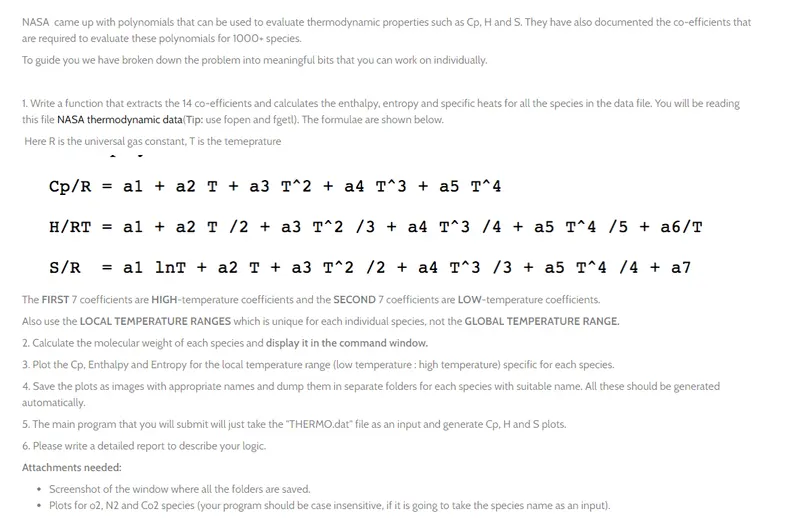
Project Description:
Main Code:
% Writing the program to extract 14 co-efficient & calculate specific heat,
% entropy & enthalpy for all the species provided in the data file.

% Objective:
% 1. Extract all 14 coefficient & calculate specific heat, entropy &
% enthalpy for all the species
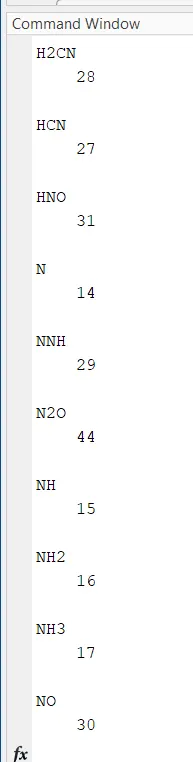
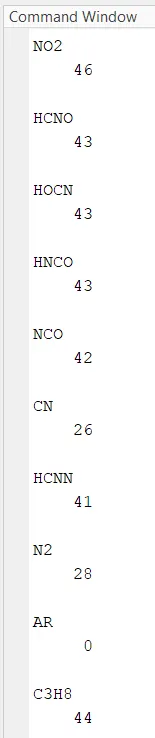
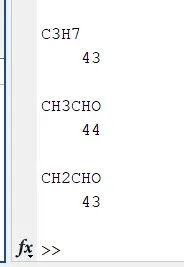
% 2. Calculate the molecular weight of each species & displaying their
% molecular weight in the command window
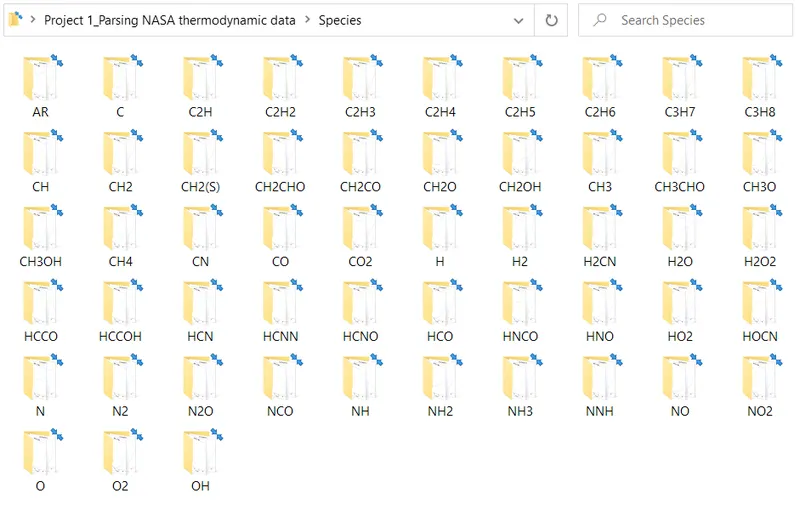
% 3. Saving all plots as images in the specific folder

% Inputs: NASA Thermodynamic Data & equations to calculate specific heat,
% entropy & enthalpy.
% Equations:

% In 14 coefficients, first 7 are for high temperature & the rest 7 are for
% low temperature.

close all
clear all
clc

% Inputs
R = 8.3144; % R = Universal Gas Constant (J/(mol.K))

% Opening data file
f1 = fopen('thermo.dat','r');

% Extracting the first line of the file
fgetl(f1);

% Extracting temperature range from the 2nd line
A = fgetl(f1);
% Spliting temperature stored in the string
global_temp = strsplit(A);
% Extracting & storing each temperature value in different variable
g_temp_low = str2double(global_temp{2});
g_temp_mid = str2double(global_temp{3});
g_temp_high = str2double(global_temp{4});

% Creating temperature range
temp_range = linspace(g_temp_low, g_temp_high,500);

% Comments Lines
for i = 1:3
    com = fgetl(f1);
end

% Extracting Species from the data file
for j = 1:53
    species_line = fgetl(f1); % Extracting first line of each species group
    species_name = species_line(1:6); % Extracting species name

    tline1 = fgetl(f1); % reading first line of coefficient
    a = strfind(tline1, 'E'); % Searching for location of 'E'
    % Extracting coefficient from first line
    coeff1 = str2double(tline1(1:a(1)+3));
    coeff2 = str2double(tline1(a(1)+4:a(2)+3));
    coeff3 = str2double(tline1(a(2)+4:a(3)+3));
    coeff4 = str2double(tline1(a(3)+4:a(4)+3));
    coeff5 = str2double(tline1(a(4)+4:a(5)+3));

    tline2 = fgetl(f1);
    % Extracting coefficient from second line
    coeff6 = str2double(tline2(1:a(1)+3));
    coeff7 = str2double(tline2(a(1)+4:a(2)+3));
    coeff8 = str2double(tline2(a(2)+4:a(3)+3));
    coeff9 = str2double(tline2(a(3)+4:a(4)+3));
    coeff10 = str2double(tline2(a(4)+4:a(5)+3));

    tline3 = fgetl(f1);
    % Extracting coefficient from third line
    coeff11 = str2double(tline3(1:a(1)+3));
    coeff12 = str2double(tline3(a(1)+4:a(2)+3));
    coeff13 = str2double(tline3(a(2)+4:a(3)+3));
    coeff14 = str2double(tline3(a(3)+4:a(4)+3));

    % Calculating Specific Heat(Cp), Entropy(S) & Enthalpy(H) for the low & high
    % temperature coefficients
    % High Temperature Coefficients - coeff1 to coeff7
    % Low Temperature Coefficients - coeff8 to coeff14

    if temp_range < g_temp_mid
        Cp = R.*(coeff1 + coeff2.*temp_range + coeff3.*(temp_range.^2)+ ...
            coeff4.*(temp_range.^3) + coeff5.*(temp_range.^4));

        H =  R.*(coeff1 + coeff2.*(temp_range)/2 + coeff3.*(temp_range.^2)/3+ ...
            coeff4.*(temp_range.^3)/4 + coeff5.*(temp_range.^4)/5 + ...
            coeff6./temp_range);

        S = R.*(coeff1.*log(temp_range) + coeff2.*temp_range + coeff3.*(temp_range.^2)/2+ ...
            coeff4.*(temp_range.^3)/3 + coeff5.*(temp_range.^4)/4 + coeff7);

    else
        Cp = R.*(coeff8 + coeff9.*temp_range + coeff10.*(temp_range.^2)+ ...
            coeff11.*(temp_range.^3) + coeff12.*(temp_range.^4));

        H =  R.*(coeff8 + coeff9.*(temp_range)/2 + coeff10.*(temp_range.^2)/3+ ...
            coeff11.*(temp_range.^3)/4 + coeff12.*(temp_range.^4)/5 + ...
            coeff13./temp_range);

        S = R.*(coeff8.*log(temp_range) + coeff9.*temp_range + coeff10.*(temp_range.^2)/2+ ...
            coeff11.*(temp_range.^3)/3 + coeff12.*(temp_range.^4)/4 + coeff14);
    end

    % Making current directory to save plots as images
    cd('C:UsersBLACKROSEDesktopProject 1_Parsing NASA thermodynamic dataSpecies')
    cd(species_name)

    % Plotting
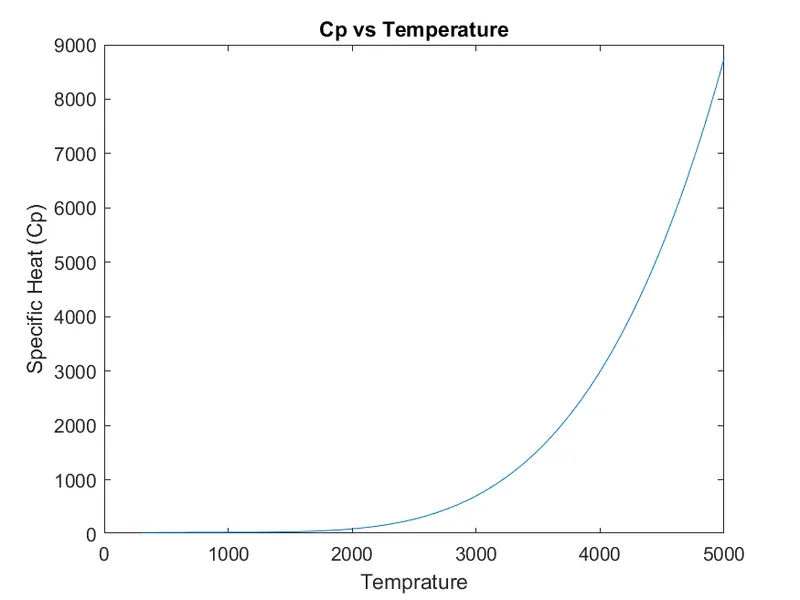
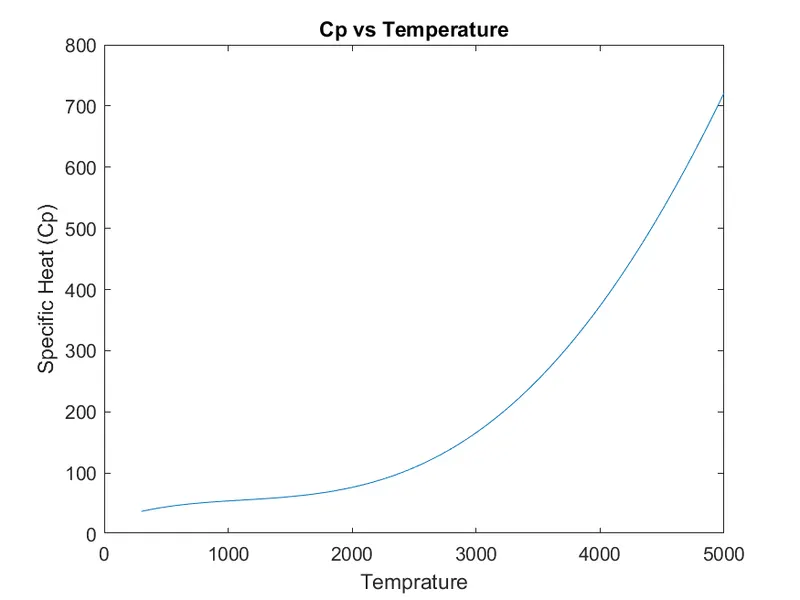
    figure(1) % For Specific Heat (Cp)
    plot(temp_range,Cp)
    xlabel('Temprature')
    ylabel('Specific Heat (Cp)')
    title('Cp vs Temperature')

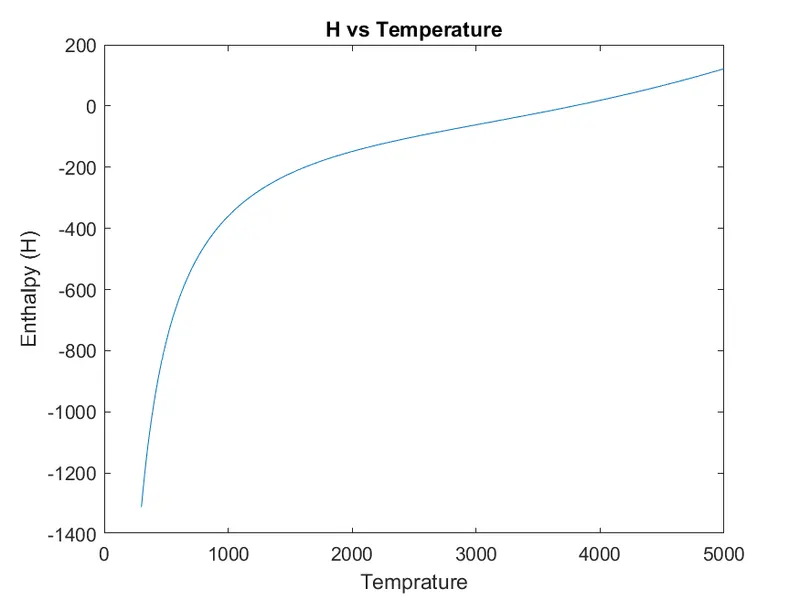
    figure(2) % For Enthalpy (H)
    plot(temp_range,H)
    xlabel('Temprature')
    ylabel('Enthalpy (H)')
    title('H vs Temperature')

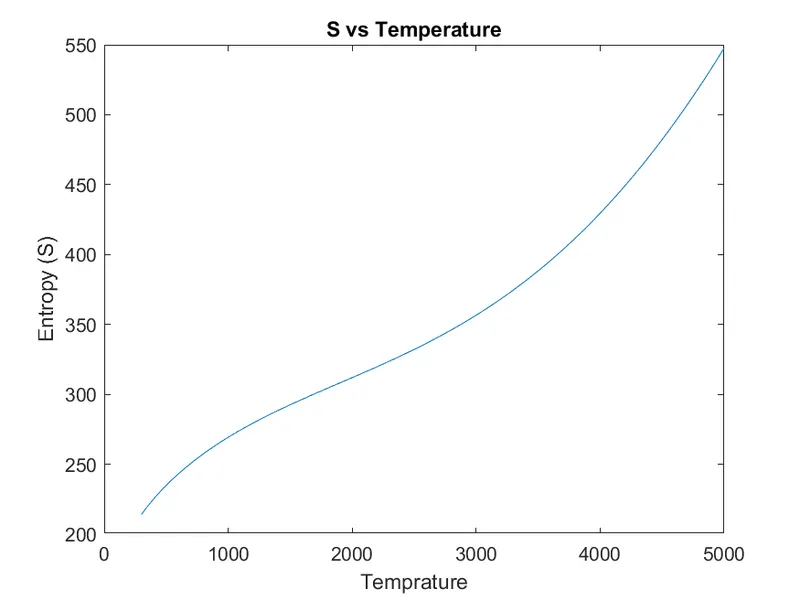
    figure(3) % For Entropy (S)
    plot(temp_range,S)
    xlabel('Temprature')
    ylabel('Entropy (S)')
    title('S vs Temperature')


    % Saving plots as images
    saveas(figure(1),'Cp.png') % For Specific Heat (Cp)
    saveas(figure(2),'H.png') % For Enthalpy (H)
    saveas(figure(3),'S.png') % For Entropy (S)

    % Changing Current Directory to program directory
    cd('C:UsersBLACKROSEDesktopProject 1_Parsing NASA thermodynamic data');

    % Calculating Molecular Weight of the Species
    m = molecular_weight(species_name);
    disp(species_name) % Displaying species name in the command window
    disp(m) % Displaying molecular weight of the species

    % Saving each Species' molecular weight in text file
    % Creating text file
    write = fopen('molecular_weight_data.txt','a');
    % Writing molecular weight data
    fprintf(write,'%s = %f n',species_name, m);
    % Closing the text file
    fclose(write);

end
fclose(f1); % Closing the data file
Function code:
function m = molecular_weight(species_name)

% Writing function for molecular weight calculation for NASA Thermodynamic
% Data parsing project

% Species, Ar = Argon, C = Carbon, H = Hydrogen, O = Oxygen, N = Nitrogen
sp = {'Ar'; 'C'; 'H'; 'O'; 'N'};
mass = [40 12 1 16 14]; % Atomic Mass (g/mol)

m = 0;
% Calculating molecular weight of each species
for i = 1:length(species_name)
    for j = 1:length(sp)
        if strcmp(species_name(i),sp(j)) % Comparing strings
            m = m + mass(j);
            k = j;
        end
    end
    l = str2double(species_name(i)); % Converting string to double precision values
    if l>1
        m = m + mass(k)*(l-1);
    end

end

end
Results:
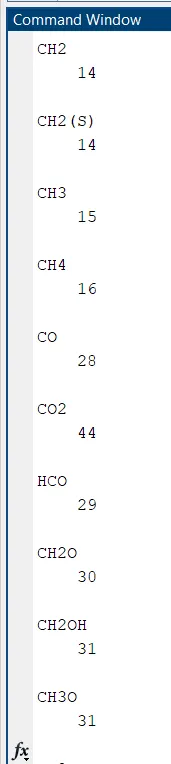
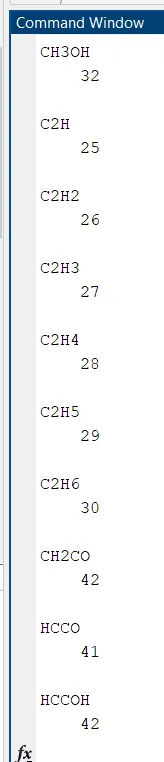
1. Screenshots of the command window

2. Plots
2.1 O2
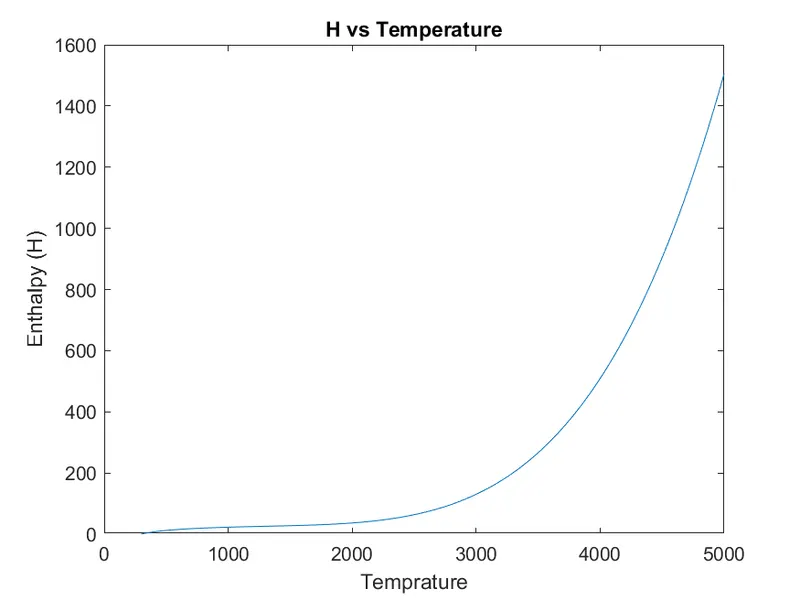
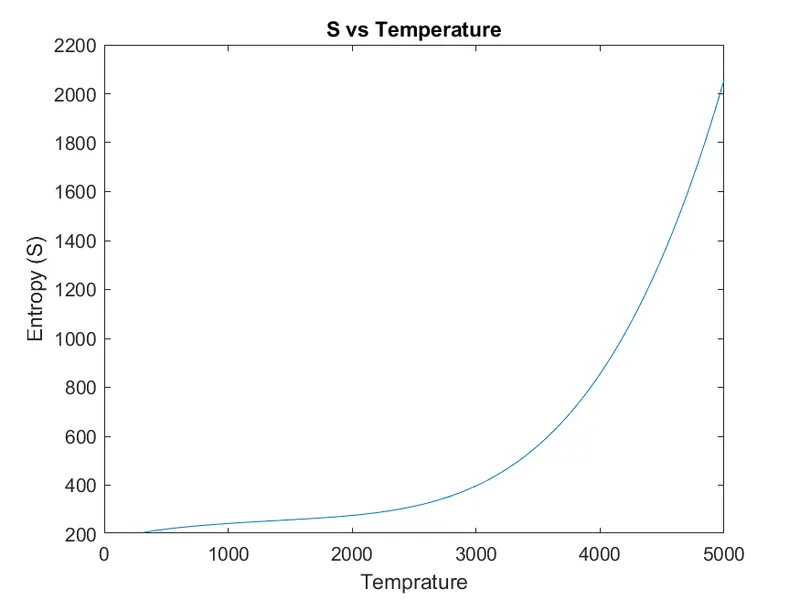
2.2 N2
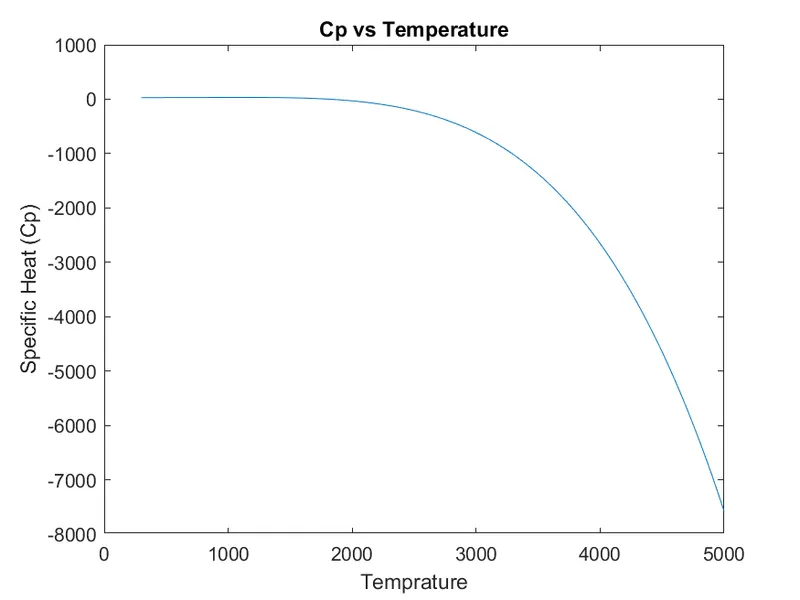
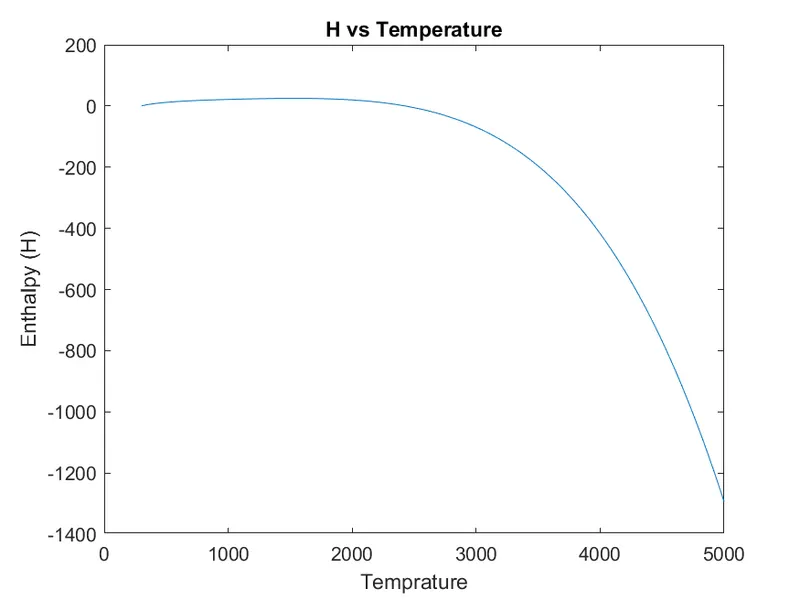
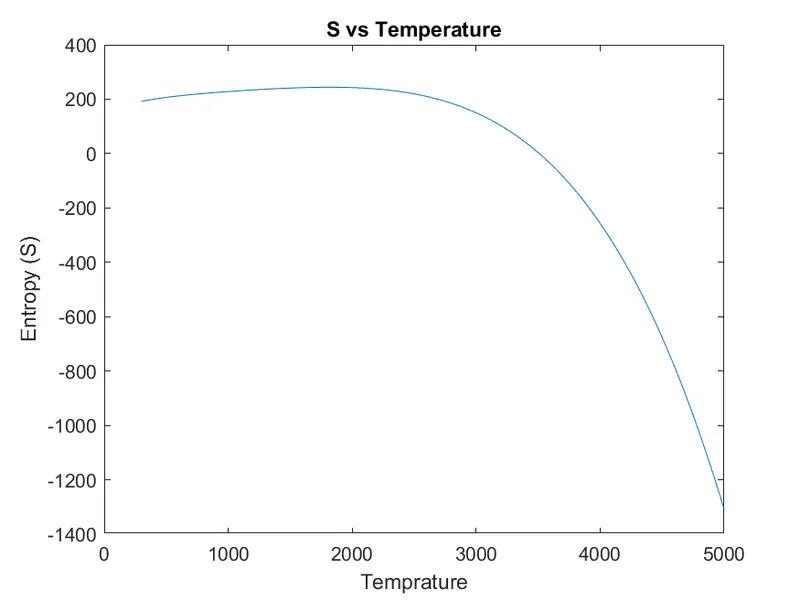
2.3 Co2
3. Floder Screenshot
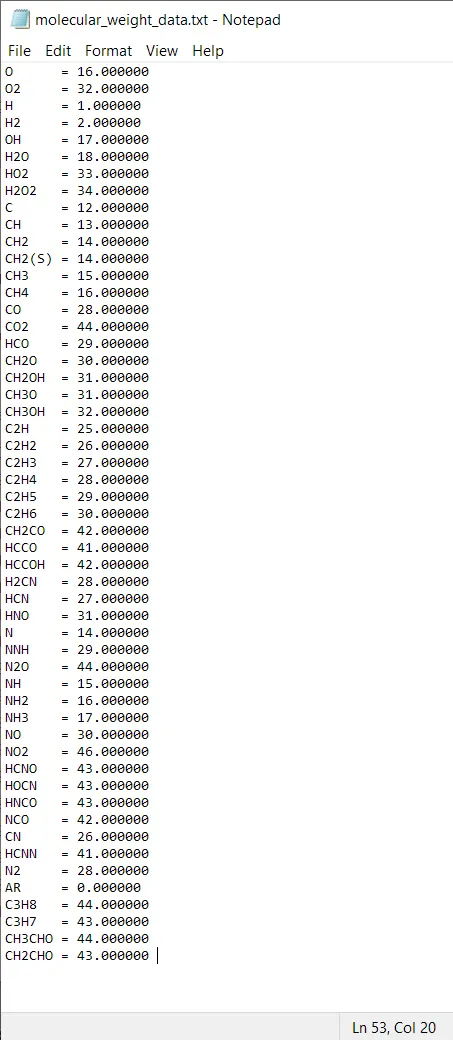
4. Screenshot of the Text File