Project 1 - Parsing NASA thermodynamic data
- First of all clear all memory and close all plots and vanish workspace. And start timer to count total programm evaluation time.
close all clear all clc tic; - Load data file from which we have to extract data using fopen command. Also open file in read mode and save it in a variable.
% Open Data file in read mode TF = fopen("THERMO.dat",'r'); - First of all we have to get total number of species which file has. For that use while loop with condition of word is matching with END. Words of line are getting using fgetl command. It can write a line in variable. After condition match loop terminate and we get total number of lines. To get number of species we have to substitute 6 because there is 6 extra lines 5 at top and 1 at last. After that divide it using 4 because every species data contains 4 line. By doing this we get exact number of species.
% total number of species no = 0; L = 0; while strcmp(L,'END')==0 no = no+1; L = fgetl(TF); end num_species = (no-6)/4; - If we use fgetl command then it will show blank value becaue we already load data to get spieces number. So, we have to start program from home, for that use frewind command.
% Get back to home position frewind(TF); - Now get file name using fgetl command and store in a variable.
% Getting file name File_name = fgetl(TF) - Next line in data is Global temprature line. To get that line use fgetl and store in variable. After that convert that line from string to number using str2num command. It converts in 1*3 array. Then define value of temprature in different variable.
% Getting Global Temprature and convert it into string to number GT = fgetl(TF); Global_temp = str2num(GT); Global_low_temp = Global_temp(1); Global_mid_temp = Global_temp(2); Global_high_temp = Global_temp(3); - Run fgetl command three times to skip unwanted 3 line data.
% Skipping three unwawnted line X = fgetl(TF); X = fgetl(TF); X = fgetl(TF); - Define for loop from 1 to total number of species to get our outputs individuallly.
- Under this for loop first we get a line of local temprature data line. So, get that line using fgetl. It is string value so, we have to split it using strsplit command from space. After splitting it consist of varibale name and local temprature. So, give value to different variable using array index. ANd get local temprature.
% Get data line for first species and split it and same for others for i = 1:num_species a = fgetl(TF); b = strsplit(a,' '); species_name = (b{1}); local_low_temp = str2num(b{end-3}); local_mid_temp = str2num(b{end-1}); local_high_temp = str2num(b{end-2}); - To define constant c, we have to read line by line using fgetl command. After getting data line of constants, we have to split separately to get variable datas. For that we have to find E in string using findstr command. After getting values of E at different places, define variable by using data range from start to position of E + 3. We get all 14 coefficients.
% Defining co-efficient L1 = fgetl(TF); d1 = findstr(L1,'E'); c1 = str2num(L1(1:d1(1)+3)); c2 = str2num(L1(d1(1)+4:d1(2)+3)); c3 = str2num(L1(d1(2)+4:d1(3)+3)); c4 = str2num(L1(d1(3)+4:d1(4)+3)); c5 = str2num(L1(d1(4)+4:d1(5)+3)); L2 = fgetl(TF); d2 = findstr(L2,'E'); c6 = str2num(L2(1:d2(1)+3)); c7 = str2num(L2(d2(1)+4:d2(2)+3)); c8 = str2num(L2(d2(2)+4:d2(3)+3)); c9 = str2num(L2(d2(3)+4:d2(4)+3)); c10 = str2num(L2(d2(4)+4:d2(5)+3)); L3 = fgetl(TF); d3 = findstr(L3,'E'); c11 = str2num(L3(1:d3(1)+3)); c12 = str2num(L3(d3(1)+4:d3(2)+3)); c13 = str2num(L3(d3(2)+4:d3(3)+3)); c14 = str2num(L3(d3(2)+4:d3(3)+3)); - Define temprature range to caalculate value of Cp, H, S using linspace command. And write value of R.
TR = linspace(local_low_temp,local_high_temp,2500); R = 8.3145; - In next step, we have 14 coefficient out of it, 7 for lower temprature and other 7 for higher temprature. So, we use mid local temprature as pivot point. For that use while loop with this two different temprature condition. And count value of CP, H, S. This loop is run under for local temprature loop TR.
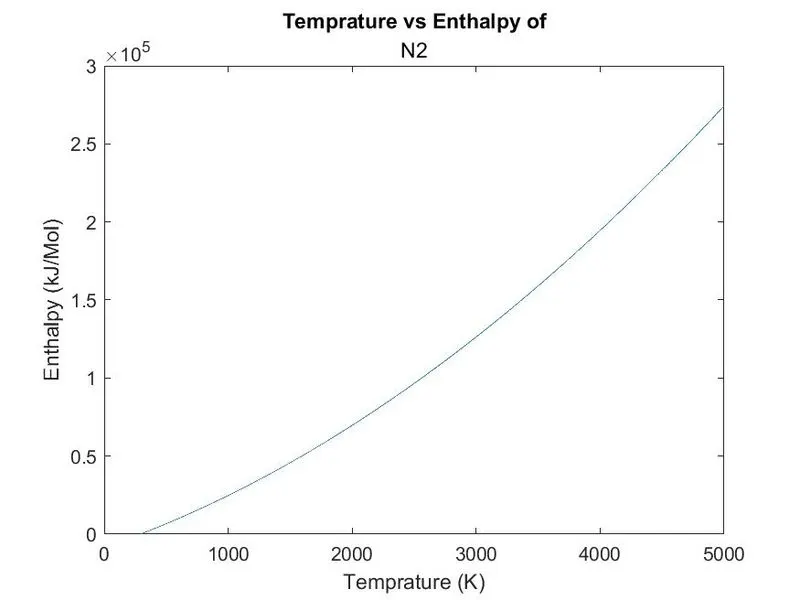
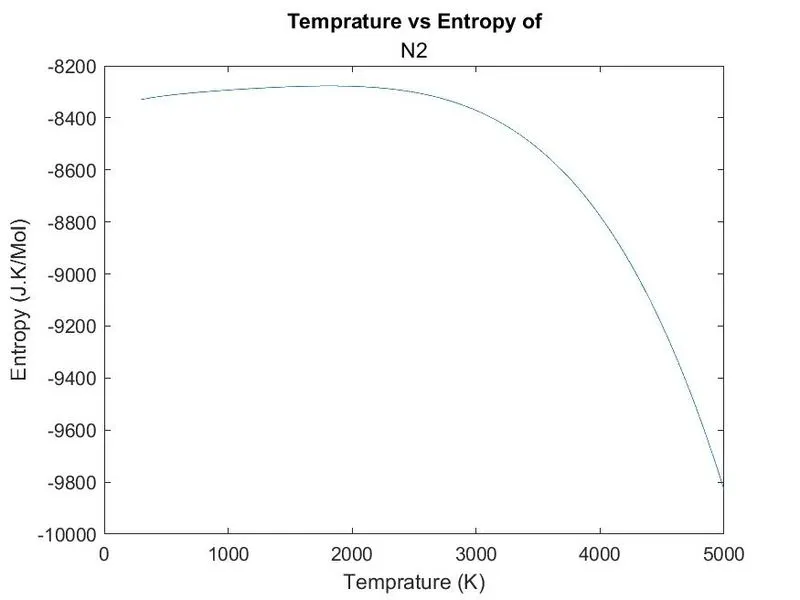
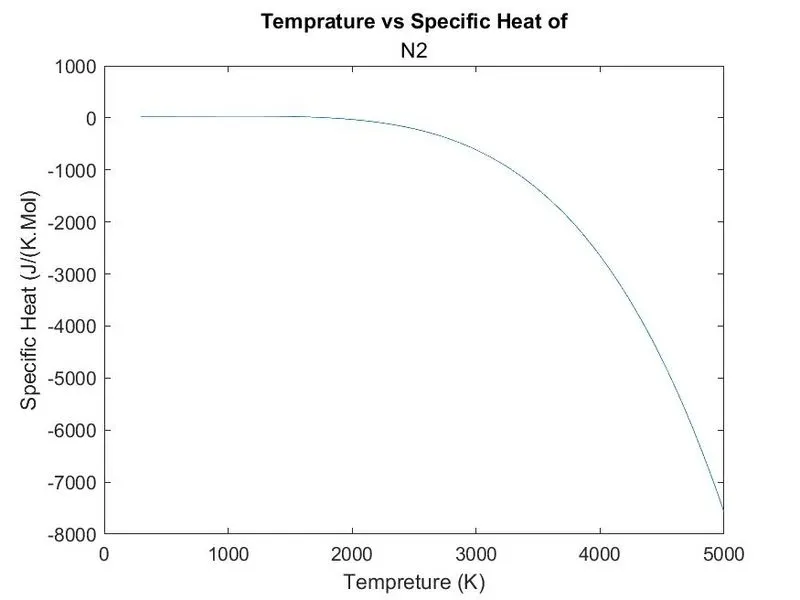
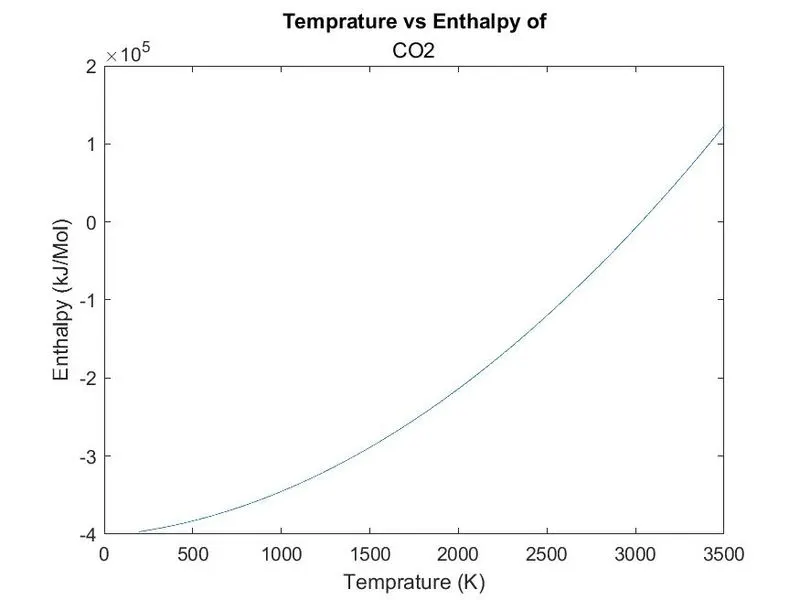
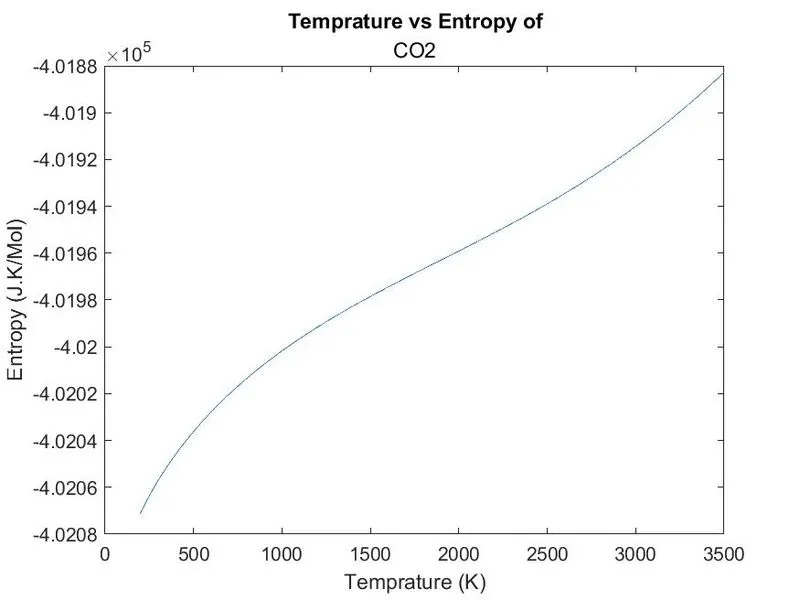
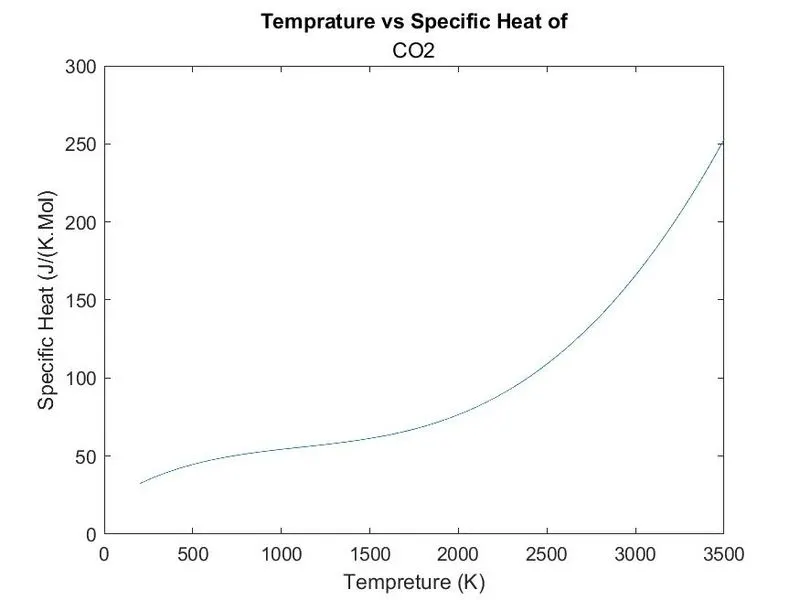
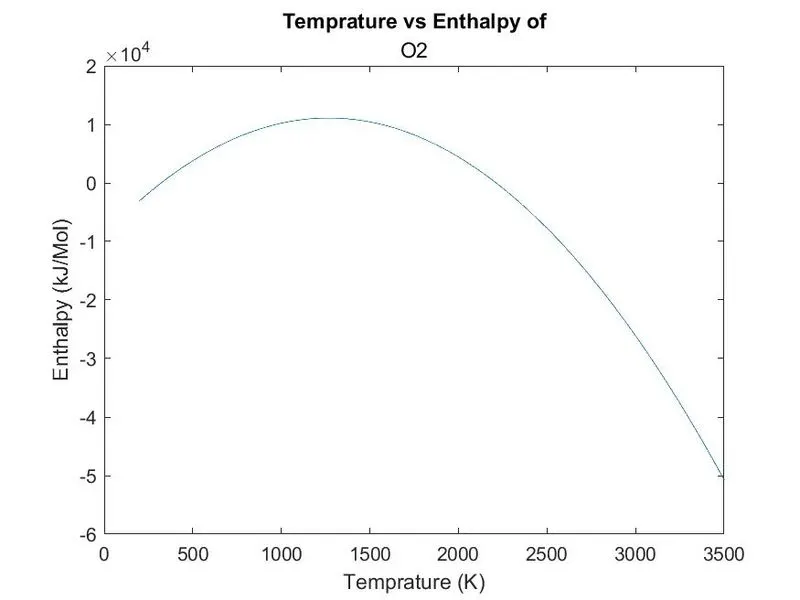
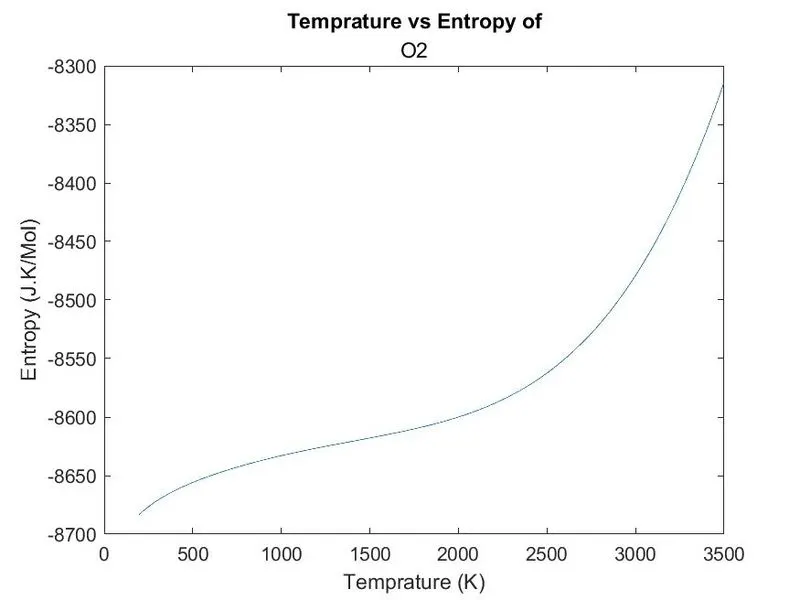
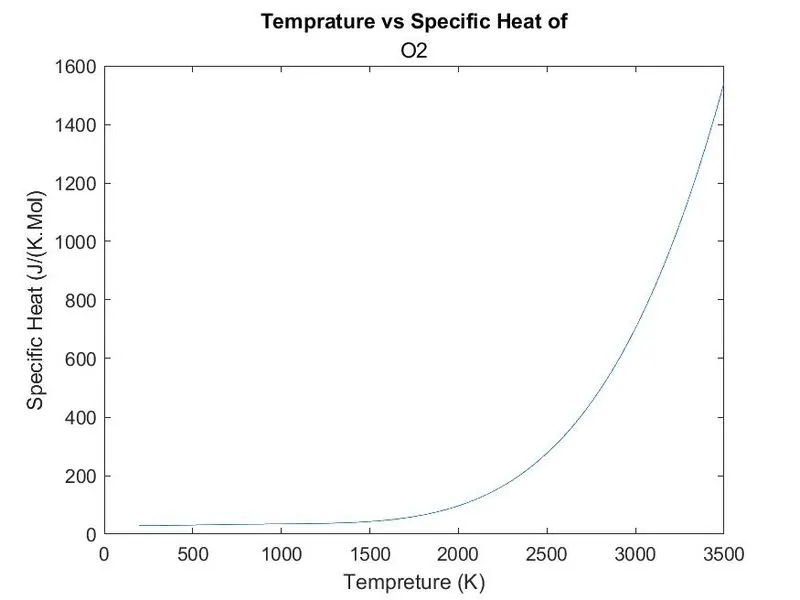
for j = 1:length(TR) if TR > local_mid_temp Cp(j)= R * (c1 + c2*TR(j) + c3*TR(j)^2 + c4*TR(j)^3+ c5*TR(j)^4); H(j) = R*TR(j)*(c1+ c2*TR(j)/2+c3*TR(j)*2/3+c4*TR(j)*3/4+c5*TR(j)*4/5+c6/TR(j)); S(j) = R *(c1*log(TR(j))+c2*TR(j)+c3*TR(j)^2/2+c4*TR(j)^3/3+c5*TR(j)^4/4+c7); else Cp(j)= R * (c8 + c9*TR(j) + c10*TR(j)^2 + c11*TR(j)^3+ c12*TR(j)^4); H(j) = R*TR(j)*(c8+ c9*TR(j)/2+c10*TR(j)*2/3+c11*TR(j)*3/4+c12*TR(j)*4/5+c13/TR(j)); S(j) = R *(c8*log(TR(j))+c9*TR(j)+c10*TR(j)^2/2+c11*TR(j)^3/3+c12*TR(j)^4/4+c14); end end Plot graphs in Figure 1 for Cp, Figure 2 for H and Figure 3for S. And give labels and titles.figure(1); plot(TR,Cp); xlabel('Tempreture (K)'); ylabel('Specific Heat (J/(K.Mol)'); title('Temprature vs Specific Heat of',species_name); figure(2); plot(TR,H); xlabel('Temprature (K)'); ylabel('Enthalpy (kJ/Mol)'); title('Temprature vs Enthalpy of',species_name); figure(3); plot(TR,S); xlabel('Temprature (K)'); ylabel('Entropy (J.K/Mol)'); title('Temprature vs Entropy of',species_name);- In next step, we have to save this plots in separate data folder. For that firat we have to create directory for folder using mkdir command. This command can create folder at desire place and we define foleder name using species name here. After creating folder we have to write our outputs in that folder for that we have to change program directory to new directory using cd command. cd command can change directory and save plots in those folders using saveas command.
% To save data in folder folder = mkdir (['E:/Study/Matlab Programm/Charts/Species ',species_name]); cd(['E:/Study/Matlab Programm/Charts/Species ',species_name]); saveas(1,'Specific Heat','jpg'); saveas(2,'Enthalpy','jpg'); saveas(3,'Entropy','jpg'); - In last step counting species weight.
- For that define two different array containing value of atom name and atom weights repectively.
- Then run two for loop. First loop run to get character from specie name to compare and second run to atom name array. In this for loop we use if loop with condition of string character maching using strcmp command. It can match Atom match and write it weight and it will be added in species weight.
- In many species there is repeated atoms like O2 have two O. So, to get that number we use str2double command which can give use repeated value of atoms.Then we add weight of this repeated atoms in species weight and we get final species weight.
- After getting weight print this in command window using fprint command. Then close program evaluation time cycle using toc command.
% Count weight on species Atoms = ['C','H','N','O','A','R']; Atom_weight = [12.0107, 1.0079, 14.0067 , 15.9994 , 39.948 , 0]; Species_weight = 0; for l = 1:length(species_name) for m=1:length(Atoms) if strcmp(species_name(l),Atoms(m)) Species_weight = Species_weight + Atom_weight(m); k = m; end end num = str2double(species_name(l)); if num>1 Species_weight = Species_weight + (Atom_weight(k)*(num-1)); end end fprintf('%2.0f Species weight of %s is = %f \n',i,species_name,Species_weight) end Evaluation_Time = toc
1. Plots of CO2 :-
2. Plots of O2 :-
3. Plots of N2 :-