Project 1 - Parsing NASA thermodynamic data
Program to extracts the 14 co-efficients and calculates the enthalpy, entropy and specific heats for all the species in the give data file(NASA Thermodynamic data).
clear all
close all
clc
% To open data file in readable format
f1 = fopen("THERMO.dat",'r');
fgetl(f1);
A = fgetl(f1);
A = strsplit(A,' ');
global_low_temp = str2num(A{1});
global_mid_temp = str2num(A{2});
global_high_temp = str2num(A{3});

for i = 1:3
    fgetl(f1);
end

% As there are 218 total lines in data file, 6 lines are not useful
for i  = 1:53

% Obtaining specie names
species = fgetl(f1);
N = strsplit(species,' ');
specie_name = species(1:6);

% Obtaining local temperatures of species
T1 = strfind(species,'.');

temp1 = species(T1(1)-3:T1(1)+3);
low_temp = str2num(temp1);

temp2 = species(T1(2)-4:T1(2)+3);
high_temp = str2num(temp2);

temp3 = species(T1(3)-4:T1(3)+3);
mid_temp = str2num(temp3);

% First line coefficients
line_1 = fgetl(f1);
L1 = strfind(line_1,'E');
c1 = str2num(line_1(1:L1(1)+3));
c2 = str2num(line_1(L1(1)+4:L1(2)+3));
c3 = str2num(line_1(L1(2)+4:L1(3)+3));
c4 = str2num(line_1(L1(3)+4:L1(4)+3));
c5 = str2num(line_1(L1(4)+4:L1(5)+3));

% Second line coefficients
line_2 = fgetl(f1);
L2 = strfind(line_2,'E');
c6 = str2num(line_2(1:L2(1)+3));
c7 = str2num(line_2(L2(1)+4:L2(2)+3));
c8 = str2num(line_2(L2(2)+4:L2(3)+3));
c9 = str2num(line_2(L2(3)+4:L2(4)+3));
c10 = str2num(line_2(L2(4)+4:L2(5)+3));

% Third line coefficients
line_3 = fgetl(f1);
L3 = strfind(line_3,'E');
c11 = str2num(line_3(1:L3(1)+3));
c12 = str2num(line_3(L3(1)+4:L3(2)+3));
c13 = str2num(line_3(L3(2)+4:L3(3)+3));
c14 = str2num(line_3(L3(3)+4:L3(4)+3));

%Creating folder
mkdir(['C:\Users\naren\OneDrive\Desktop\Matlab_programs\Temporary programs\',specie_name])

% Calculating species properties
R = 8.314; % Universal Gas constant-kJ/kmol K
T = linspace(low_temp,high_temp,500);
for j = 1:length(T)
    if T>mid_temp
     % High temperature coefficients
     Cp = (c1+c2.*T+c3.*T.^2+c4.*T.^3+c5.*T.^4)*R;
     H = (c1+(c2.*T)/2+(c3.*T.^2)/3+(c4.*T.^3)/4+(c5.*T.^4)/5+(c6./T))*R.*T;
     S = (c1.*log(T)+c2.*T+(c3.*T.^2)/2+(c4.*T.^3)/3+(c5.*T.^4)/4+c7)*R;

    else
     % Low temperature coefficients
     Cp = (c8+c9.*T+c10.*T.^2+c11.*T.^3+c12.*T.^4)*R;
     H = (c8+(c9.*T)/2+(c10.*T.^2)/3+(c11.*T.^3)/4+(c12.*T.^4)/5+(c13./T))*R.*T;
     S = (c8*log(T)+c9*T+(c10.*T.^2)/2+(c11.*T.^3)/3+(c12.*T.^4)/4+c14)*R;
    end
end

% PLOTTING
figure(1)
plot(T,Cp)
title('specific heat vs temperature',specie_name)
xlabel('Temperature')
ylabel('Specific Heat')

figure(2)
plot(T,H)
title('Enthalpy vs temperature',specie_name)
xlabel('Temperature')
ylabel('Enthalpy')

figure(3)
plot(T,S)
title('Entropy vs temperature',specie_name)
xlabel('Temperature')
ylabel('Entropy')

% Saving the plots in folder
saving = (['C:\Users\naren\OneDrive\Desktop\Matlab_programs\Temporary programs\File parsing images\',specie_name]);
cd(saving);
saveas(1,'Specific Heat','jpg');
saveas(2,'Enthalpy','jpg');
saveas(3,'Entropy','jpg');
cd(['C:\Users\naren\OneDrive\Desktop\Matlab_programs\Temporary programs\']);

% Molecular_weight_calculation
Molecular_weight = mol_weight(specie_name);
k = sprintf('Molecular Weight of %s:%f u',specie_name,Molecular_weight);
disp(k)
end
fclose(f1);
Function to calculate molecular weight of species
function M = mol_weight(specie_name)
species = specie_name;
elements = ['H','C','N','O','S','Ar'];
atomic_weight = [1.008,12.011,14.007,15.999,32.066,39.948];
M = 0; % Initialising the value of mol_weight
for i = 1:length(species)
    for j = 1:length(elements)
        if strcmp(specie_name(i),elements(j)) % Compare the specie_name with species array
            M = M + atomic_weight(j);
            m = j;
        end
    end
    n = str2num(specie_name(i)); % To obtain numbers in specie_name
    if n>1
        M = M + (atomic_weight(m)*(n-1));% Adds repeated elements with weight
    end
end
end
Results
Molecular weights of each species displayed in command window
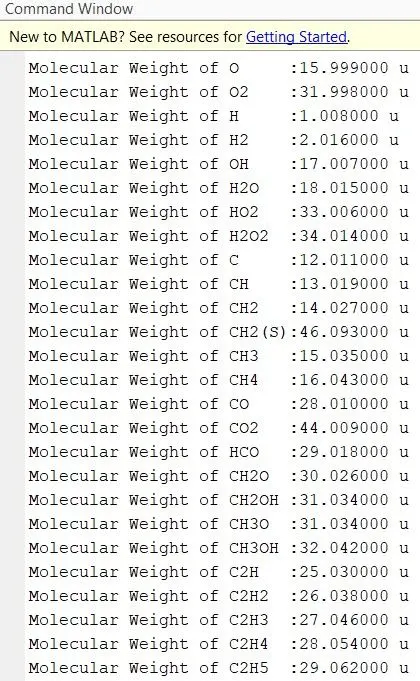
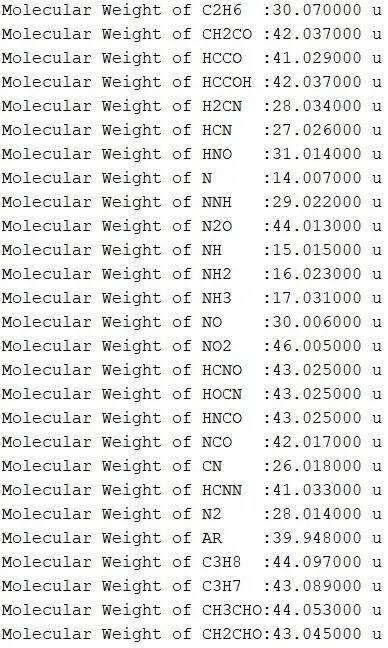
screenshot of saved folders containing plots

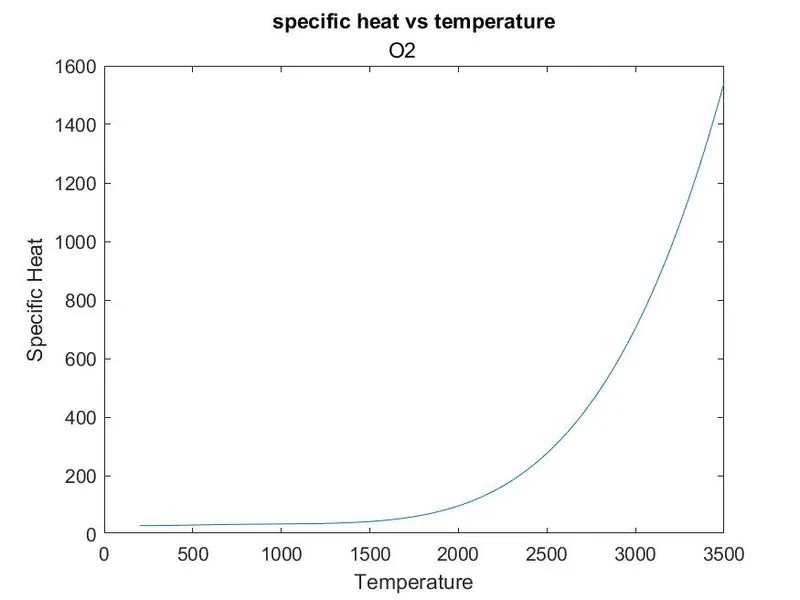
Plot of o2
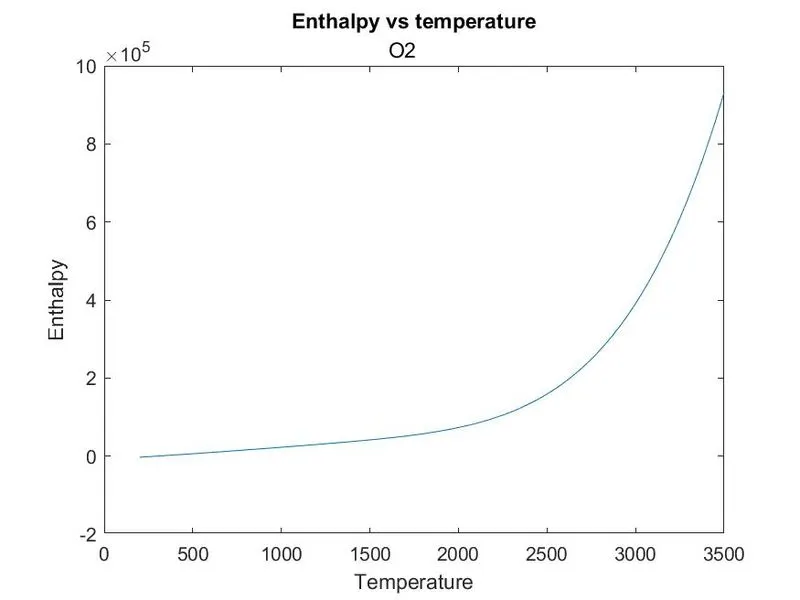
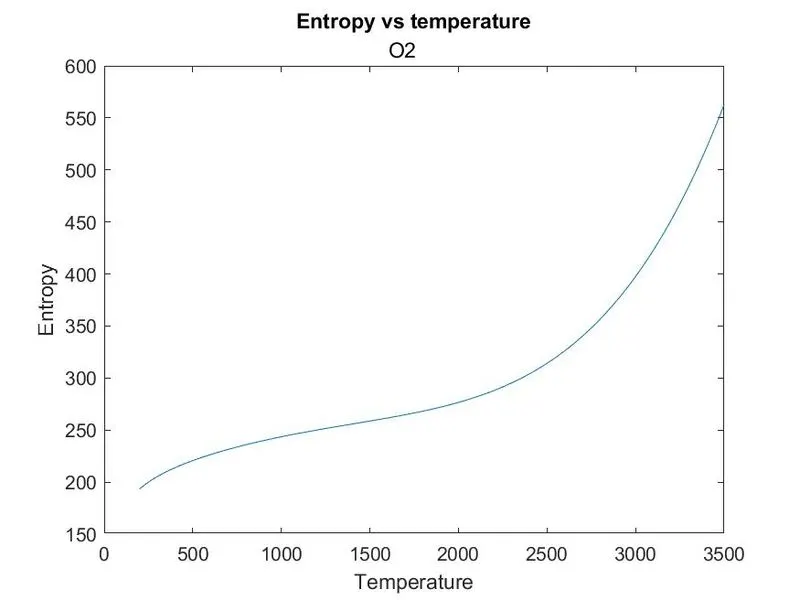
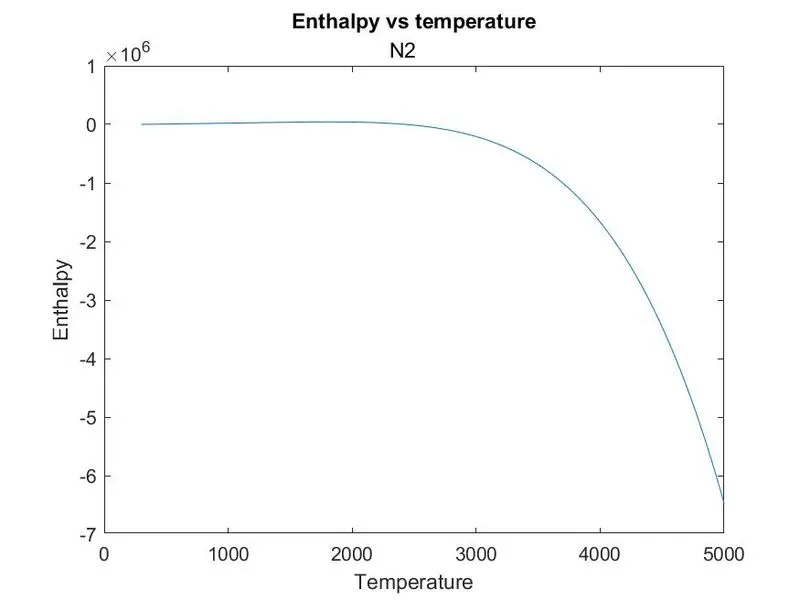
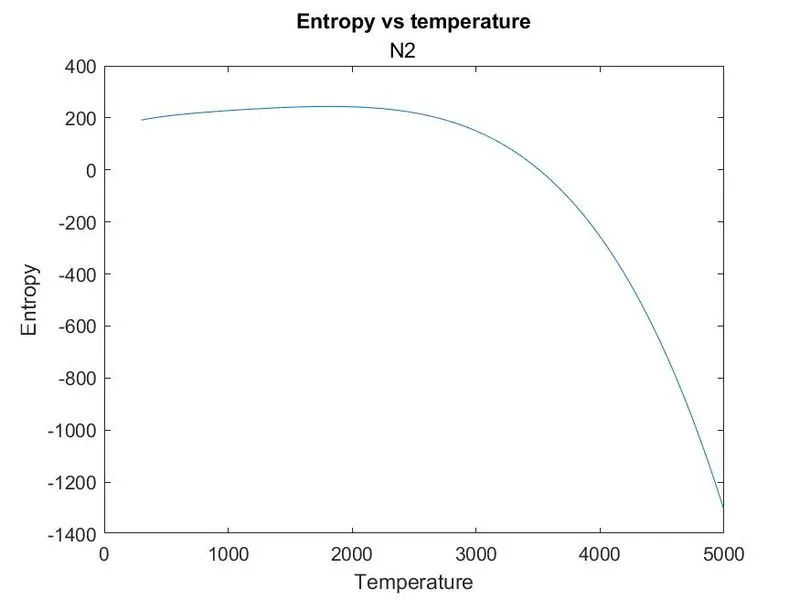
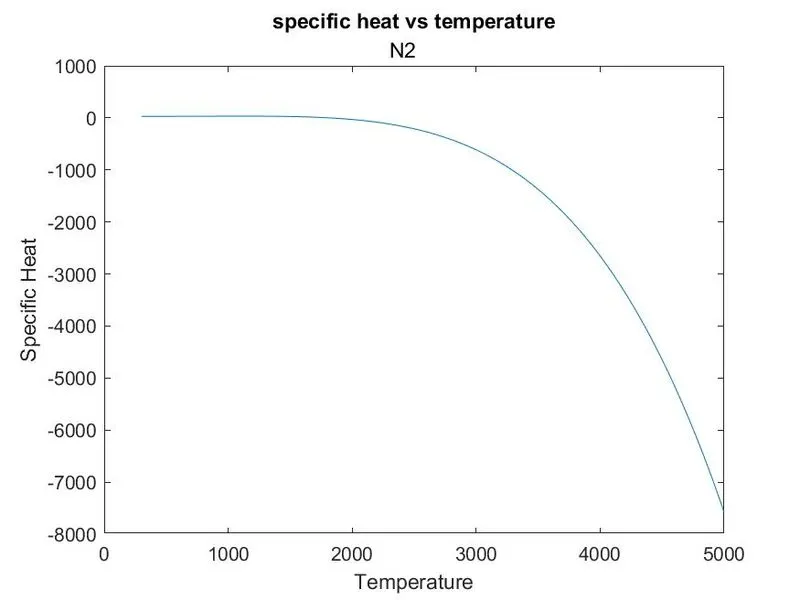
Plot of N2
Plot of Co2
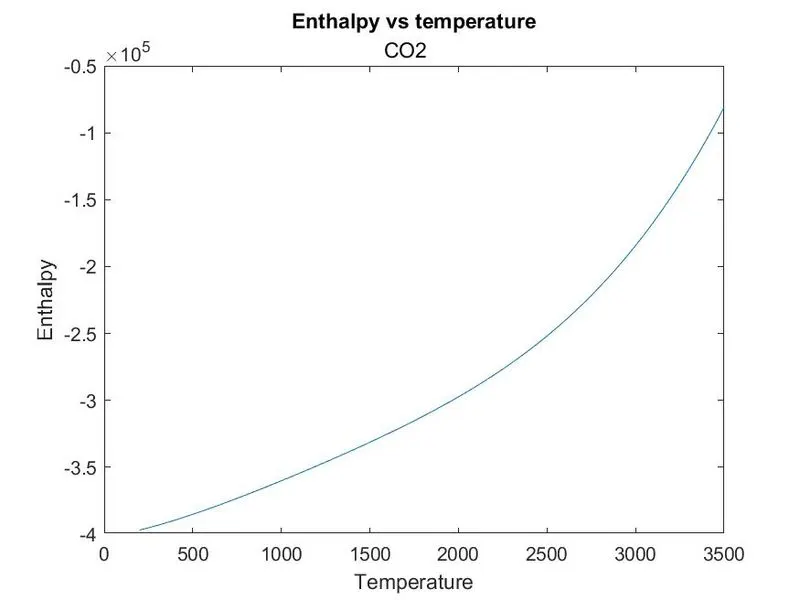
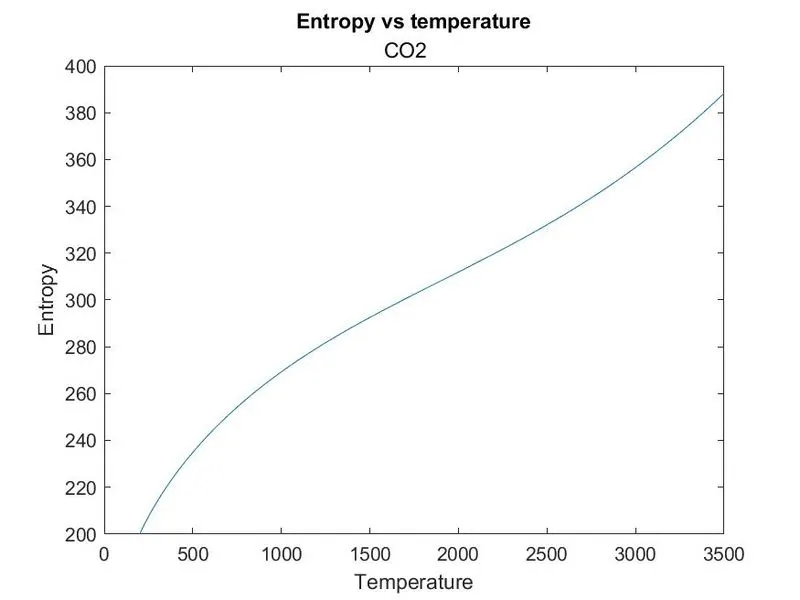
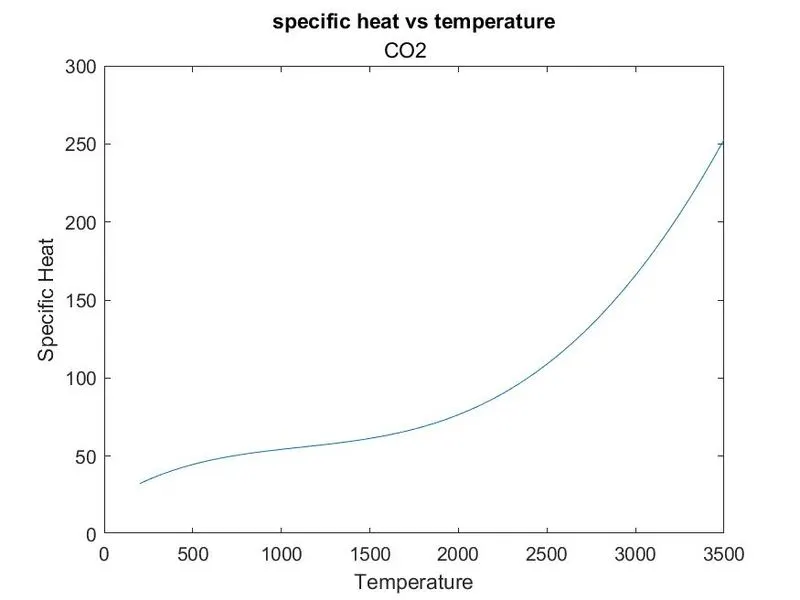
Explaination
- Initially the data file is open using fopen and permission is set as readable.
- using fgetl command the global temperatures are obtained, using strsplit command and space ' ' as indicator the string is split, str2num is used to convert string to number.
- fgetl command is used inside for loop to eliminate next 3 lines, as they have no significance.
- Now the species block is extracted for coefficients and species names and species individual temperature, which is done inside for loop.
- As it is identified as there are 53 species, 14 coefficients are obtained for 53 species and stored from c1 to c14 respectively.
- using mkdir command folders are created at specified location,
- Now species properties such as specific heat , enthalpy and entropy are obtained using the equations given for each properties.
- Taking R = 8.314 and temperature range from low temperature to high temperature upto 500 values, using if else conditions high and low temperature coefficients are divided.
- plots are plotted and are saved using saveas command
- molecular weight is calculated using molecular weight function
- In the molecular weight function atomic weights of each elements is assigned respectively in an array
- using strcmp command two strings were compared then the atomic weight is added, to find no of elements in same species a variable n is created and converted to numeric value and the atomic weight of previous elements is added to n-1 times