Project 1 - Parsing NASA thermodynamic data
Aim:
- To read NASA’s ‘THERMO.dat’ file.
- To extract 14 coefficients & to calculate Specific heat, Enthalpy & Entropy for all the species in data file.
- To calculate molecular weight of each species.
- To plot Specific heat, Enthalpy & Entropy graphs Vs local temperatures.
- To save the plots in each folder.
Code explanation:
Loaded the file data in Variable ‘NASA_data’ using ‘fopen’ command.
Read out & eliminated first line using ‘fgetl’ command.
Read out Global temperature data using ‘fscanf’ command & extracted low, mid & high temperature range in corresponding variables.
Eliminated next three lines using ‘fgetl’ command to enter into line no 6.
From here each species data gets started. There are total of 53 no of species in the data file.
First line contains Name of the specie & its local temperature range limit with suitable spacings.
Next three lines contains total of 14 coefficients where first 7 are the High temperature coefficients & next 7 are the low temperature coefficients.
& Same sequence is continued for next 52 species.
As we were on line no 6, read out the line & stored the data as ‘Info_line’ variable.
Identified the first spacing using ‘strfind(‘ ‘) command & saved it as a ‘Spaces’ variable.
As the name of each specie ends before first space, the logic is used to get the specie name.
Similarly, the decimal ‘.’ Within temperature range was used as a identifier for the temp range & the same logic is used to extract the respective data. The three numbers stored as a Low, Mid & High local temperature range.
Again for the 14 coefficients ‘E’ was consider as a identifier & extracted respective data.
As this data was coming as a ‘Char’ function, converted it in float using ‘str2num’ command.
By using for loop the data for all the 53 species got extracted.
Now the Specific heat, Enthalpy & Entropy data calculated using given formula.
Two different dataset gathered using if-else combination where first 7 variables were defining High temperature coefficients & next 7 were to low temperatures.
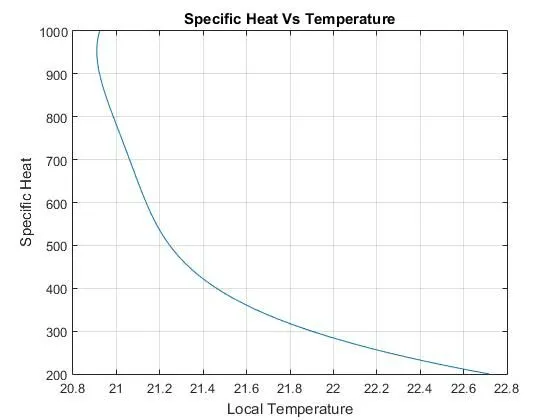
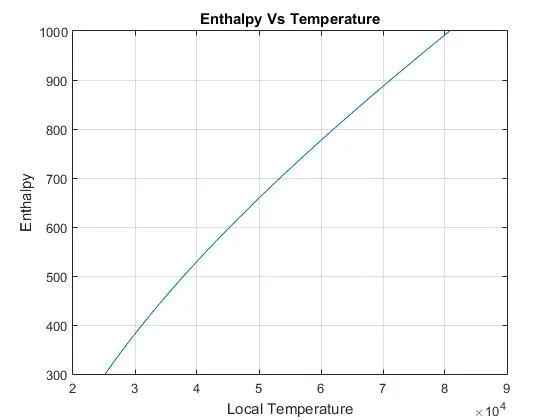
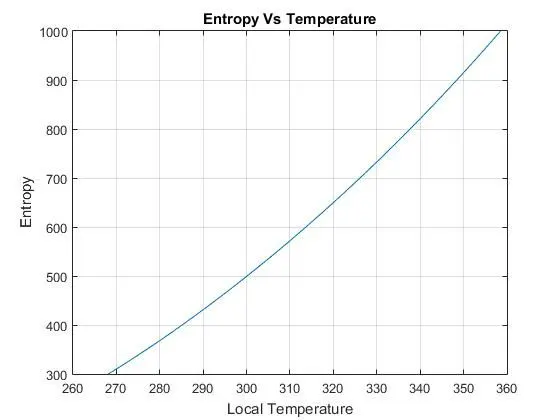
Plotted out the graphs for each of three vs the Local temperature.
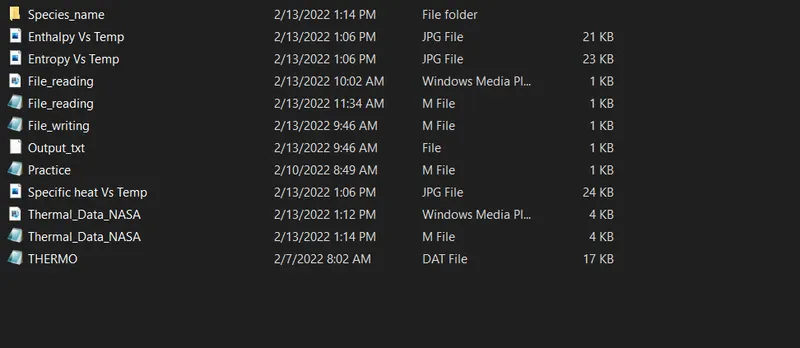
Stored the data in respective folder.
Code:
close all
clear all
clc

NASA_data = fopen('THERMO.dat')
fgetl(NASA_data); %Eliminating Line no 1

%Extracting Global Temprature Ranges
Global_temp = fscanf(NASA_data,'%f',[1 Inf])
Global_High_temp = Global_temp(1);
Global_Mid_temp = Global_temp(2);
Global_Low_temp = Global_temp(3);

fgetl(NASA_data); %Eliminating line no 3,4 & 5
fgetl(NASA_data);
fgetl(NASA_data);

for i = 1:53

%Extracting First Specie Data
Info_line = fgetl(NASA_data) %Reading line no 6

Spaces = strfind(Info_line,' '); %Specie name
Specie_name = Info_line(1:Spaces(1)-1)

Decimal = strfind(Info_line,'.'); % Local temperatures
Local_Low_temp = Info_line(Decimal(1)-4:Decimal(1)+3);
Local_Low_temp = str2num(Local_Low_temp)
Local_Mid_temp = Info_line(Decimal(2)-4:Decimal(2)+3);
Local_Mid_temp = str2num(Local_Mid_temp)
Local_High_temp = Info_line(Decimal(3)-4:Decimal(3)+3);
Local_High_temp = str2num(Local_High_temp)

Coefficient_line_A = fgetl(NASA_data)
Es = strfind(Coefficient_line_A, 'E')
Coeff_1 = Coefficient_line_A(1:Es(1)+3);
Coeff_1 = str2num(Coeff_1)
Coeff_2 = Coefficient_line_A(Es(1)+4:Es(2)+3);
Coeff_2 = str2num(Coeff_2)
Coeff_3 = Coefficient_line_A(Es(2)+4:Es(3)+3);
Coeff_3 = str2num(Coeff_3)
Coeff_4 = Coefficient_line_A(Es(3)+4:Es(4)+3);
Coeff_4 = str2num(Coeff_4)
Coeff_5 = Coefficient_line_A(Es(4)+4:Es(5)+3);
Coeff_5 = str2num(Coeff_5)

Coefficient_line_B = fgetl(NASA_data)
Es = strfind(Coefficient_line_B, 'E')
Coeff_6 = Coefficient_line_B(1:Es(1)+3);
Coeff_6 = str2num(Coeff_6)
Coeff_7 = Coefficient_line_B(Es(1)+4:Es(2)+3);
Coeff_7 = str2num(Coeff_7)
Coeff_8 = Coefficient_line_B(Es(2)+4:Es(3)+3);
Coeff_8 = str2num(Coeff_8)
Coeff_9 = Coefficient_line_B(Es(3)+4:Es(4)+3);
Coeff_9 = str2num(Coeff_9)
Coeff_10 = Coefficient_line_B(Es(4)+4:Es(5)+3);
Coeff_10 = str2num(Coeff_10)

Coefficient_line_C = fgetl(NASA_data)
Es = strfind(Coefficient_line_B, 'E')
Coeff_11 = Coefficient_line_C(1:Es(1)+3);
Coeff_11 = str2num(Coeff_11)
Coeff_12 = Coefficient_line_C(Es(1)+4:Es(2)+3);
Coeff_12 = str2num(Coeff_12)
Coeff_13 = Coefficient_line_C(Es(2)+4:Es(3)+3);
Coeff_13 = str2num(Coeff_13)
Coeff_14 = Coefficient_line_C(Es(3)+4:Es(4)+3);
Coeff_14 = str2num(Coeff_14)


%Calculating Specific heat, Enthalpy & Entropy
R = 8.314;    %Universal Gas Constant J/mol.K
T = linspace(Local_Low_temp,Local_High_temp,100);

for i = 1:length(T)
    if T(i)>Local_Mid_temp

        Cp(i) = (Coeff_1 + Coeff_2*T(i) + Coeff_3*T(i)^2 + Coeff_4*T(i)^3 + Coeff_5*T(i)^4)*R;
        H(i) = (Coeff_1 + Coeff_2*T(i)/2 + Coeff_3*T(i)^2/3 + Coeff_4*T(i)^3/4 + Coeff_5*T(i)^4/5 + Coeff_6/T(i))*R*T(i);
        S(i) = (Coeff_1*log(T(i)) + Coeff_2*T(i) + Coeff_3*T(i)^2/2 + Coeff_4*T(i)^3/3 + Coeff_5*T(i)^4/4 + Coeff_7)*R;

    else

        Cp(i) = (Coeff_8 + Coeff_9*T(i) + Coeff_10*T(i)^2 + Coeff_11*T(i)^3 + Coeff_12*T(i)^4)*R;
        H(i) = (Coeff_8 + Coeff_9*T(i)/2 + Coeff_10*T(i)^2/3 + Coeff_11*T(i)^3/4 + Coeff_12*T(i)^4/5 + Coeff_13/T(i))*R*T(i);
        S(i) = (Coeff_8*log(T(i)) + Coeff_9*T(i) + Coeff_10*T(i)^2/2 + Coeff_11*T(i)^3/3 + Coeff_12*T(i)^4/4 + Coeff_14)*R;

    end
end

%Graph Plotting
plot(Cp,T)     %Specific Heat Graph
xlabel('Local Temperature')
ylabel('Specific Heat')
title('Specific Heat Vs Temperature')
grid on

figure(2)
plot(H,T)     %EnthalpyGraph
xlabel('Local Temperature')
ylabel('Enthalpy')
title('Enthalpy Vs Temperature')
grid on

figure(3)
plot(S,T)    %Entropy Graph
xlabel('Local Temperature')
ylabel('Entropy')
title('Entropy Vs Temperature')
grid on

%Creating folder to save the plots
mkdir('Species_name')
cd(sprintf('Species_name'))
end
Plots:
Conclusion:
NASA thermal data for all 53 species is read & the Plot information stored in the respective folder suceesfully.