Project 1 - Parsing NASA thermodynamic data
PARSING NASA THERMODYNAMICS DATA
Aim:
Parsing NASA thermodynamics data file to calculate various terms using MATLAB.
Objectives:
- To read "NASA thermodynamics data file" and to write a function that extracts the 14 coefficients and calculate the enthalpy, entropy and specific heat for all the species.
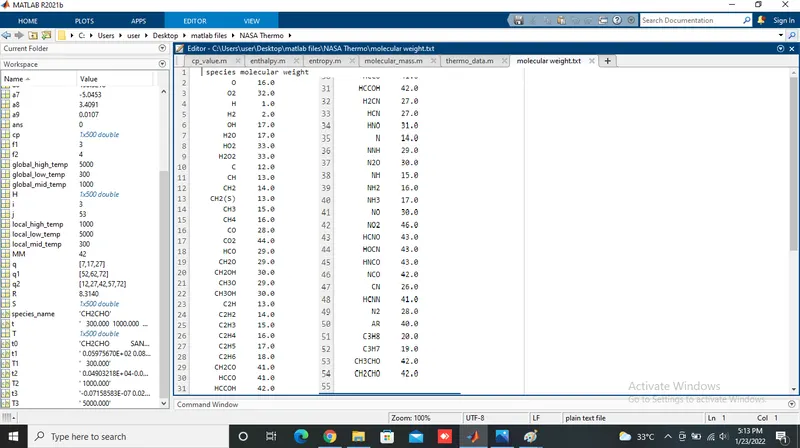
- Calculate the molecular weight of each species and display it in the command window.
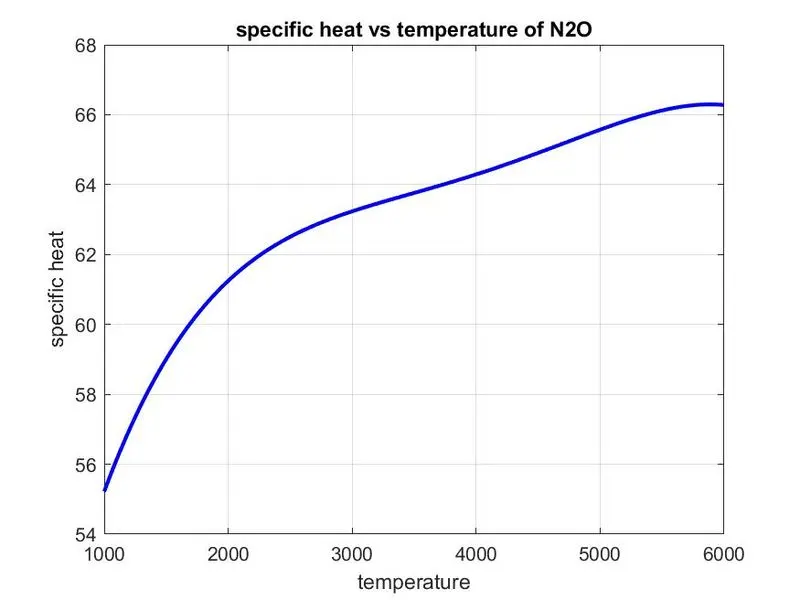
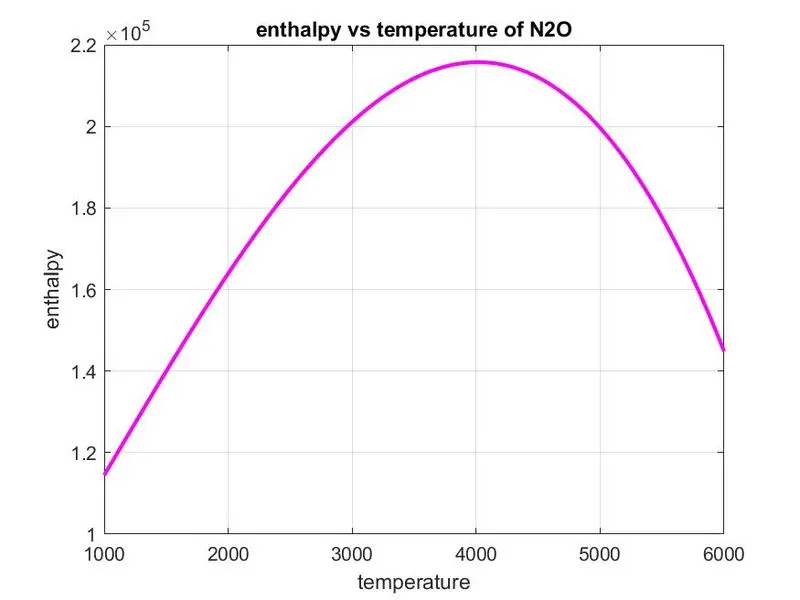
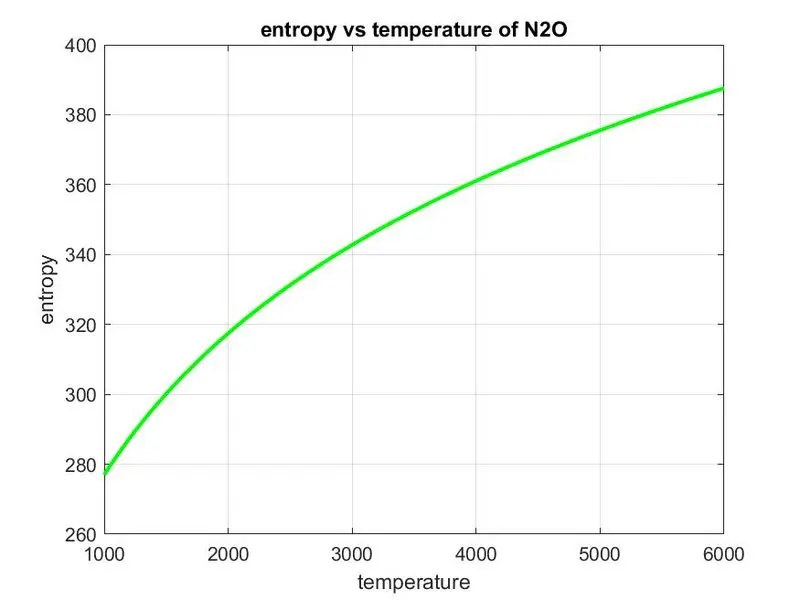
- Plot the Cp, enthalpy and entropy for the local temperature range.
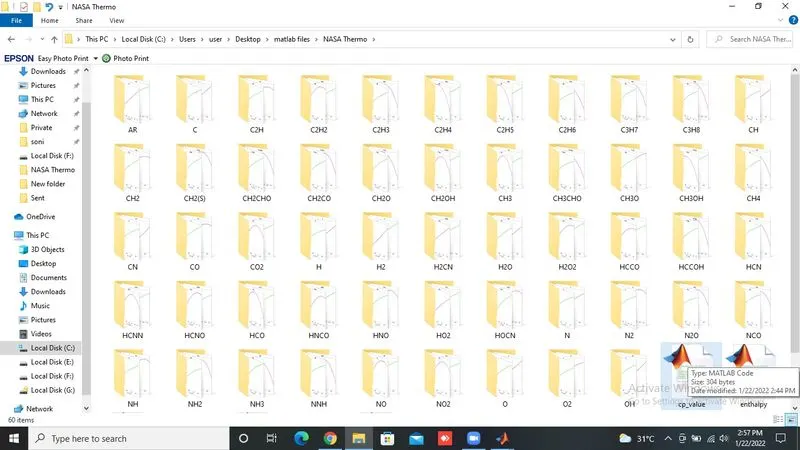
- Save the plots as images with appropriate names and dump them in separate folders for each species.
Introduction:
Parsing a file means reading in a data stream of some sort and building an in memory model of the semantic content of that data. This aims at facilitating performing some kind of transformation on the data.
1. Enthalpy:
It is a thermodynamic quantity equivalent to the total heat content of a system. It is equal to the internal energy of the system plus the product of pressure and volume.
The unit of measurement for enthalpy in the SI unit is "joule".
2. Entropy:
It is a thermodynamic quantity representing the unavailability of a system's thermal energy for conversion into mechanical work, often interpreted as the degree of disorder or randomness in the system.
SI unit: joules per kelvin(j/K).
3. Molecular weight:
The molecular mass (m) is the mass of a given molecule: it is measured in daltons.
Different molecules of the same compound may have different molecular masses because they contain different isotopes of element.
The mass of a given substance divided by the amount of substance and is expressed in g/mol. The molar mass is usually the more appropriate figure when dealing with macroscopic (weigh-able) quantities of a substance.
Governing Equations:
The NASA polynomials have the form

where,
- R is the universal constant (R=8.314 J/mol.K)
- T is the temperature(local temperature)
- cp is specific heat at constant pressure
- H is enthalpy
- S is entropy
- a1,a2,a3,a4,a5,a6 and a7 are the numerical coefficient. The FIRST 7 coefficients are HIGH-temperature coefficients and the SECOND 7 coefficients are LOW-temperature coefficients.
Command used in program code:-
fopen('filename',r) - open and read the file
fgetl - Read line from file
Fopen('filename',wt) - open and write in a file
deblank - Remove trailing whitespace from ends of strings
str2num - Convert string to numeric array
findstr - Fing one string within another
linspace - Generate linearly spaced vectors
fprintf - Write formatted data to file
pwd - Identify current directory
mkdir - Make new directory/folder
cd - change working/current directory
Program:-
formula:
Matlab script of calculating specific heat:
function [cp] = cp_value(a1,a2,a3,a4,a5,a6,a7,a8,a9,a10,a11,a12,a13,a14,R,T,local_mid_temp);
for i = 1:length(T)
if T(i)>local_mid_temp
cp(i) = (a1+(a2.*T(i))+(a3.*(T(i)^2))+(a4.*(T(i)^3))+(a5.*(T(i)^4)))*R;
else
    cp(i) = (a6+(a7.*T(i))+(a8.*(T(i)^2))+(a9.*(T(i)^3))+(a10.*(T(i)^4)))*R;
end
end
Matlab script of calculating Enthalpy:
function [H] = enthalpy(a1,a2,a3,a4,a5,a6,a7,a8,a9,a10,a11,a12,a13,a14,R,T,local_mid_temp);
for i = 1:length(T)
if T(i)>local_mid_temp
H(i) = (a1.*T(i)+(a2.*(T(i)^2)./2)+(a3.*(T(i)^3)./2)+(a4.*(T(i)^4)./4)+(a5.*(T(i)^5)./5)+a6)*R;
else
    H(i) = (a7.*T(i)+(a8.*(T(i)^2)./2)+(a9.*(T(i)^3)./3)+(a10.*(T(i)^4)./4)+(a11.*(T(i)^5)./5)+a12)*R;
end
end
Matlab script of calculating Entropy:
function [S] = entropy(a1,a2,a3,a4,a5,a6,a7,a8,a9,a10,a11,a12,a13,a14,R,T,local_mid_temp);
for i = 1:length(T)
if T(i)>local_mid_temp
S(i) = (a1.*log(T(i))+(a2.*T(i))+(a3.*(T(i)^2)./2)+(a4.*(T(i)^3)./3)+(a5.*(T(i)^4)./4)+a7)*R;
else
    S(i) = (a8.*log(T(i))+(a9.*T(i))+(a10.*(T(i)^2)./2)+(a11.*(T(i)^3)./3)+(a12.*(T(i)^4)./4)+a14)*R;
end
end
Matlab script of calculating Molecular weight:
function [MM] = molecular_mass(species_name)
element = {'H','C','N','O','A'}
mass = [1,12,14,16,40]

MM = 0;

for i = 1:length(species_name);
    for j = 1:length(element);
        if strcmp(species_name(i),element(j))
            MM = MM+mass(j);
p = j;
        end
    end
end

    n = str2num(species_name(i));
    if n>1
        MM = MM+(mass(p)*(n-1));
    end
Main code:
clear all
close all
clc
%reading the file
f1 = fopen('THERMO.dat','r');
fgetl(f1);    %skipping first line

R = 8.314 ;    %R is universe gas constant
%reading the global temperature
t = fgetl(f1);
q = findstr(t,'.');
T1 = t(1:q(1)+3);
T2 = t(q(1)+5:q(2)+3);
T3 = t(q(2)+5:q(3)+3);
global_low_temp = str2num(T1);
global_mid_temp = str2num(T2);
global_high_temp = str2num(T3);
%skipping the next 3 line
for i = 1:3
    fgetl(f1);
end
f2 = fopen('molecular weight.txt','w');
fprintf(f2,'%8s %8s','species','molecular weight');
fprintf(f2,'\n');

for j = 1:53
    %reading first line of species information
    t0 = fgetl(f1);
    species_name = t0(1:6);
    species_name = deblank(species_name);   %Remove trailing whitespace from ends of strings
    q1 = findstr(t0,'.');
    local_mid_temp = str2num(t0(q1(1)-4:q1(1)));
    local_low_temp = str2num(t0(q1(2)-4:q1(2)));
    local_high_temp = str2num(t0(q1(3)-4:q1(3)));
T = linspace(local_low_temp,local_high_temp,500); %create temperature range using array%for coefficient
t1 = fgetl(f1);
    t2 = fgetl(f1);
    t3 = fgetl(f1);

    q2 = findstr(t1,'E');

    a1 = str2num(t1(1:q2(1)+3));
    a2 = str2num(t1(q2(1)+4:q2(2)+3));
    a3 = str2num(t1(q2(2)+4:q2(3)+3));
    a4 = str2num(t1(q2(3)+4:q2(4)+3));
    a5 = str2num(t1(q2(4)+4:q2(5)+3));

    a6 = str2num(t2(1:q2(1)+3));
    a7 = str2num(t2(q2(1)+4:q2(2)+3));
    a8 = str2num(t2(q2(2)+4:q2(3)+3));
    a9 = str2num(t2(q2(3)+4:q2(4)+3));
    a10 = str2num(t2(q2(4)+4:q2(5)+3));

    a11 = str2num(t3(1:q2(1)+3));
    a12 = str2num(t3(q2(1)+4:q2(2)+3));
    a13 = str2num(t3(q2(2)+4:q2(3)+3));
    a14 = str2num(t3(q2(3)+4:q2(4)+3));
cp = cp_value(a1,a2,a3,a4,a5,a6,a7,a8,a9,a10,a11,a12,a13,a14,R,T,local_mid_temp); %calculating specific heat
H = enthalpy(a1,a2,a3,a4,a5,a6,a7,a8,a9,a10,a11,a12,a13,a14,R,T,local_mid_temp); %calculating enthalpy
S = entropy(a1,a2,a3,a4,a5,a6,a7,a8,a9,a10,a11,a12,a13,a14,R,T,local_mid_temp); %calculating entropy
MM = molecular_mass(species_name); %calculating molecular weight%plotting
figure(1)
    plot(T,cp,'linewidth',2,'color','b');
    grid on;
    xlabel('temperature');
    ylabel('specific heat');
    title(sprintf('specific heat vs temperature of %s',species_name));

    figure(2)
    plot(T,H,'linewidth',2,'color','m');
    grid on;
    xlabel('temperature');
    ylabel('enthalpy');
    title(sprintf('enthalpy vs temperature of %s',species_name));

    figure(3)
    plot(T,S,'linewidth',2,'color','g');
    grid on;
    xlabel('temperature');
    ylabel('entropy');
    title(sprintf('entropy vs temperature of %s',species_name));
%saving plot
cd('C:\Users\user\Desktop\matlab files\NASA Thermo')
    mkdir(species_name)    %Make new folder
    cd(species_name)

    saveas(1,'specific heat vs temperature.jpg');
    saveas(2,'enthalpy vs temperature.jpg');
    saveas(3,'entropy vs temperature.jpg');

    cd('C:\Users\user\Desktop\matlab files\NASA Thermo')

    fprintf(f2,'%8s %8.1f',species_name,MM);
    fprintf(f2,'\n');
end
fclose(f2)
Result:
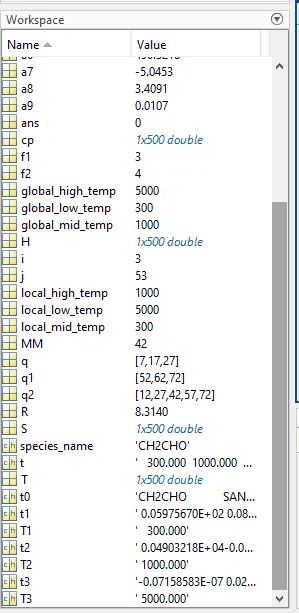
Workspace:
Molecular weight:
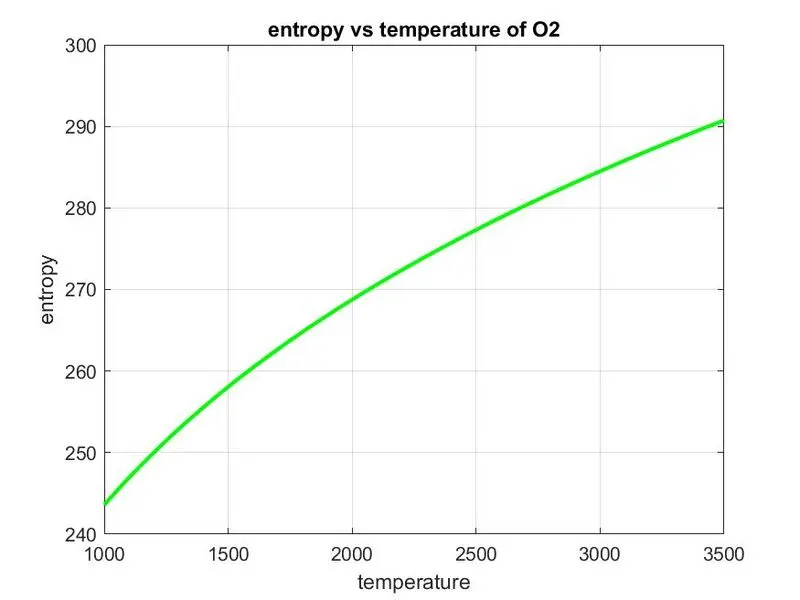
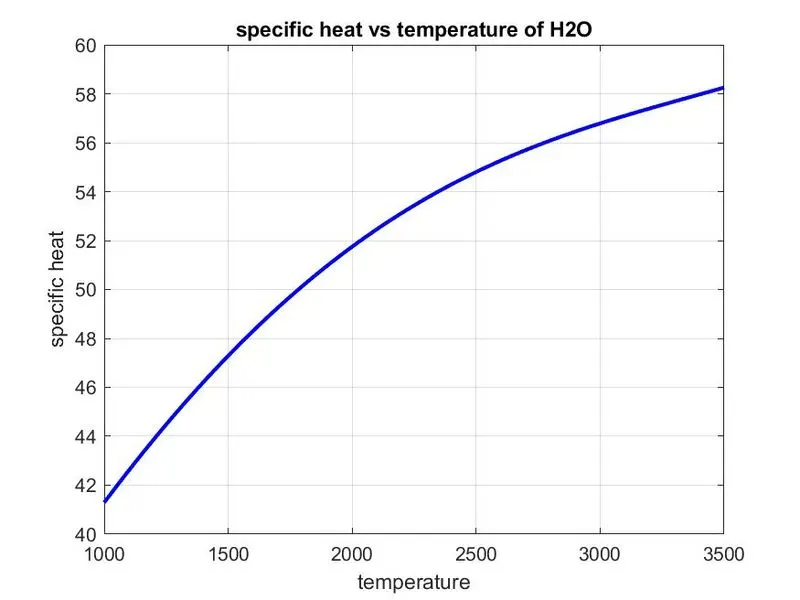
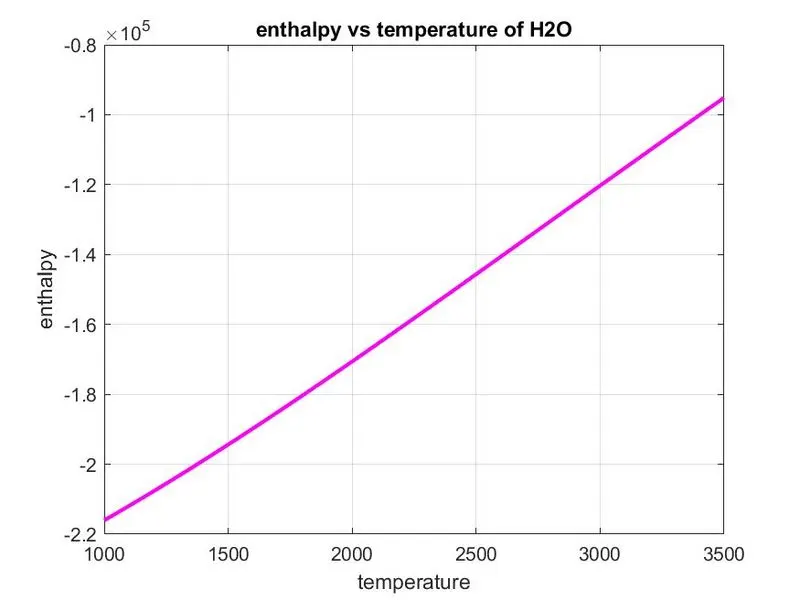
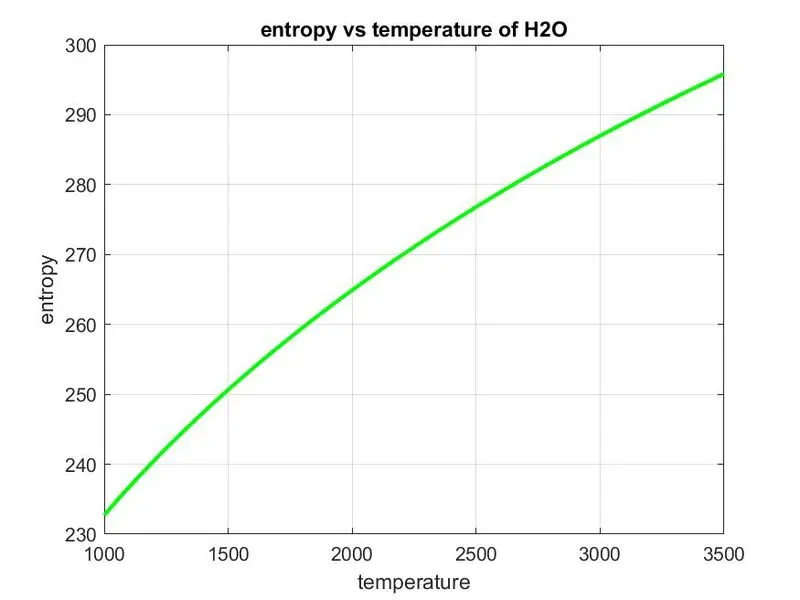
Plots/Graph:
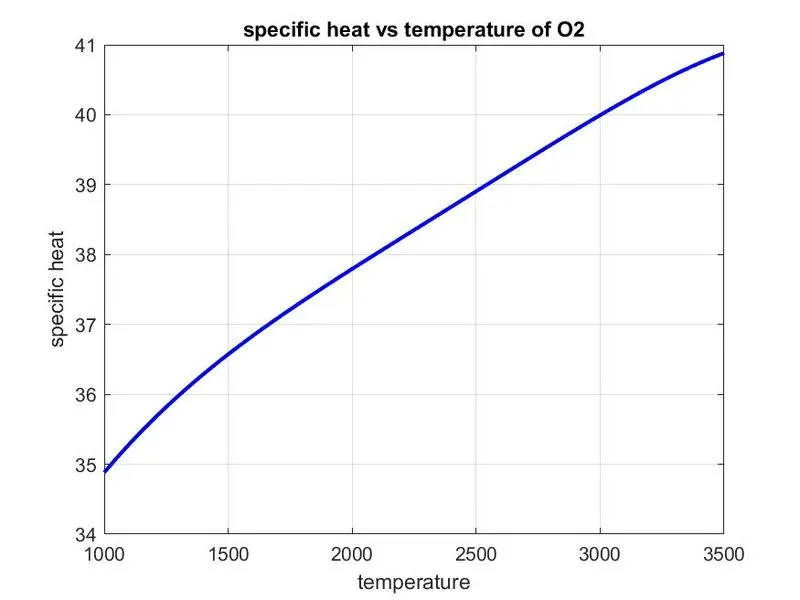
Specific heat vs Temperature of O2
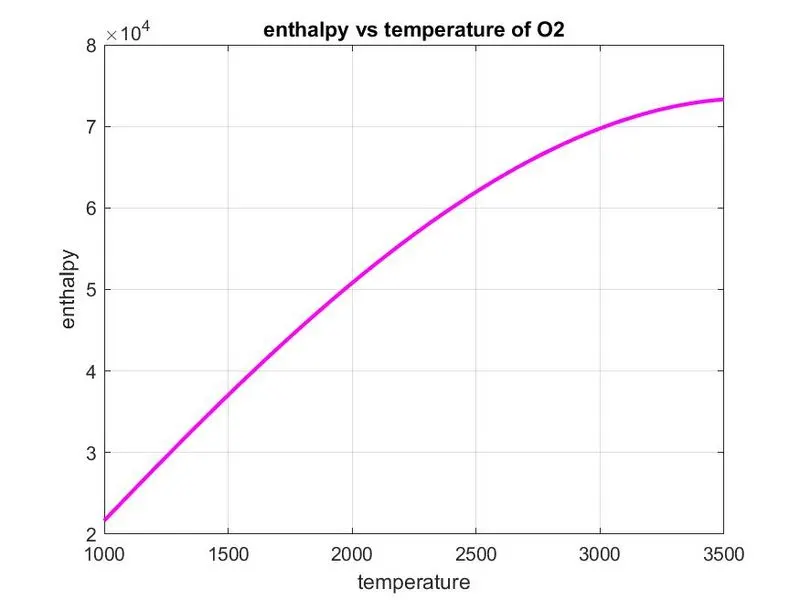
Enthalpy vs Temperature of O2
Entropy vs Temperature of O2
Specific heat vs Temperature of H2O
Enthalpy vs Temperature of H2O
Entropy vs Temperature of H2O
Specific heat vs Temperature of N2O
Enthalpy vs Temperature of N2O
Entropy vs Temperature of N2O
Screenshot of saved folders:
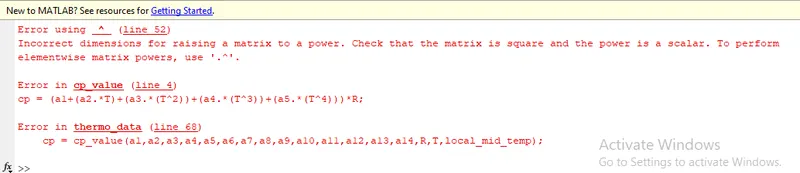
Error faced while programming:
1. Wrongly saved the input file "THERMO.dat", so the error shows 'Index exceeds the number of array elements. Index must not exceed 0.'
2. T is a array with 1x500 double, so required for loop ,
Conclusion:
- Hence , we have done file parsing and used various functions to solve the calculations.
- Calculated the molecular weight of each species and displayed.
- Plotted the Cp, Enthalpy and Entropy for the local temperature range specific for each species.
- Automatically saved the plots as images with appropriate names and dump them in separate folders for each species with suitable name.
Reference:
- https://www.mathworks.com/matlabcentral/answers/472084-how-to-parse-text-data
- https://en.wikipedia.org/wiki/Thermodynamics
- https://www.mathworks.com/help/matlab/ref/sprintf.html
- https://www.mathworks.com/help/matlab/ref/mkdir.html
- https://www.mathworks.com/help/matlab/ref/saveas.html
- https://www.mathworks.com/matlabcentral/answers/17580-how-to-define-a-path-in-saveas-command
- https://www.mathworks.com/help/matlab/ref/msgbox.html