Project 1 - Parsing NASA thermodynamic data
AIM : To Write a function that can extracts the 14 co-efficients and calculates the enthalpy(Cp),entropy(H) and specific heats(S) for all the species from given the data file.
Link for data file:https://drive.google.com/file/d/1AikCHDlz9s_fu8whE81qee_GD4AyYpCP/view?usp=sharing
OBJECTIVE:
- To find the co-efficients of all the given species
- To identify the local temperatures for the given species
- To use NASA Polynomials and extract a plot for Cp,H,S
EXLANATION:
NASA as given a THERMO DATA which contains the value of the co-efficients for many differnt species. And NASA as come up with the polynomials which can be used to find the values of enthalpy, entropy and specific heat of the gievn species. In Matlab the THERMO.dat file is opened using fopen command and the co-efficent values are extracted using getl command
once the co-efficient values are extracted it is used in NASA polynomial formula shown below in fig(1) to calculate enthalpy,entropy and specific heat for the given species and then a plot for Cp,H and S is optained

Fig (1) NASA polynomial formula
CODE:
clear all
close all
clc
%opening the thermo.dat file

f1=fopen('THERMO.dat','r')
fgetl(f1)
fgetl(f1)
fgetl(f1)
fgetl(f1)
fgetl(f1)

for i=1:53

 %extracting the species name

a=fgetl(f1)
a=strsplit(a,' ')
species=a{1}

%extracting local temperature
local_low_tem=str2num(a{end-3})
local_mid_tem=str2num(a{end-1})
local_high_tem=str2num(a{end-2})


%finding the position of E
s1=fgetl(f1)
po=strfind(s1,'E')
%extracting the co-efficient values
a1=s1(1:po(1)+3)
a1=str2num(a1)
a2=s1(po(1)+4:po(2)+3)
a2=str2num(a2)
a3=s1(po(2)+4:po(3)+3)
a3=str2num(a3)
a4=s1(po(3)+4:po(4)+3)
a4=str2num(a4)
a5=s1(po(4)+4:po(5)+3)
a5=str2num(a5)

%extracting the co-efficient values
s2=fgetl(f1)
po=strfind(s2,'E')
a6=s2(1:po(1)+3)
a6=str2num(a6)
a7=s2(po(1)+4:po(2)+3)
a7=str2num(a7)
a8=s2(po(2)+4:po(3)+3)
a8=str2num(a8)
a9=s2(po(3)+4:po(4)+3)
a9=str2num(a9)
a10=s2(po(4)+4:po(5)+3)
a10=str2num(a10)

%extracting the co-efficient values
s3=fgetl(f1)
po=strfind(s3,'E')
a11=s3(1:po(1)+3)
a11=str2num(a11)
a12=s3(po(1)+4:po(2)+3)
a12=str2num(a12)
a13=s3(po(2)+4:po(3)+3)
a13=str2num(a13)
a14=s3(po(3)+4:po(4)+3)
a14=str2num(a14)

temp=linspace(local_mid_tem,local_high_tem,500)
%Entholpy calculations
    Cp=(a1+a2.*temp+a3*temp.^2+a4.*temp.^3+a5.*temp.^4)*8.314
%Entropy calculatiuons
    H=(a1+a2*temp./2+a3*(temp.^2)/3+a4*(temp.^3)/4+a5*(temp.^4)/5+a6./temp)*8.314
%specific heat
    S=(a1*log(temp)+a2*temp+a3*(temp.^2)/2+a4*(temp.^3)/3+a5*(temp.^2)/4+a7)*8.314

%plot 1 temperature vs Cp
   figure (i)
   hold on
   plot(temp,Cp)
   xlabel("temperature")
   ylabel("Enthalpy(Cp)")
   title(species)
%plot 2 temperature vs H
   figure (53+i)
   plot(temp,H)
   hold on
   xlabel("temperature")
   ylabel("entropy(H)")
   title(species)
%plot 3 temperature vs S
   figure (106+i)
   plot(temp,S)
   hold on
   xlabel("teperature")
   ylabel("specific heat (S)")
   title(species)
end
Line 6:
f1=fopen('THERMO.dat','r') -opening the THERMO.dat file using fopen command and assinging the reading mood 'r'
Line 17:
a=fgetl(f1) -using fgetl command to read the line number 6 in the data file
Line 18-19:
a=strsplit(a,' ') -spliting the data in line number 6 in the data file to determine the species
species=a{1} name by using strsplit command and using sapce as the deleminater
Line 22-24:
local_low_tem=str2num(a{end-3}) -finding the local temperature values and converting the string values into
local_mid_tem=str2num(a{end-1}) intiger as str2num command
local_high_tem=str2num(a{end-2})
Line 28-29:
s1=fgetl(f1) -finding the position of "E" using strfind command
po=strfind(s1,'E')
Line 31-34:
a1=s1(1:po(1)+3) -finding the values of co-efficient and converting the values from string to intiger
a1=str2num(a1)
a2=s1(po(1)+4:po(2)+3)
a2=str2num(a2)
Line 70:
Cp=(a1+a2.*temp+a3*temp.^2+a4.*temp.^3+a5.*temp.^4)*8.314 -formula to calculate entholpy
Line 72:
H=(a1+a2*temp./2+a3*(temp.^2)/3+a4*(temp.^3)/4+a5*(temp.^4)/5+a6./temp)*8.314 -formula to calculate entropy
Line 74:
S=(a1*log(temp)+a2*temp+a3*(temp.^2)/2+a4*(temp.^3)/3+a5*(temp.^2)/4+a7)*8.314 -formula to calculate specific heat
Line 77-82:
figure (i) -plot 1 temperature vs Cp
hold on
plot(temp,Cp)
xlabel("temperature")
ylabel("Enthalpy(Cp)")
title(species)
Line 84-89:
figure (53+i) -plot 3 temperature vs H
plot(temp,H)
hold on
xlabel("temperature")
ylabel("entropy(H)")
title(species)
Line 91-96:
figure (106+i) -plot 3 temperature vs S
plot(temp,S)
hold on
xlabel("teperature")
ylabel("specific heat (S)")
title(species)
OUT PUT:
SPECIES -O2
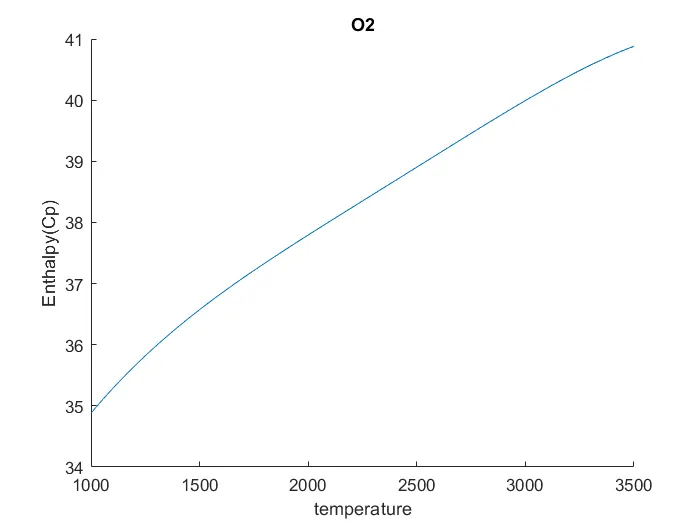
fig (2) plot enthalpy Vs temperature
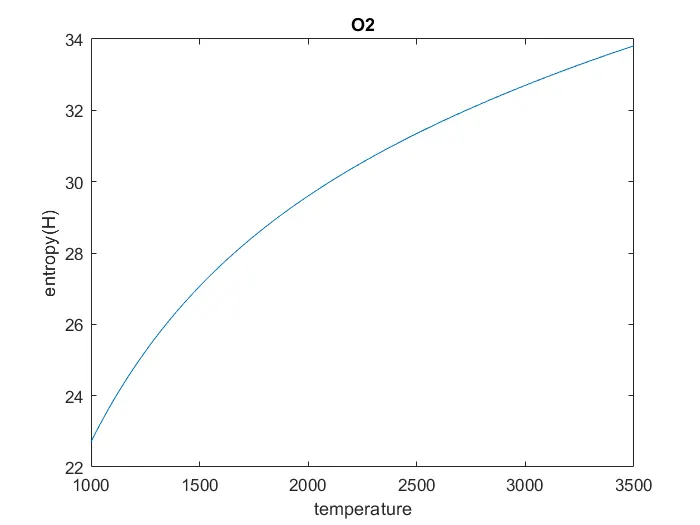
fig (3) entropy Vs temperature
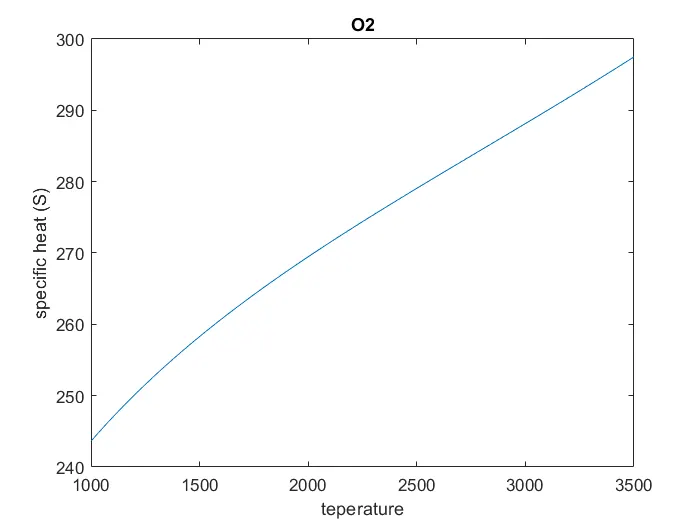
fig(4) specific heat Vs temperature
SPECIES: CO2
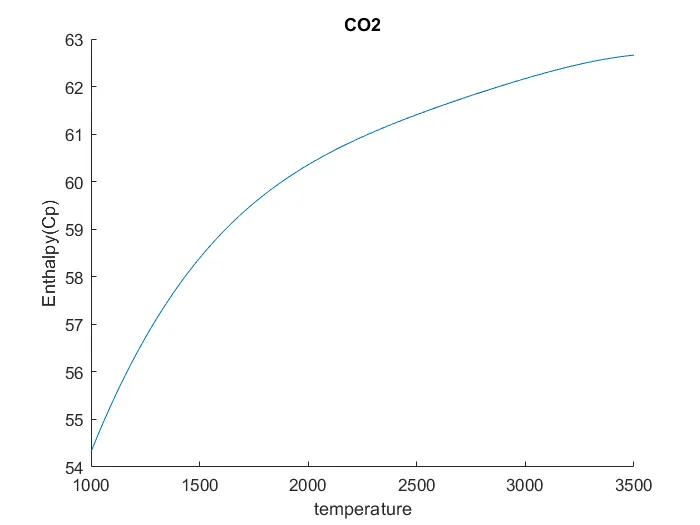
fig (5) plot enthalpy Vs temperature
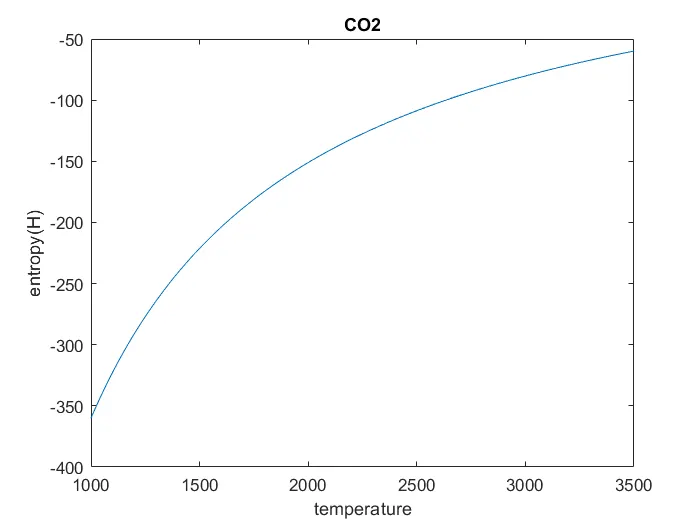
fig (6) entropy Vs temperature
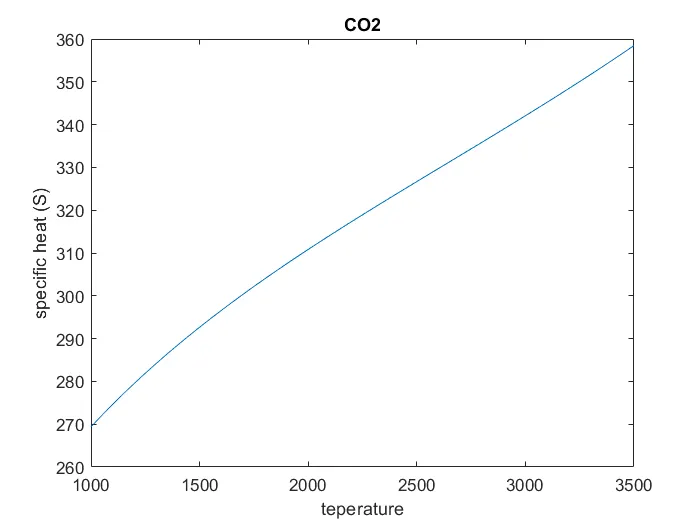
fig(7) specific heat Vs temperature
SPECIES :N2
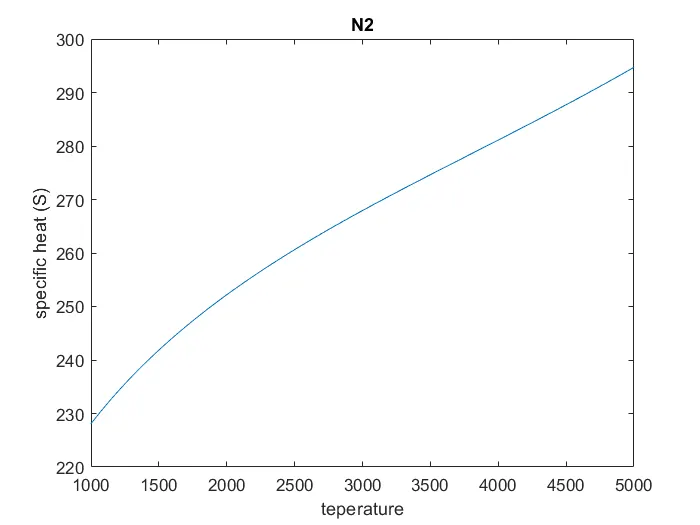
fig(8) specific heat Vs temperature
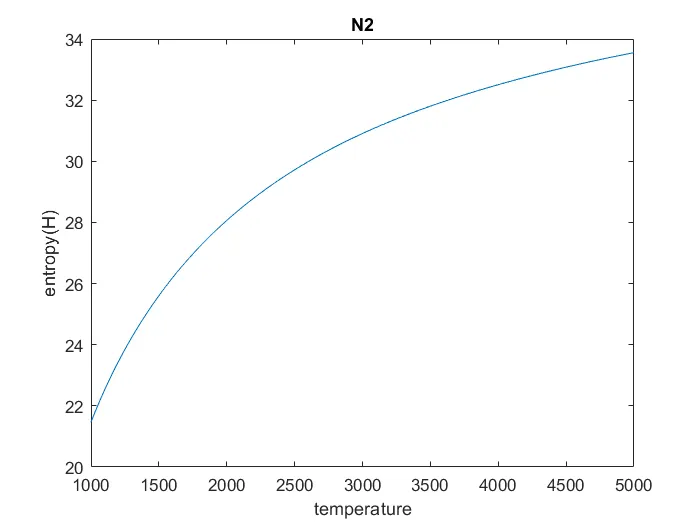
fig (9) entropy Vs temperature
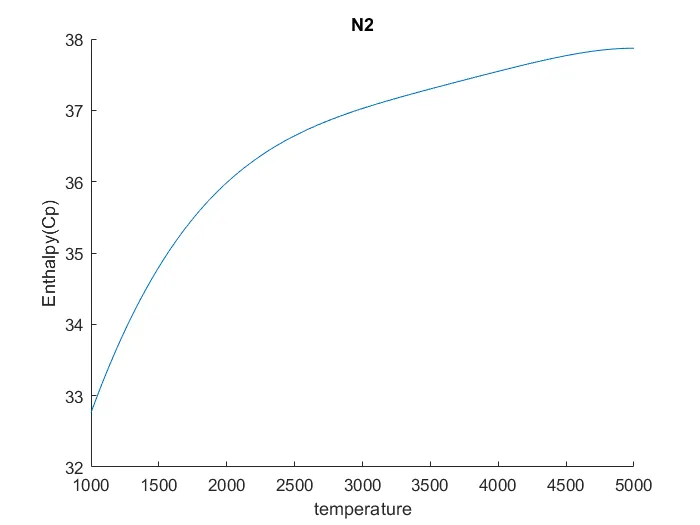
fig (10) enthalpy Vs temperature
CONCLUTION:
- The co-efficient values of each species is optained using fgetl command
- value of Cp,H and S is optained using the values of co-efficient
- The plot of Cp,H and S is ploted Vs temperature for all the species
ATTACHMENT: