Project 1 - Parsing NASA thermodynamic data
AIM -
- Write a function that extracts the 14 co-efficients and calculates the enthalpy, entropy and specific heats for all the species in the data file.
- To calculate the molecular weight of each species.
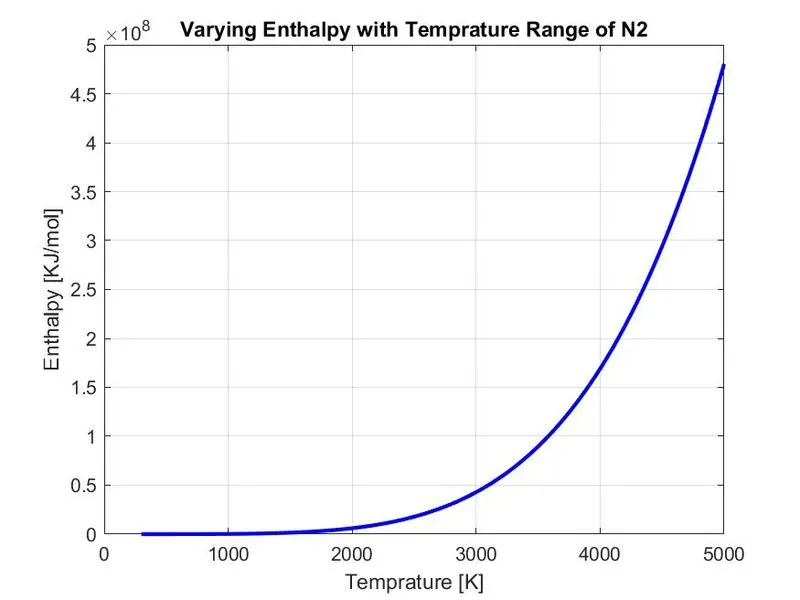
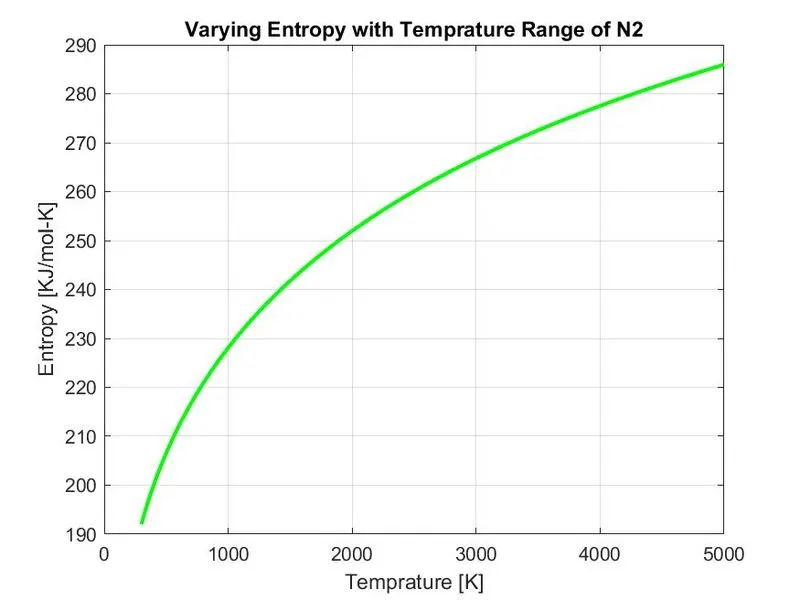
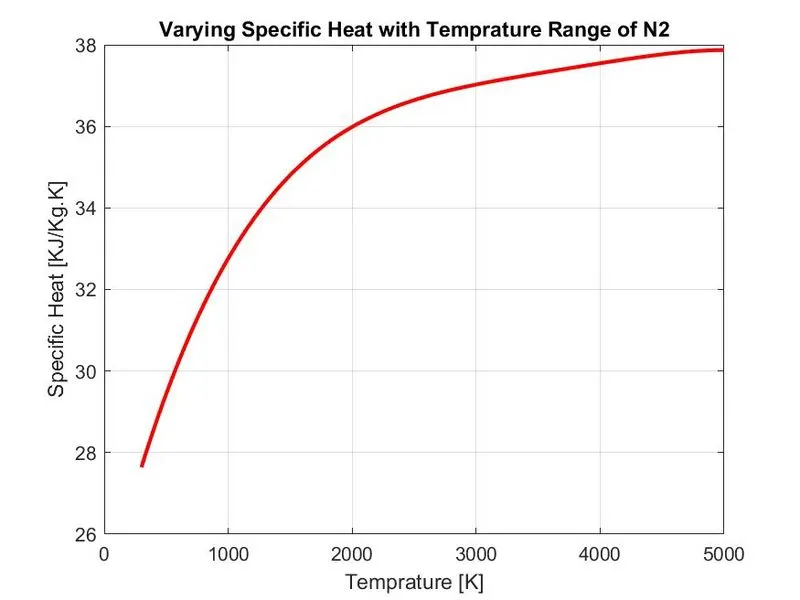
- To plot the Cp, Enthalpy and Entropy for the local temperature range (low temperature : high temperature) specific for each species.
PRE-REQUISITE KNOWLEDGE :
FILE PARSING - It is the splitting of file into pieces of data that can be easily stored.
WHY PARSING FUNCTIONS - Because user input is always in the form of strings.
GOVERNING EQUATIONS :
`(Cp)/R=aunderset(1)()+aunderset(2)()T+aunderset(3)()T^2+aunderset(4)()T^3+aunderset(5)()T^4`
`(H)/R=aunderset(1)()+aunderset(2)()T/2+aunderset(3)()(T^2)/3+aunderset(4)()(T^3)/4+aunderset(5)()(T^4)/5+(aunderset(6)())/T`
`(S)/R=aunderset(1)()lnT+aunderset(2)()T+aunderset(3)()(T^2)/2+aunderset(4)()(T^3)/3+aunderset(5)()(T^4)/4+aunderset(7)()`
where,
R `rarr` universal gas constant
T `rarr` temprature
`aunderset(1)(), aunderset(2)(), aunderset(3)(), aunderset(4)(), aunderset(5)(), aunderset(6)(), aunderset(7)()` `rarr` high temprature coefficients
`aunderset(8)(), aunderset(9)(), aunderset(10)(), aunderset(11)(), aunderset(12)(), aunderset(13)(), aunderset(14)()` `rarr` low temprature coefficient
FUNCTIONS USED :
fopen(filename, permission) `rarr` opens the file
getl(filenameid) `rarr` returns the next line of the specified file
strsplit(str,'delimiter') `rarr` slpits the str at the delimiters specified by delimiter
str2double(chr) `rarr` converts the text in str to double precision values, str contains text that represents real or complex numeric values.
findstr(str1, str2) `rarr` searches the longer of the two input strings for any occurances of the shorter string
strcmp() `rarr` takes two input arguments and returns either true or false
mkdir('dirname') `rarr` creates the specified folder and returns a status of 1 if the operation is successfull or if the folder exists.
cd(newfolder) `rarr` changes the current folder to new folder
saveas(fig,filename) `rarr` saves the figure specified by the figure to file name
EXPLAINATION :
- Reading the file
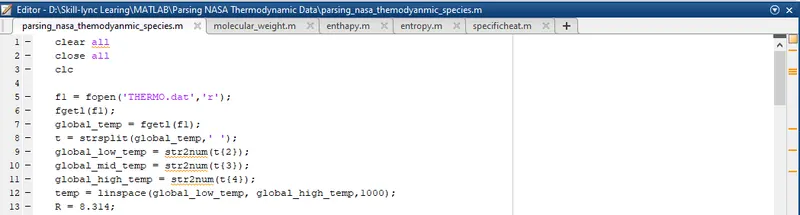
- Skipping the first 3 lines of the text file. Because these three statements are irrelevent

- Reading the species and the global tempratures. This reamains same for the next 53 species and hence for loop is used
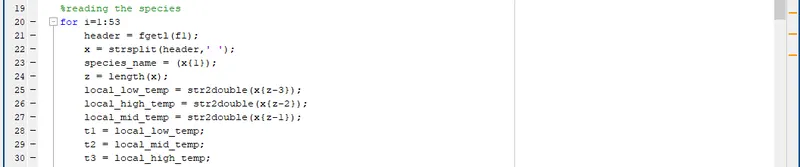
- Reading the first line the coefficients. In order to get the co-efficient we need to find the variable 'E' by using this as the reference. This remains same for second and third line

- Reading the second line the coefficients

- Reading the third line the coefficients

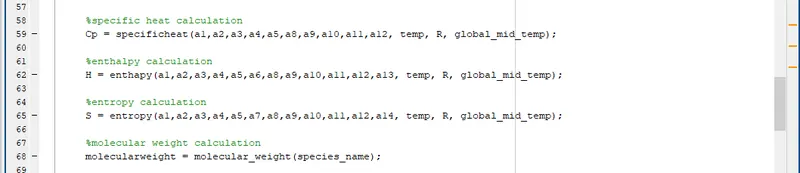
- Calling the functions
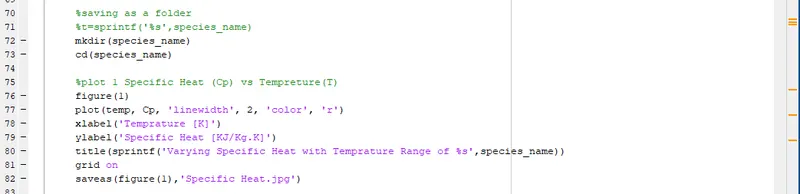
- Plotting and saving in a folder
MAIN CODE:
%main code
clear all
close all
clc

f1 = fopen('THERMO.dat','r');
fgetl(f1);
global_temp = fgetl(f1);
t = strsplit(global_temp,' ');
global_low_temp = str2num(t{2});
global_mid_temp = str2num(t{3});
global_high_temp = str2num(t{4});
temp = linspace(global_low_temp, global_high_temp,1000);
R = 8.314;

%skipping the 3 lines in the file
for i=1:3
    fgetl(f1);
end
%reading the species
for i=1:53
    header = fgetl(f1);
    x = strsplit(header,' ');
    species_name = (x{1});
    z = length(x);
    local_low_temp = str2double(x{z-3});
    local_high_temp = str2double(x{z-2});
    local_mid_temp = str2double(x{z-1});
    t1 = local_low_temp;
    t2 = local_mid_temp;
    t3 = local_high_temp;

    %gettting the first line of coefficients
    line_1 = fgetl(f1);
    a_1 = findstr(line_1,'E');
    a1 = str2double(line_1(1:a_1(1)+3));
    a2 = str2double(line_1(a_1(1)+4:a_1(2)+3));
    a3 = str2double(line_1(a_1(2)+4:a_1(3)+3));
    a4 = str2double(line_1(a_1(3)+4:a_1(4)+3));
    a5 = str2double(line_1(a_1(4)+4:a_1(5)+3));

    %gettting the second line of coefficients
    line_2 = fgetl(f1);
    a_2 = findstr(line_2,'E');
    a6 = str2double(line_2(1:a_2(1)+3));
    a7 = str2double(line_2(a_2(1)+4:a_2(2)+3));
    a8 = str2double(line_2(a_2(2)+4:a_2(3)+3));
    a9 = str2double(line_2(a_2(3)+4:a_2(4)+3));
    a10 = str2double(line_2(a_2(4)+4:a_2(5)+3));

    %gettting the third line of coefficients
    line_3 = fgetl(f1);
    a_3 = findstr(line_3,'E');
    a11 = str2double(line_3(1:a_3(1)+3));
    a12 = str2double(line_3(a_3(1)+4:a_3(2)+3));
    a13 = str2double(line_3(a_3(2)+4:a_3(3)+3));
    a14 = str2double(line_3(a_3(3)+4:a_3(4)+3));

    %specific heat calculation
    Cp = specificheat(a1,a2,a3,a4,a5,a8,a9,a10,a11,a12, temp, R, global_mid_temp);

    %enthalpy calculation
    H = enthapy(a1,a2,a3,a4,a5,a6,a8,a9,a10,a11,a12,a13, temp, R, global_mid_temp);

    %entropy calculation
    S = entropy(a1,a2,a3,a4,a5,a7,a8,a9,a10,a11,a12,a14, temp, R, global_mid_temp);

    %molecular weight calculation
    molecularweight = molecular_weight(species_name);

    %saving as a folder
    %t=sprintf('%s',species_name)
    mkdir(species_name)
    cd(species_name)

    %plot 1 Specific Heat (Cp) vs Tempreture(T)
    figure(1)
    plot(temp, Cp, 'linewidth', 2, 'color', 'r')
    xlabel('Temprature [K]')
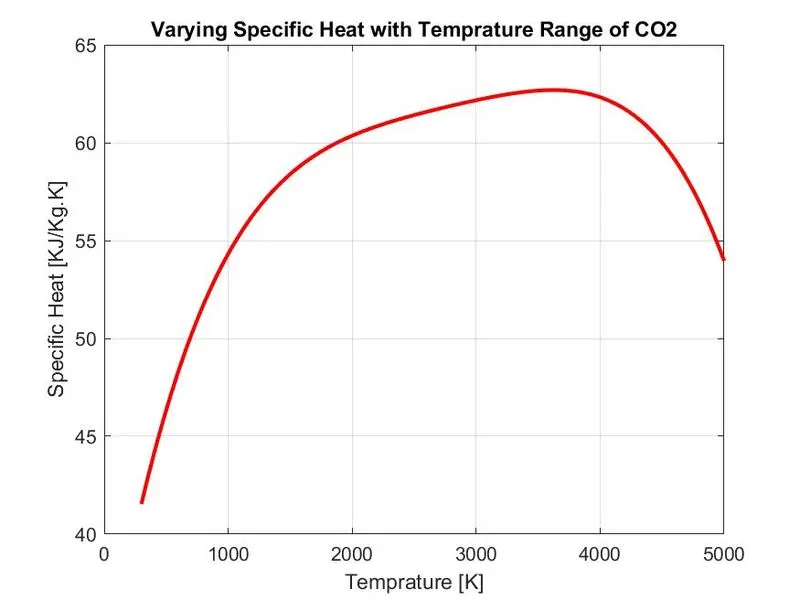
    ylabel('Specific Heat [KJ/Kg.K]')
    title(sprintf('Varying Specific Heat with Temprature Range of %s',species_name))
    grid on
    saveas(figure(1),'Specific Heat.jpg')

    %plot 2 enthalpy (H) vs Tempreture(T)
    figure(2)
    plot(temp, H, 'linewidth', 2, 'color', 'b')
    xlabel('Temprature [K]')
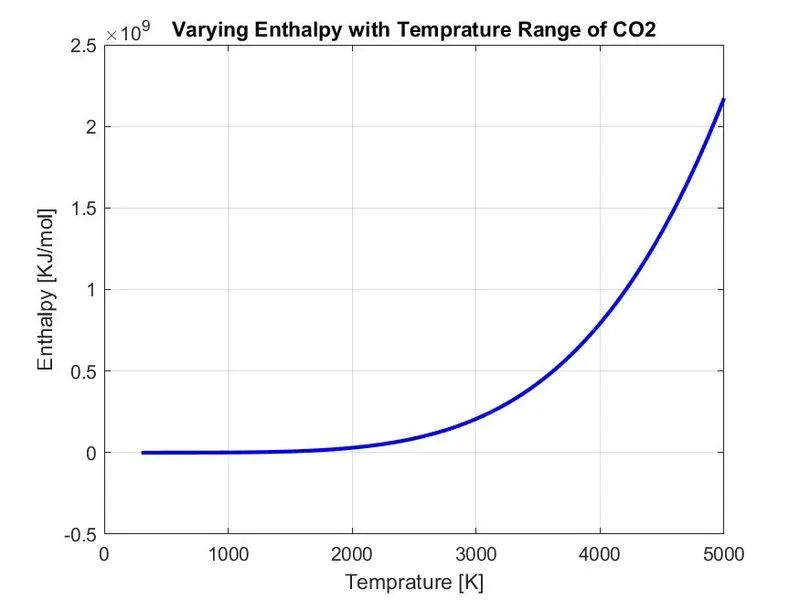
    ylabel('Enthalpy [KJ/mol]')
    title(sprintf('Varying Enthalpy with Temprature Range of %s',species_name))
    grid on
    saveas(figure(2),'Enthalpy.jpg')

    %plot 3 entropy (S) vs Tempreture(T)
    figure(3)
    plot(temp, S, 'linewidth', 2, 'color', 'g')
    xlabel('Temprature [K]')
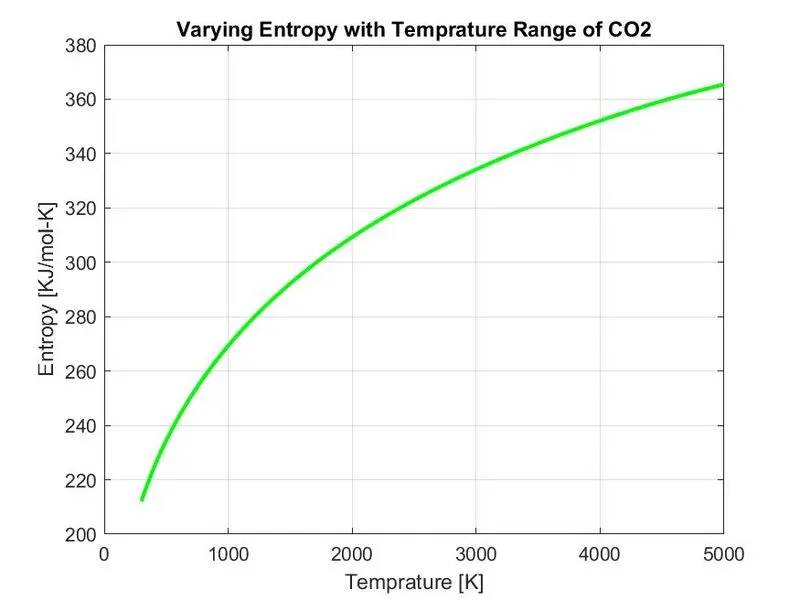
    ylabel('Entropy [KJ/mol-K]')
    title(sprintf('Varying Entropy with Temprature Range of %s',species_name))
    grid on
    saveas(figure(3),'Entropy.jpg')
    cd ..
end
FUNCTION CODE FOR SPECIFIC HEAT :
Amount of heat required to raise the temprature of a substance of 1 gram by 1 deg C.
%funtion for specific heat

function Cp = specificheat(a1,a2,a3,a4,a5,a8,a9,a10,a11,a12, temp, R, global_mid_temp)
if temp <= global_mid_temp
    Cp = R.*(a8 + (a9*temp) + (a10*temp.^2) + (a11*temp.^3) + (a12*temp.^4));
else
    Cp = R.*(a1 + (a2*temp) + (a3*temp.^2) + (a4*temp.^3) + (a5*temp.^4));
end
FUNCTION CODE FOR ENTHALPY :
Its the internal energy of the system plus the product of pressure and volume.
%funtion for enthalpy

function H = enthapy(a1,a2,a3,a4,a5,a6,a8,a9,a10,a11,a12,a13, temp, R, global_mid_temp)
if temp <= global_mid_temp
    H = R.*temp.*(a8 + (a9*temp)./2 + (a10*temp.^2)./3 + (a11*temp.^4)./4 + (a12*temp.^5)./5 + a13./temp);
else
    H = R.*temp.*(a1 + (a2*temp)./2 + (a3*temp.^2)./3 + (a4*temp.^4)./4 + (a5*temp.^5)./5 + a6./temp);
end
FUNCTION CODE FOR ENTROPY :
Entropy is the measure of the disorder of a system. It is an extensive property of a thermodynamic system, which means its value changes depending on the amount of matter that is present.
%funtion for entropy

function S = entropy(a1,a2,a3,a4,a5,a7,a8,a9,a10,a11,a12,a14, temp, R, global_mid_temp)
if temp <= global_mid_temp
    S = R.*(a8*log(temp) + a9*temp + (a10*temp.^2)./2 + (a11*temp.^3)./3 + (a13*temp.^4)./4 + a14);
else
    S = R.*(a1*log(temp) + a2*temp + (a3*temp.^2)./2 + (a4*temp.^3)./3 + (a5*temp.^4)./4 + a7);
end
FUNCTION CODE FOR MOLECULAR WEIGHT :
Molecular weight, also called molecular mass, mass of a molecule of a substance, based on 12 as the atomic weight of carbon-12. It is calculated in practice by summing the atomic weights of the atoms making up the substance's molecular formula.
%function for molecular weight of the given species

function molecularweight = molecular_weight(species_name)
atomic_name = ['H','C','O','N','A'];
atomic_weight = [1.008 12.011 15.999 14.007 39.948];
molecularweight = 0;
for i=1:length(species_name)
    for j=1:length(atomic_name)
        if strcmpi(species_name(i),atomic_name(j))
            molecularweight = molecularweight + atomic_weight(j);
            position = j;
        end
    end
    n = str2double(species_name(i));
    if n>1
        molecularweight = molecularweight + atomic_weight(position)*(n-1);
    end
end
fprintf('Molecular Weight of %s : %4.5f \n', species_name, molecularweight);
end
RESULTS :
The program was written and executed.
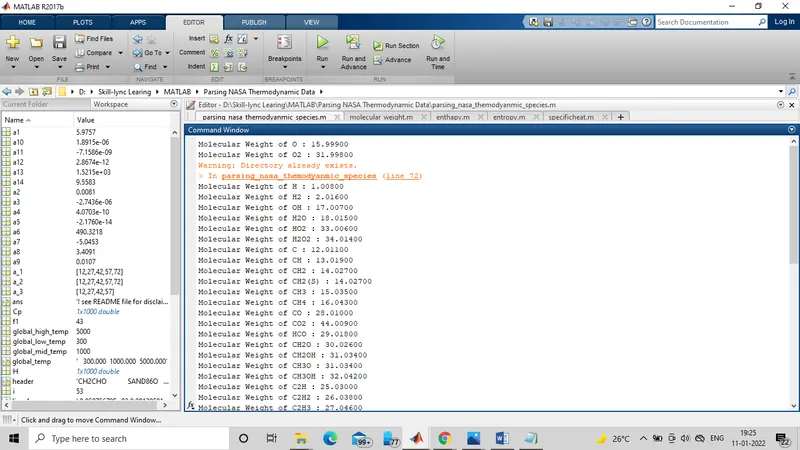
- Screenshots of the molecualar weight of the species.
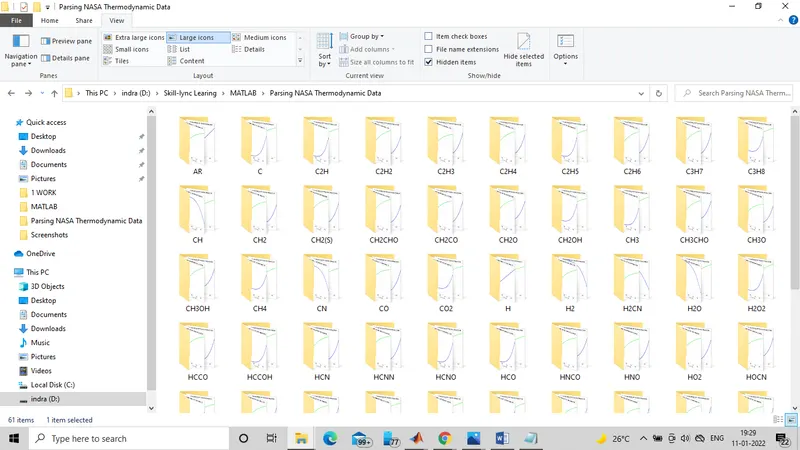
- Screenshot of the folders in which all the plots are saved.
- Plot for `Ounderset2`
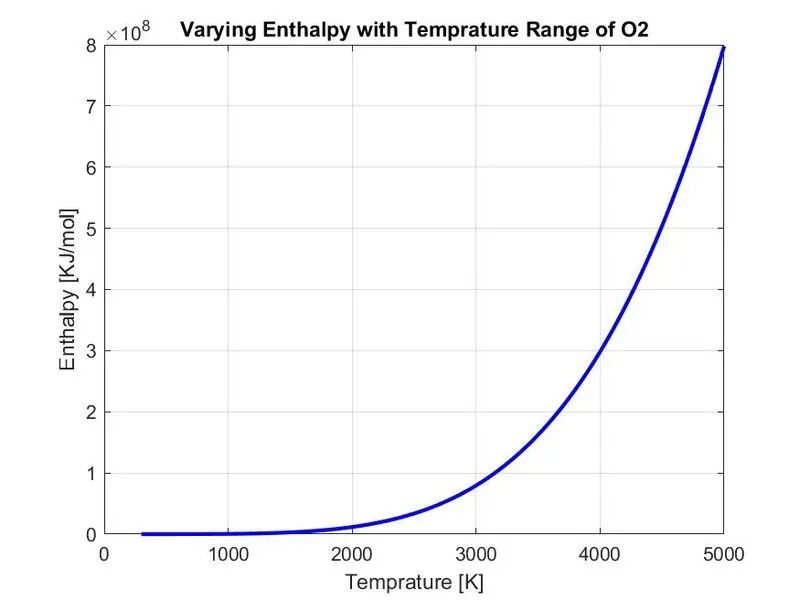
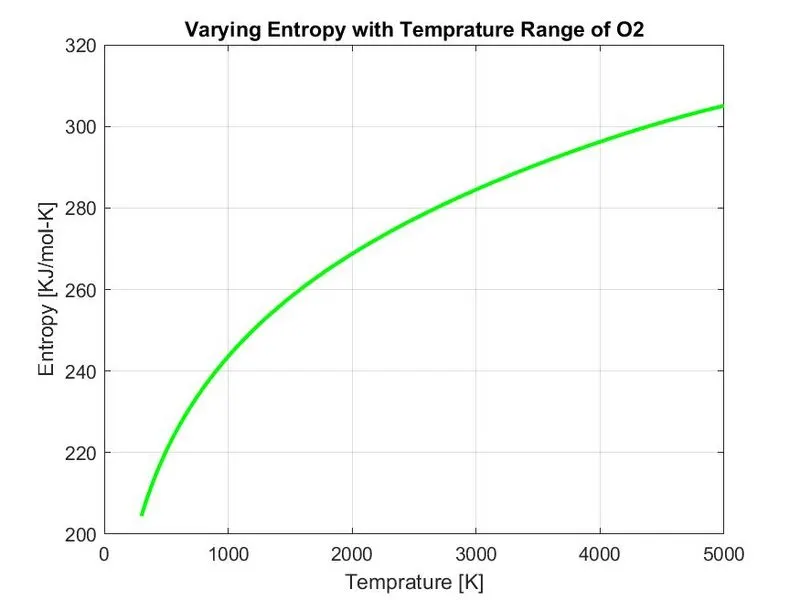
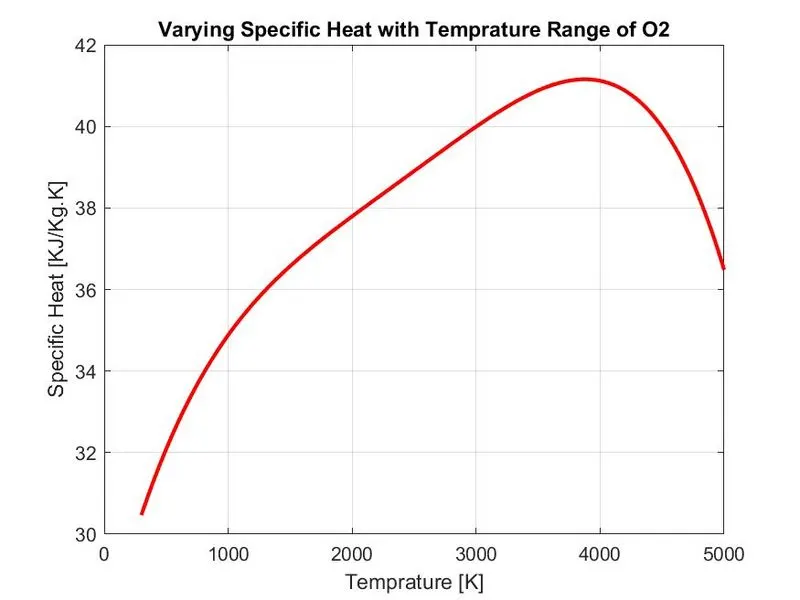
- Plot for `Nunderset2`
- Plot for `COunderset2`