Parsing NASA thermodynamic data
Aim: To write a code in Matlab/Octave to parse the NASA thermodynamic data file and then calculate thermodynamic properties of various gas species.
Objectives:
- To write a function that extracts the 14 coefficients for a given species from the given file.
- To write functions that calculate the enthalpy, entropy and specific heats using the NASA polynomials.
- To write a function that calculates the molecular weight of each species.
- To write a function that plots the Cp, Enthalpy and Entropy of an input species.
Governing Equations:
The value of Universal gas constant R = 8.314J/mol-K was declared. Based upon the 14 coefficients and the value of R the values of Specific heat, Enthalpy and Entropy were calculated for each species by using the following formulas.
`Cp = R(C1 + C2*T +C3*T^2 + C4*T^3 + C5*T^4)`
`H = RT(C1 + C2*T/2 + C3*T^2/3 + C4*T^3/4 + C5*T^4/5 + C6/T)`
`S = R(C1*ln(T) + C2*T + C3*T^2/2 + C4*T^3/3 + C5*T^4/4 + C7)`
MATLAB CODE:
Main Program:
%File parsing Program
%Author: Asad Salah (B.E Mechanical)
clear all
close all
clc
%gas Constant
R=8.314;
f1=fopen('THERMO.DAT','r');
%Reading Header
header=fgetl(f1);
overalglobaltemperatureranges=fgetl(f1);
a=strsplit(overalglobaltemperatureranges,' ');
%defining global temprature
low_global_temperature=str2num(a{2});
medium_global_temperature=str2num(a{3});
high_global_temperature=str2num(a{4});
for i=1:3;
    erase=fgetl(f1);
end
%parsing for the species
for j=1:53;
 overal_local_temperature_ranges=fgetl(f1);
b=strsplit(overal_local_temperature_ranges,' ');
low_local_temperature=str2num(b{end-3});
medium_local_temperature=str2num(b{end-1});
high_local_temperature=str2num(b{end-2});
species_name=b{1};
temperature_range=linspace(low_local_temperature,high_local_temperature,200);
coef_line_1=fgetl(f1);
coef_line_2=fgetl(f1);
coef_line_3=fgetl(f1);
% Calculating the Values of cofficients
x=findstr(coef_line_1,'E');
a1=str2num(coef_line_1(1:x(1)+3));
a2=str2num(coef_line_1(x(1)+4:x(2)+3));
a3=str2num(coef_line_1(x(2)+4:x(3)+3));
a4=str2num(coef_line_1(x(3)+4:x(4)+3));
a5=str2num(coef_line_1(x(4)+4:x(5)+3));

y=findstr(coef_line_2,'E');
a6=str2num(coef_line_2(1:y(1)+3));
a7=str2num(coef_line_2(y(1)+4:y(2)+3));
a8=str2num(coef_line_2(y(2)+4:y(3)+3));
a9=str2num(coef_line_2(y(3)+4:y(4)+3));
a10=str2num(coef_line_2(y(4)+4:y(5)+3));

z=findstr(coef_line_3,'E');
a11=str2num(coef_line_3(1:z(1)+3));
a12=str2num(coef_line_3(z(1)+4:z(2)+3));
a13=str2num(coef_line_3(z(2)+4:z(3)+3));
a14=str2num(coef_line_3(z(3)+4:z(4)+3));


% Calculating the Values of Cp, Enthalpy and Entropy
[cp h s] = thermodynamic_properties(a1,a2,a3,a4,a5,a6,a7,a8,a9,a10,a11,a12,a13,a14,R,temperature_range,medium_global_temperature);
     % Calculating the Molecular Weight Of Species
[molecular_weight(j)]=molecular_mass(species_name);

 %plotting the graphs
set(0,'DefaultFigureVisible','off')
m(1)=figure;
plot(temperature_range,cp,'linewidth',3,'color','g');
xlabel('Temperature (K)');
ylabel('Specific Heat (J/kg-K)');
title(['Specific Heat vs Temperature ',species_name]);


 m(2)=figure ;
 plot(temperature_range,h,'linewidth',3,'color','r');
 xlabel('Temperature (K)');
 ylabel('Enthalpy (J/kg)');
 title(['Enthalpy vs Temperature ',species_name]);

 m(3)=figure ;
 plot(temperature_range,s,'linewidth',3,'color','y');
 xlabel('Temperature (K)');
 ylabel('Entropy (J/kg-K)');
 title(['Entropy vs Temperature ',species_name]);

 % Display data
    fprintf ('Species Name : %6s     ',species_name)
    fprintf ('Molecular Weight : %15s n',molecular_weight(j))

    cd('C:UsersAsad SalahDesktopmatlab challengesFile Parsing NASA');
    mkdir(species_name);
    cd(species_name);
    % Saving as .jpg for windows explorer
    saveas(m(1),'specific_heat_vs_Temp.jpg');
    saveas(m(2),'enthalpy_vs_Temp.jpg');
    saveas(m(3),'entropy_vs_Temp.jpg');
    % Saving as .fig for MATLAB
    saveas(m(1),'specific_heat_vs_Temp.fig');
    saveas(m(2),'enthalpy_vs_Temp.fig');
    saveas(m(3),'entropy_vs_Temp.fig');


    %saving data to file
    f2 = fopen('data_parsing.txt','w');
    fprintf (f2, '%15s : %15s n','Species Name',species_name);
    fprintf (f2, '%15s : %15.3s n','MolecularWeight',molecular_weight(j));
    fprintf (f2, 'For the Local Temeprature Range : %3.1fK to %3.1fK nn',low_local_temperature, high_local_temperature);
    fprintf (f2, '%6s %6s %16s %16s n','Temperature(K)','Specific Heat(J/K)','Enthalpy(J/kg)','Entropy(J/K)');
    fprintf (f2, '%11.2f %17.2f %19.2f %20.2f n',temperature_range,cp,h,s);


    cd ('C:UsersAsad SalahDesktopmatlab challenges');
end


fprintf('The Input File has been stored')

% Getting input From User To Display Plots
    Input = input('/n Do you require Data for Specific Species? (Y/N) : ','s')

if strcmpi(Input,'Y')
    Name = input ('Provide the Name of Species : ','s')
    cd('C:UsersAsad SalahDesktopmatlab challengesFile Parsing NASA')
    cd (Name)
    openfig('specific_heat_vs_Temp','visible');
    openfig('enthalpy_vs_Temp','visible');
    openfig('entropy_vs_Temp','visible');
    fprintf ('The Plots Corresponding to the Species have been Opened')
    fprintf ('/n The Program has ended..')

elseif strcmpi(Input,'N')
    fprintf (' The Program has ended ')

else
    fprintf ('Invalid Input')
    fprintf ('The Program has ended')
end
Function:
%Function to calculate molecular masses
function Molecular_Mass = molecular_mass(species_name)

species = upper(species_name);

Constituents = ['H', 'C', 'N', 'O', 'A'];

Atomic_weight = [1.00794 12.0107 14.0067 15.9994 39.948];

Molecular_Mass = 0;

for i=1:length(species)
    for j=1:length(Constituents)
        if strcmp(species(i),Constituents(j))
           Molecular_Mass = Molecular_Mass + Atomic_weight(j);
           u = j;
        end
    end
    n = str2num(species(i));
    if n>1
        Molecular_Mass = Molecular_Mass + Atomic_weight(u)*(n-1);
    end
end
end
Function:
%function to calculate thermodynamic properties of gas.
function[cp,h,s]=thermodynamic_properties(a1,a2,a3,a4,a5,a6,a7,a8,a9,a10,a11,a12,a13,a14,R,temperature_range,medium_global_temperature)
for k=1:length(temperature_range);
if temperature_range(k)>medium_global_temperature
    cp(k)=R.*(a1+(a2.*temperature_range(k))+(a3.*(temperature_range(k)).^2)+(a4.*(temperature_range(k)).^3)+(a5.*(temperature_range(k).^4)));
    h(k)=R.*temperature_range(k).*(a1+(a2.*temperature_range(k))./(2)+(a3.*(temperature_range(k)).^2)./(3)+(a4.*(temperature_range(k)).^3)./(4)+(a5.*(temperature_range(k)).^4)./(5)+(a6)./(temperature_range(k)));
    s(k)=R.*((a1.*log(temperature_range(k)))+(a2.*temperature_range(k))+(a3.*(temperature_range(k)).^2)./(2)+(a4.*(temperature_range(k)).^3)./(3)+(a5.*(temperature_range(k)).^4)./(4)+(a7));

    else
    cp(k)=R.*(a8+(a9.*(temperature_range(k))+(a10.*(temperature_range(k)).^2)+(a11.*(temperature_range(k)).^3)+(a12.*(temperature_range(k)).^4)));

    h(k)=R.*temperature_range(k).*(a8+(a9.*temperature_range(k))./(2)+(a10.*(temperature_range(k)).^2)./(3)+(a11.*(temperature_range(k)).^3)./(4)+(a12.*(temperature_range(k)).^4)./(5)+(a13)./(temperature_range(k)));
    s(k)=R.*((a8.*log(temperature_range(k)))+(a9.*temperature_range(k))+(a10.*(temperature_range(k)).^2)./(2)+(a11.*(temperature_range(k)).^3)./(3)+(a12.*(temperature_range(k)).^4)./(4)+a14);
end
end
Results and Outputs:
Output Folders:

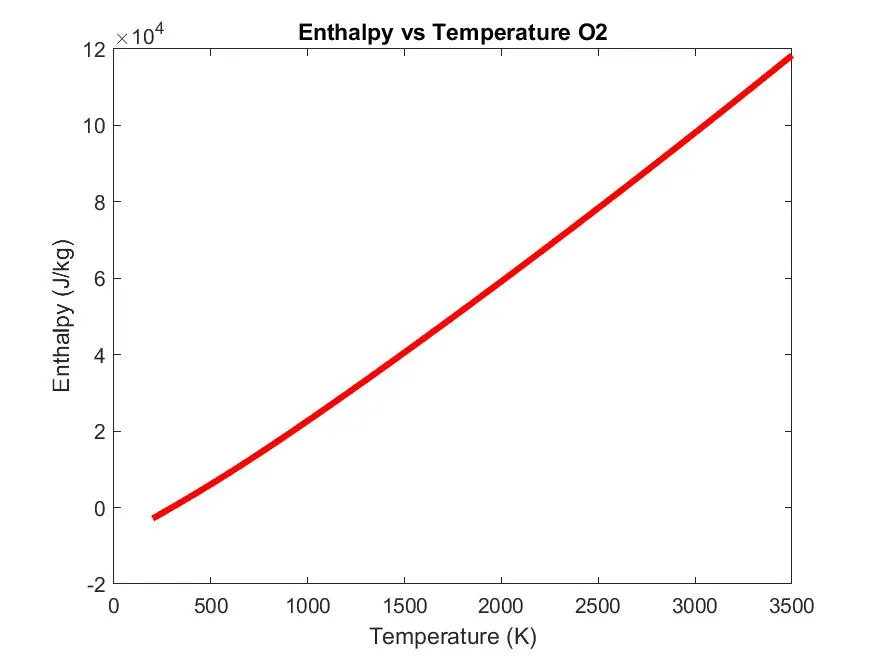
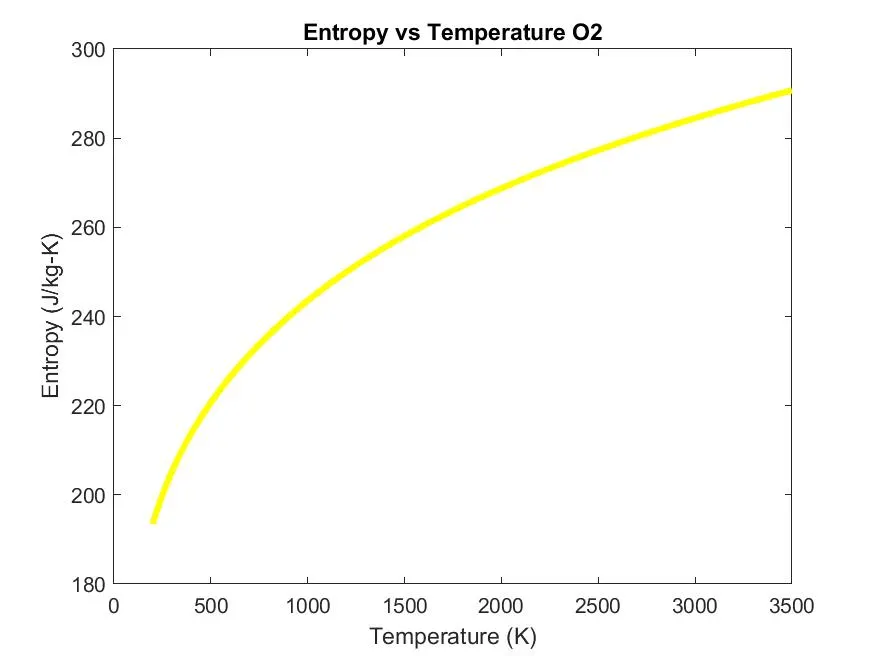
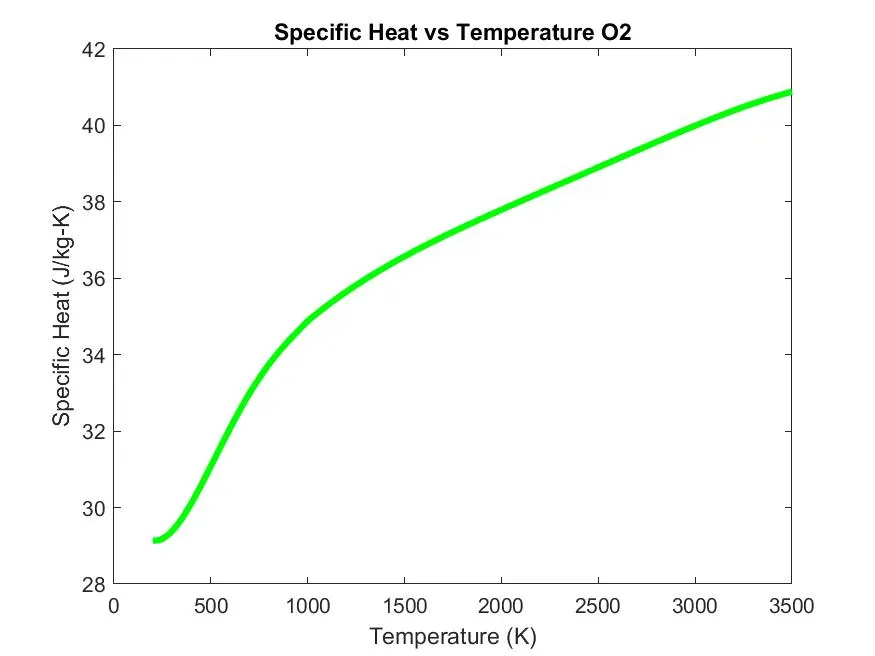
Graphs of O2: