Project 1 - Parsing NASA thermodynamic data
Here file Parsing is nothing but reading the required data from a file and using it for the purpose . Many Thermodynamic calculations will be carried out by some respective data books for solving.
In File Parsing , we have two things , one is Reading the data , and the next one is writing the data by using Matlab codes.
For the given task we need to get the data from the existing file and organise it according to the requirement. So some of the functions can be included for the repeated calculations.
In file parsing , we need to load the data which is required for the calculations.
1) Here our main aim is to calculate the Thermal properties like SPECIFIC HEAT , ENTHALPY , ENTROPY of the given species in the Data file. For this purpose we need to find the co-efficient values for the given variables in the formulae and also for the Given range of Temperature values.
2) We need to calculate the Molecular weights of the each species and we should plot the graphs between the Temperature and the Thermal Propertis of each species.
3) So after this we need to write the calulated values to a defined file ( File Parsing Comes into Picture)
Answer :
Step 1) For calculating the Coefficient values we will set a Range of temperature values through a pre-defined function as follows.
function[cp h s] = thermodynamic_properties(a1,a2,a3,a4,a5,a6,a7,a8,a9,a10,a11,a12,a13,a14,R,T,global_low_temp,global_mid_temp,global_high_temp)

for j = 1:length(T)
    if T(j)<=global_mid_temp
        %Relations used if T(j)<=global_mid_temp

        cp = (a1 + a2.*T + a3.*T.^2 + a4.*T.^3 + a5.*T.^4).*R;
        h  = (a1 + (a2.*T)./2 + (a3.*T.^2)./3 + (a4.*T.^3)./4 + (a5.*T.^4)./5 + (a6./T)).*R.*T;
        s  = (a1.*log(T) + a2.*T + (a3.*T.^2)./2 + (a4.*T.^3)./3 + (a5.*T.^4)./4 + a7).*R;

        %Relations used if T(j) > global_mid_temp
    else

        cp = (a8 + a9.*T + a10.*T.^2 + a11.*T.^3 + a12.*T.^4).*R;
        h  = (a8 + (a9.*T)./2 + (a10.*T.^2)./3 + (a11.*T.^3)./4 + (a12.*T.^4)./5 + (a13./T)).*R.*T;
        s  = (a8.*log(T) + a9.*T + (a10.*T.^2)./2 + (a11.*T.^3)./3 + (a12.*T.^4)./4 + a14).*R;

    end
end
end
Foe each species from the data file , we have 14 co-effiecients . where the First Seven Co-eff are of lowtemperature , and the next Seven Co-Efficients are of high temperature.
for collecting the appropriate co-effiecient based on the Temperature value we have used if and else condition.
Step 2) Function or calculating Molecular Weight is as below
function[molecular_weight] = mole_wt(species_name)
SPECIES =upper(species_name);
constituents = {'H','C','N','O','A'};
%Atoomic weiht of each elements
atomic_weight = [1 12 14 16 40];
molecular_weight = 0;
for i=1:length(SPECIES)
    for j=1:length(constituents)
        if strcmp(SPECIES(i),constituents(j))
            molecular_weight = molecular_weight + atomic_weight(j);
            %storing the position of matched element
            u=j;

        end
    end
    n=str2double(SPECIES(i));
    if n>1
        molecular_weight = molecular_weight + atomic_weight(u)*(n-1);
    end
end
* A string array is created for providing the elements from the file data.
* an array for storing the atomic weights of the elements following the elements in the previous array
* if strcmp gives positive result , molecular weight will be calculated by the given formula.
* if the repetetion of the element is occured , the code follows the calaculation of molecular weight by using Atomic_weight(u)*(n-1).
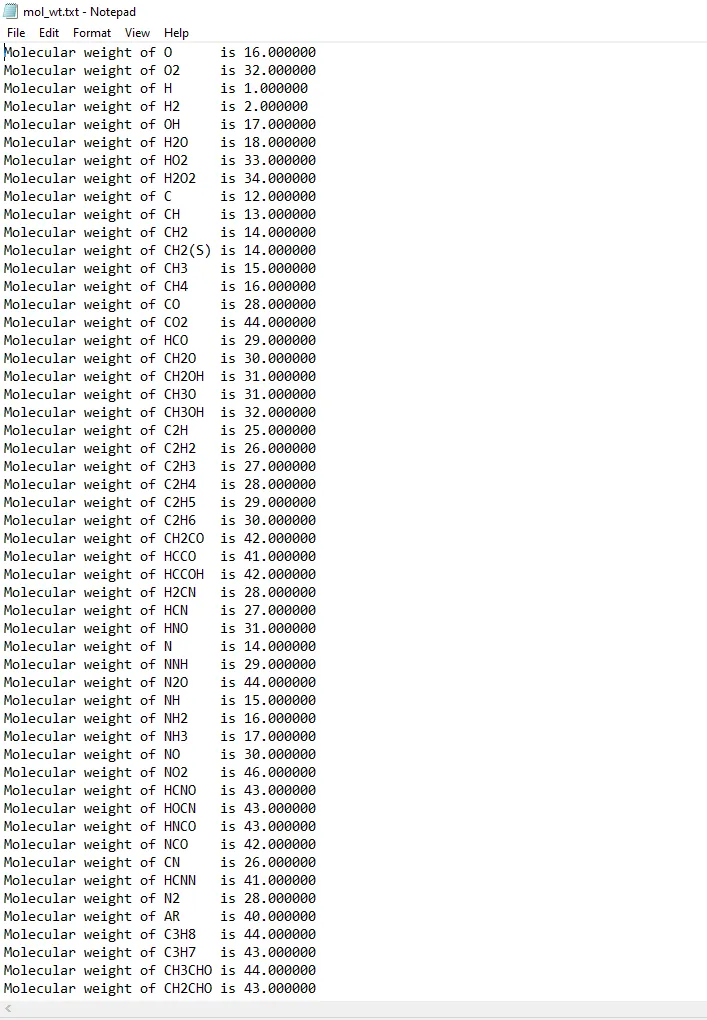
Step 3 ) Function for Writing molecular weight and respective species name to defined file
function filing_the_data(species_name,weight)
dir_name = species_name;
mol_file = fopen('mol_wt.txt','a+');
fprintf(mol_file, 'Molecular weight of %s is %f \n',dir_name,weight);
fclose(mol_file);
end
A new file is opened in append mode , so that we can collect and load the file with all the iterations thought out the species list.
Step 4 ) Main code for the task and will be followed by the results.
clear all
close all
clc

%We Have inputs
R=8.314 ; %Value of gas constant

%Reading the thermodynamic data file
f1 = fopen('THERMO.dat','r');  %opening the file for reading
fgetl(f1);                     %Reading file Header
tline=fgetl(f1);               %Reading second line
A=strsplit(tline,' ');          %Splitting String into individual varibles

%Assining temperatures values from the split items
global_low_temp = str2double(A{2});
global_mid_temp = str2double(A{3});
global_high_temp = str2double(A{4});

%The next three lines can be ignored , we can use for loop for those three
%lines as follows
for i=1:3;
   comments=fgetl(f1);
end
%Now we need to extract the coeffecients of the each species , before that
%we need to extract the species names , considering 53 elements data

for i=1:53

species = fgetl(f1);
species_name = species(1:6)

%now it is turn for co-efficients
line1 = fgetl(f1);
L1 = strfind(line1,'E');
a1 = str2double(line1(1:(L1(1)+3)));
a2 = str2double(line1((L1(1)+4):(L1(2)+3)));
a3 = str2double(line1((L1(2)+4):(L1(3)+3)));
a4 = str2double(line1((L1(3)+4):(L1(4)+3)));
a5 = str2double(line1((L1(4)+4):(L1(5)+3)));

% Now Extracing the co-effs from second line
line2 = fgetl(f1);
L2 = strfind(line2,'E');

a6 = str2double(line1(1:(L2(1)+3)));
a7 = str2double(line1((L2(1)+4):(L2(2)+3)));
a8 = str2double(line1((L2(2)+4):(L2(3)+3)));
a9 = str2double(line1((L2(3)+4):(L2(4)+3)));
a10 = str2double(line1((L2(4)+4):(L2(5)+3)));

% Now Extracing the co-effs from third line
line3 = fgetl(f1);
L3 = strfind(line3,'E');

a11 = str2double(line1(1:(L3(1)+3)));
a12 = str2double(line1((L3(1)+4):(L3(2)+3)));
a13 = str2double(line1((L3(2)+4):(L3(3)+3)));
a14 = str2double(line1((L3(3)+4):(L3(4)+3)));

%creating a folder to save thermodynamic plots of the species
mkdir(['C:\Users\tarun\OneDrive\Desktop\MATLAB\project1assignments\PARSING_THE_DATA\Plots_of_',species_name]);

T = linspace(global_low_temp,global_high_temp,500);

%calling the Thermodynamic properties function
[cp h s] = thermodynamic_properties(a1,a2,a3,a4,a5,a6,a7,a8,a9,a10,a11,a12,a13,a14,R,T,global_low_temp,global_mid_temp,global_high_temp)

%Plotting the various possiblities of plotsfor species
%plot between Temperature and Specific Heat
figure(1)
plot(T,cp,'linewidth',3,'color','b')
title({'Specific Heat Vs Temperature',['species name = ',species_name]})
xlabel('TEMPERATURE (K)')
ylabel('SPECIFIC HEAT (J/kg-K)')

%plot between Temperature and Enthalpy
figure(2)
plot(T,h,'linewidth',3,'color','b')
title({'Enthalpy Vs Temperature',['species name = ',species_name]})
xlabel('TEMPERATURE (K)')
ylabel('ENTHALPY (J/kg)')

%plot between Temperature and Entropy
figure(3)
plot(T,s,'linewidth',3,'color','b')
title({'Entropy Vs Temperature',['species name = ',species_name]})
xlabel('TEMPERATURE (K)')
ylabel('ENTROPY (J/kg-K)')

%saving the plotted file in the system directory with the folder name
directory = (['C:\Users\tarun\OneDrive\Desktop\MATLAB\project1assignments\PARSING_THE_DATA\Plots_of_',species_name]);
cd(directory)

%saving plots
saveas(1,'specific_heat.png')
saveas(2,'enthalpy.png')
saveas(3,'entropy.png')

%Changing the directory for calculating molecular weight
cd('C:\Users\tarun\OneDrive\Desktop\MATLAB\project1assignments\PARSING_THE_DATA')
molecular_weight = mole_wt(species_name);

%Now printing molecular weight in command window
fprintf(species_name)
fprintf('molecular_weight of %s:- ',species_name)
fprintf('%d', molecular_weight)
fprintf(' ')
fprintf('amu')
fprintf('\n')

%Finally collecting the data and witing to the respective file for
%displaying them by using the write_to_file function

weight = mole_wt(species_name);
filing_the_data(species_name,weight);
end
fclose(f1)
OUTPUT :
1) Showing Molecular weight on command window.
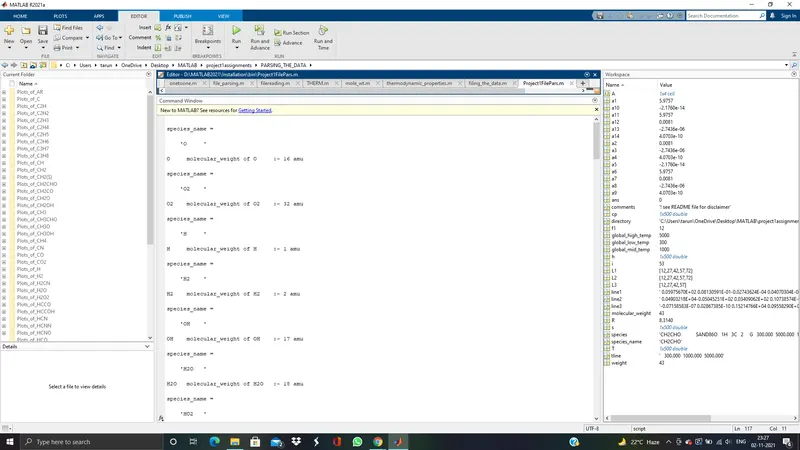
2) Folders of each species plots are saved in the diretory folder.

Plots for some of the species :
O2 :
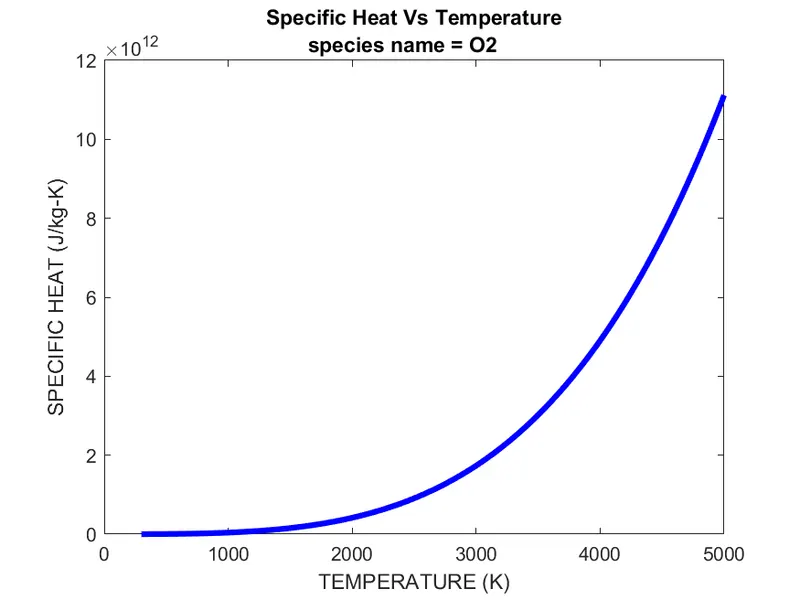
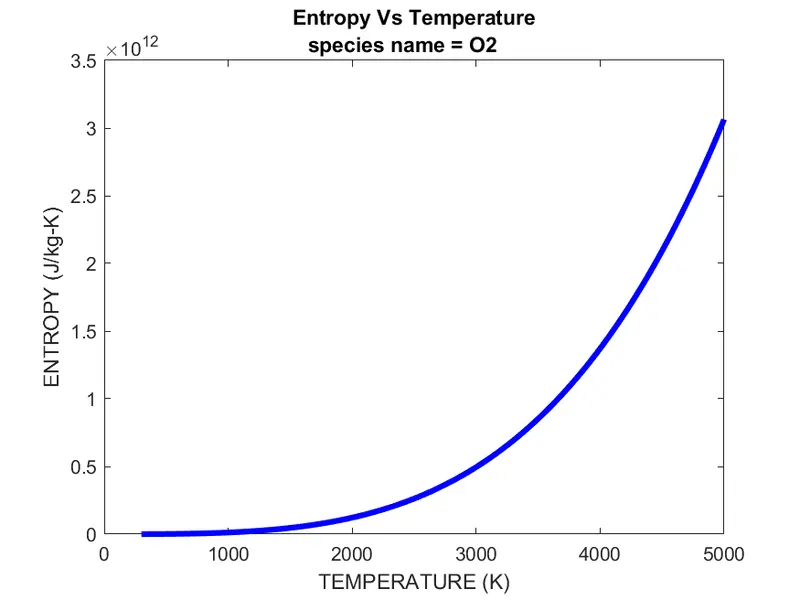
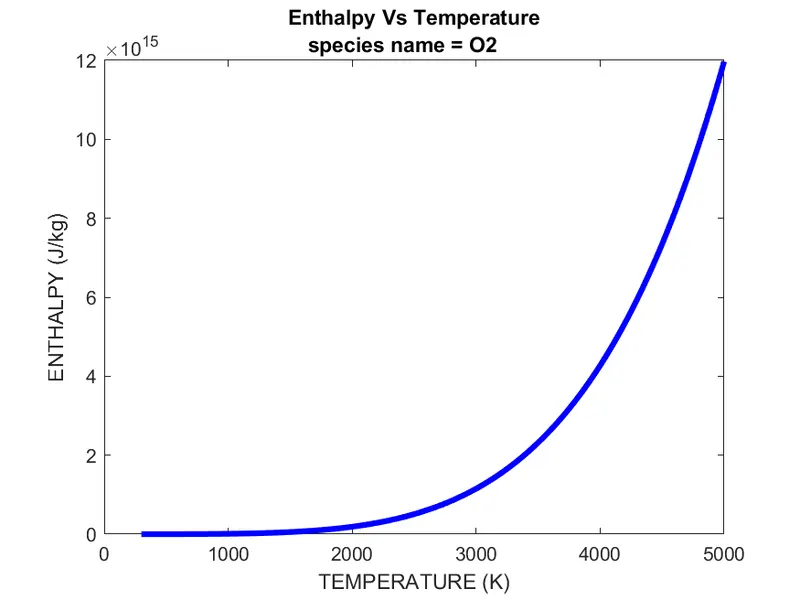
.Writing the molecular weights of species as follows ;
ERROR DETECTION : I have found most error in typo , and also file directory location.
the function which we are using should be saved in the Directory which we are giving to store the plots and also the text file. Other wise it will show an error that the function is not defined.
Function name should not be same as script keywords.
.
Concluson : Byusing File Parsing and respective string functions , we can able to load the data and convert them into required inputs for the desired Calculations.
Thank you.