Project 1 - Parsing NASA thermodynamic data
Parsing NASA thermodynamic data
Aim: To write the program that parses the given NASA thermodynamic data file in the MATLAB.
Objective:
- To write a function that extracts the 14 co-efficients and calculates the enthalpy, entropy and specific heats for all the species in the data file.
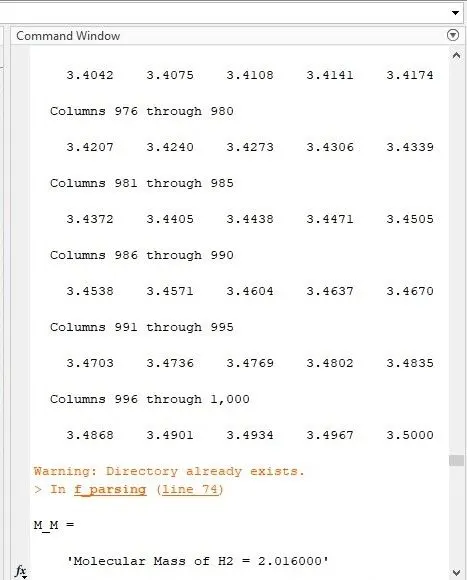
- To calculate the molecular weight of each species.
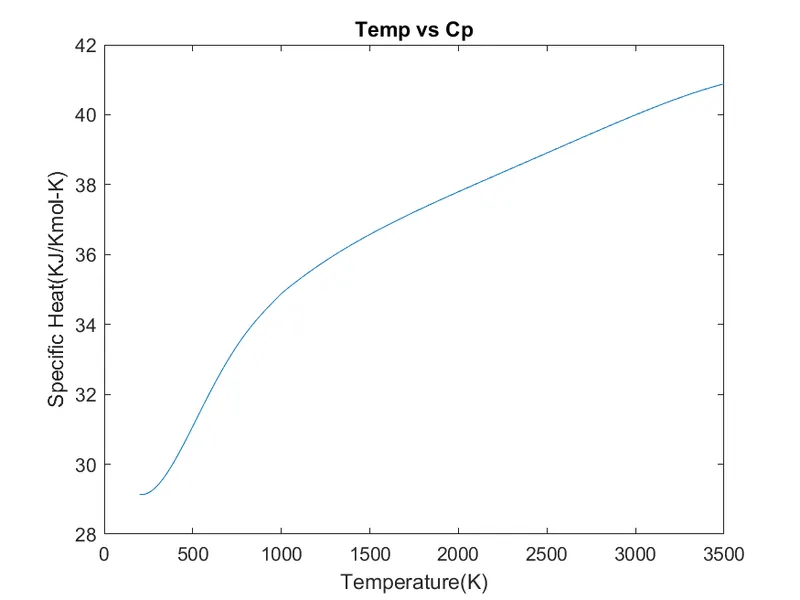
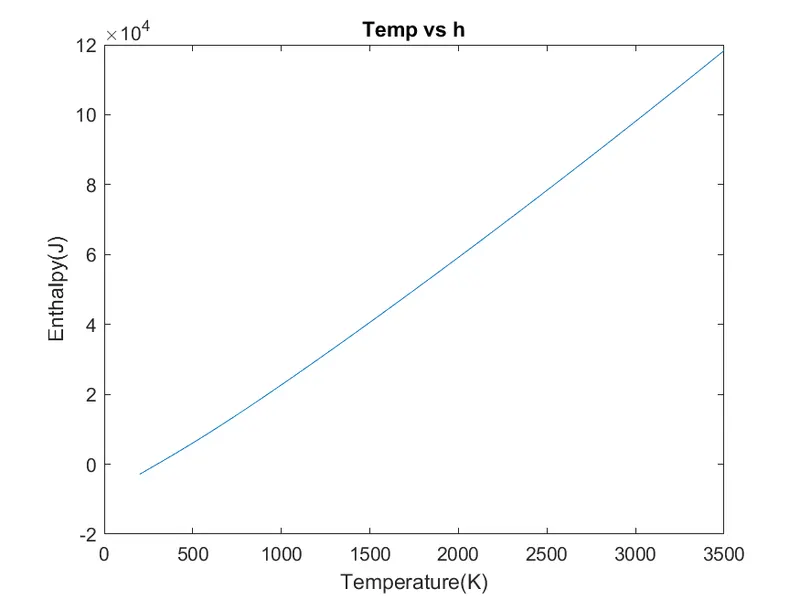
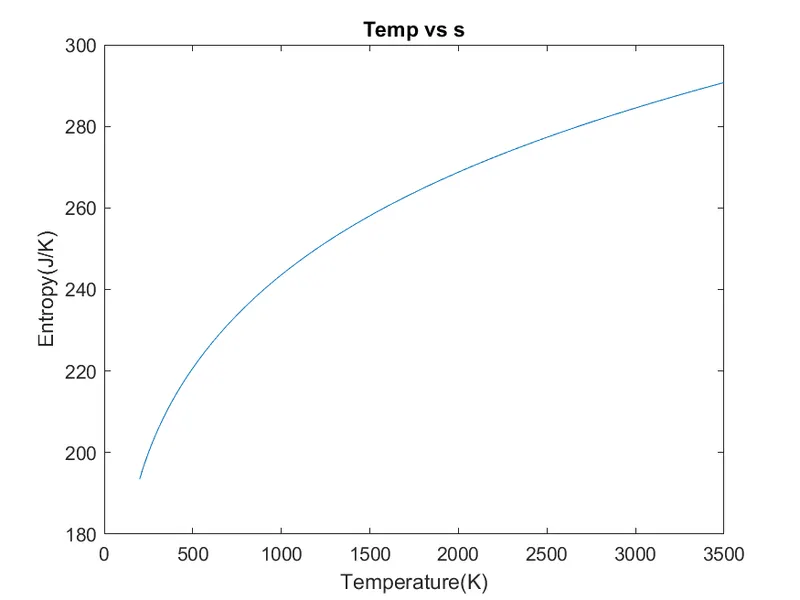
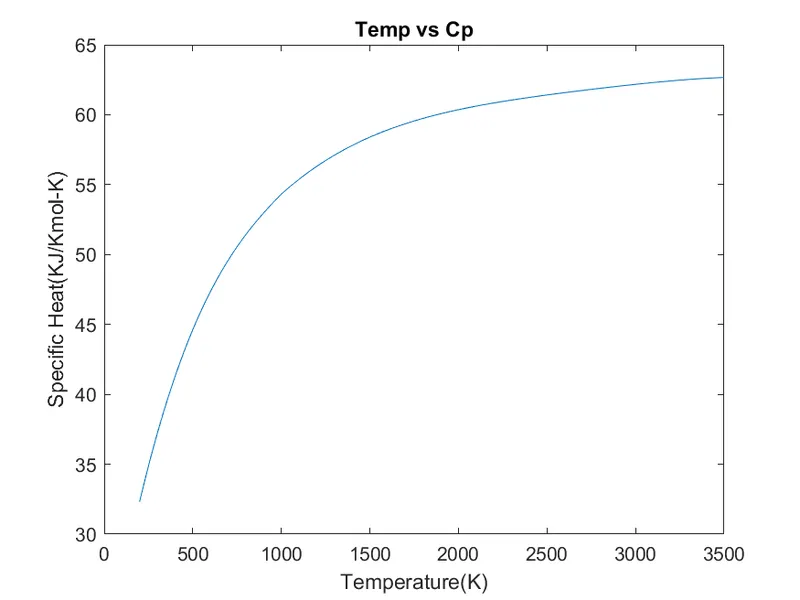
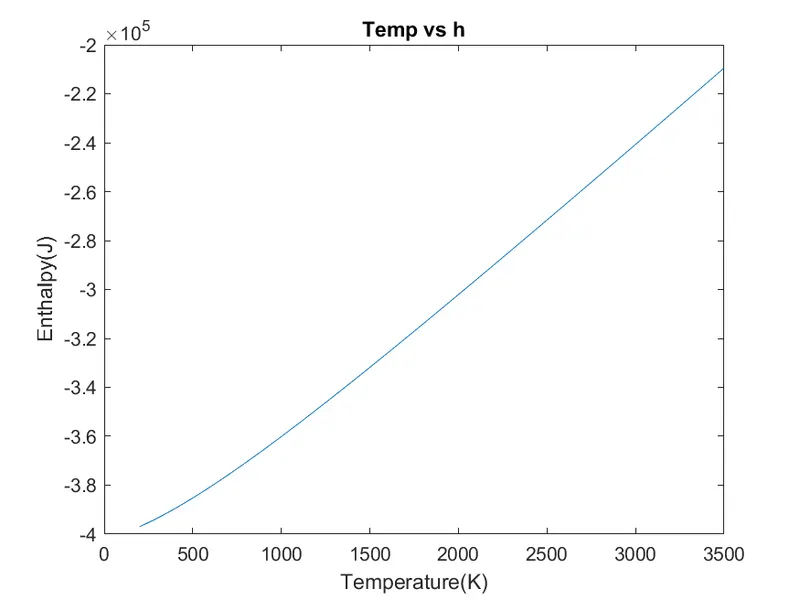
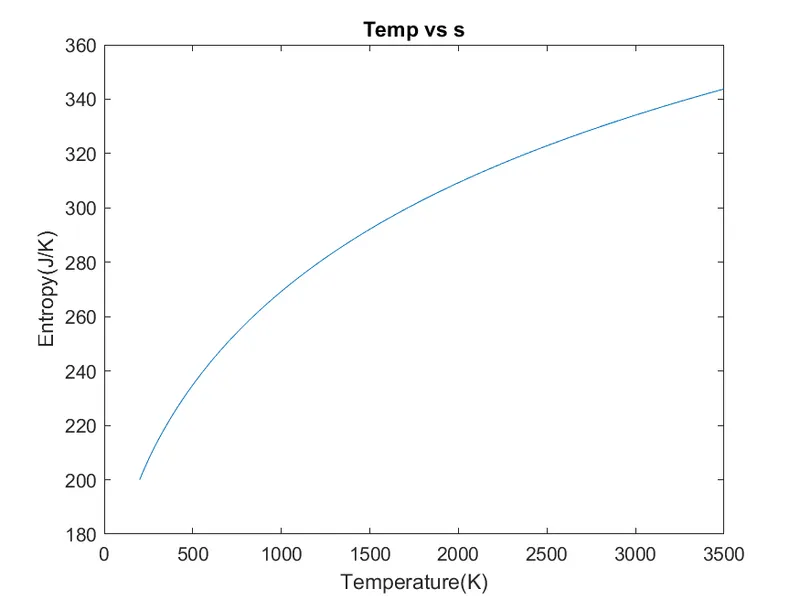
- To plot the Cp, Enthalpy and Entropy for the local temperature range.
Theory:
What is file parsing?
A. To break down the file into components parts so that it's syntax can be analysed and categorised.
Why do we parse file?
A. A data parser helps us turn unstructured data/un-readable data into structured data.
NASA thermo.dat file:
Nasa's polynomial for enthaly(H),entropy(S) and specific heat(Cp):

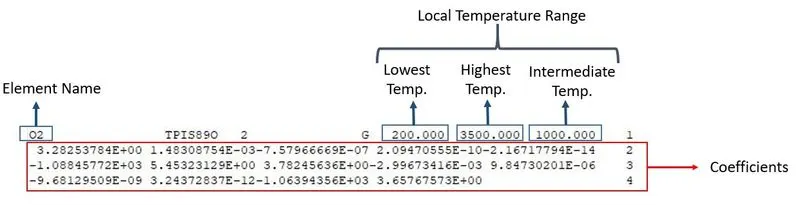
The red box in the above image is the coefficients. There are total 14 coefficients and The FIRST 7 coefficients are HIGH-temperature coefficients and the SECOND 7 coefficients are LOW-temperature coefficients.
Program:
clear all
close all
clc

% opening the THERMO file
f1 = fopen('THERMO.dat','r')
% The first five lines in the above file are comments
% To eliminate we execute the first five lines
for i=1:5
fgetl(f1)
end

% Since there are 53 species
% Executing the loop for 53 times
ct=0;
for i=1:53


line_1=fgetl(f1);
line_2=fgetl(f1);
line_3=fgetl(f1);
line_4=fgetl(f1);


A = strsplit(line_1,' ')
sp_name=A{1}

%for line_2
e=findstr(line_2,'E');
A1 = str2num(line_2(1:e(1)+3))
A2 = str2num(line_2(e(1)+4:e(2)+3))
A3 = str2num(line_2(e(2)+4:e(3)+3))
A4 = str2num(line_2(e(3)+4:e(4)+3))
A5 = str2num(line_2(e(4)+4:e(5)+3))
%for line_3
e=findstr(line_3,'E');
A6 = str2num(line_3(1:e(1)+3))
A7 = str2num(line_3(e(1)+4:e(2)+3))
A8 = str2num(line_3(e(2)+4:e(3)+3))
A9 = str2num(line_3(e(3)+4:e(4)+3))
A10 = str2num(line_3(e(4)+4:e(5)+3))
%for line_4
e=findstr(line_4,'E');
A11 = str2num(line_4(1:e(1)+3))
A12 = str2num(line_4(e(1)+4:e(2)+3))
A13 = str2num(line_4(e(2)+4:e(3)+3))
A14 = str2num(line_4(e(3)+4:e(4)+3))

g=strsplit(line_1,' ');
len=length(g);
    local_min_temp=str2num(g{len-3})
    local_max_temp=str2num(g{len-2})
    local_mid_temp=str2num(g{len-1})

% R is the gas constant
R=8.3145;

temp = linspace(local_min_temp,local_max_temp,1000)

for i=1:length(temp)

if temp(i)>local_mid_temp
    cp(i)=(A1+(A2*temp(i))+(A3*(temp(i)^2))+(A4*(temp(i)^3))+(A5*(temp(i)^4)))*R;
    h(i)=(A1+(A2*(temp(i)/2))+((A3*(temp(i)^2))/3)+((A4*(temp(i)^3))/4)+((A5*(temp(i)^4))/5)+(A6/temp(i)))*R*temp(i);
    s(i)=((A1*(log(temp(i))))+(A2*temp(i))+((A3*(temp(i)^2))/2)+((A4*(temp(i)^3))/3)+((A5*(temp(i)^4))/4)+A7)*R;
else
    cp(i)=(A8+(A9*temp(i))+(A10*(temp(i)^2))+(A11*(temp(i)^3))+(A12*(temp(i)^4)))*R;
    h(i)=(A8+(A9*(temp(i)/2))+((A10*(temp(i)^2))/3)+((A11*(temp(i)^3))/4)+((A12*(temp(i)^4))/5)+(A13/temp(i)))*R*temp(i);
    s(i)=((A8*(log(temp(i))))+(A9*temp(i))+((A10*(temp(i)^2))/2)+((A11*(temp(i)^3))/3)+((A12*(temp(i)^4))/4)+A14)*R;
end
end
% creating the folder to store the plots
folder = pwd;
mkdir(['C:\Users\Dell\Documents\MATLAB\NASA\',sp_name]);
%directing the plots towards newly created folder using cd command
cd(['C:\Users\Dell\Documents\MATLAB\NASA\',sp_name]);

Mol_wt= molecular_weight(sp_name);
M_M = sprintf('Molecular Mass of %s = %f',sp_name,Mol_wt)


    figure(1)
    plot(temp,cp);
    title('Temp vs Cp');
    xlabel('Temperature(K)');
    ylabel('Specific Heat(KJ/Kmol-K)');
    saveas(1,'Temp vs Cp.png')

    figure(2)
    plot(temp,h);
    title('Temp vs h');
    xlabel('Temperature(K)');
    ylabel('Enthalpy(J)');
    saveas(2,'Temp vs h.png')

    figure(3)
    plot(temp,s);
    title('Temp vs s');
    xlabel('Temperature(K)');
    ylabel('Entropy(J/K)');
    saveas(3,'Temp vs s.png')
cd(folder)
ct = ct+1;

end
% To close the thermo file using fclose command
fclose(f1);
Function for calculating molecular weigth:
function [M] = molecular_weight(sp_name)

Atomic_mass = [15.999,1.008,12.011,14.007,39.948];
Elements = ['O','H','C','N','A'];


Mol_wt = 0;
for i = 1:length(sp_name)
    for j = 1:length(Elements)
        if strcmpi(sp_name(i),Elements(j))
            Mol_wt = Mol_wt+Atomic_mass(j);
            z = j;

        end
    end
    var = str2double(sp_name(i));
     if (var>1)

         Mol_wt = Mol_wt+(Atomic_mass(z)*(var-1));

     end

end
M = Mol_wt;
end
Procedure:
- To open the NASA thermodynamic file in matlab use fopen command.
- The file has comments for the first five lines and from the next line the actual data starts.
- Executing the first five lines in order to eliminate comments from the data file.
- Assigning the next four lines to line_1,line_2,line_3,line_4 respectively.
- The first word of line_1 has the species name. Now in order to get the first word assigned to the species name, We first split the line_1 using 'strsplit' command.
- Now assigning each co-efficient in line_2,line_3 and line_4 to a separate variable with respect to the letter 'E'.
- And converting 'co_efficient' to numbers from string, using 'str2num' command.
- Using if-else statement to place The FIRST 7 coefficients as HIGH-temperature coefficients and the SECOND 7 coefficients as LOW-temperature coefficients.
- The temperature (temp) is divided into 1000 equal spaces between minimum temperature and maximum temperature using the linspace command.
- Now creating a new directory and changing the path towards this directory using 'mkdir' and 'cd' command.
- Plotting three graph in three separate figures. And saving the plots using 'saveas' command.
- Lastly closing the thermo.dat file using 'fclose' command.
output:

Plots for O2:
Plots for N2:
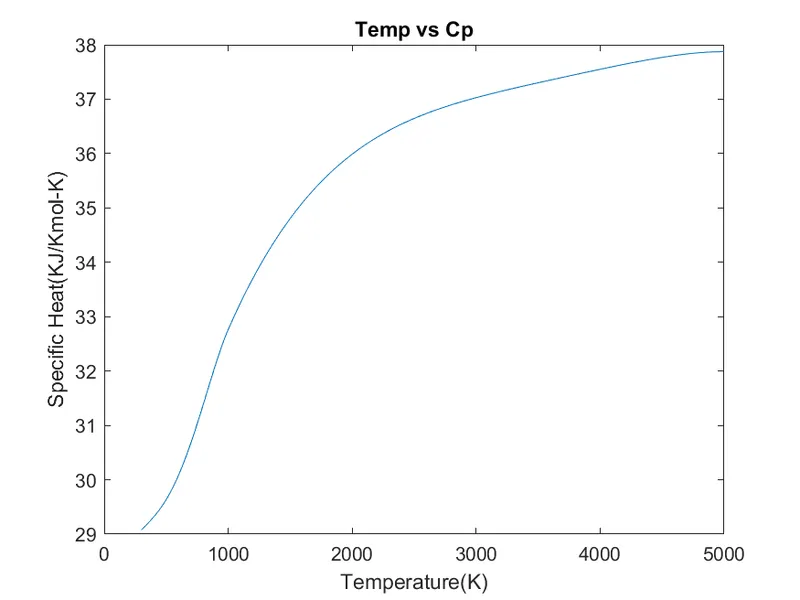
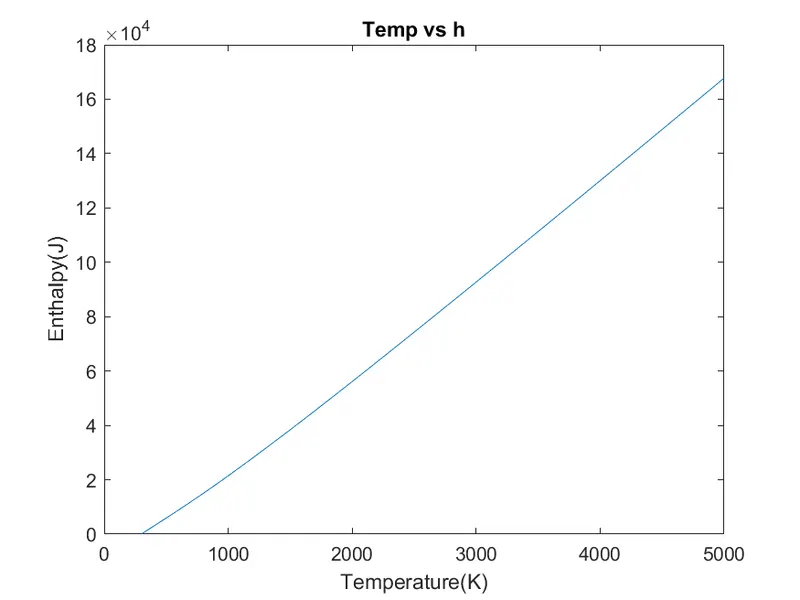
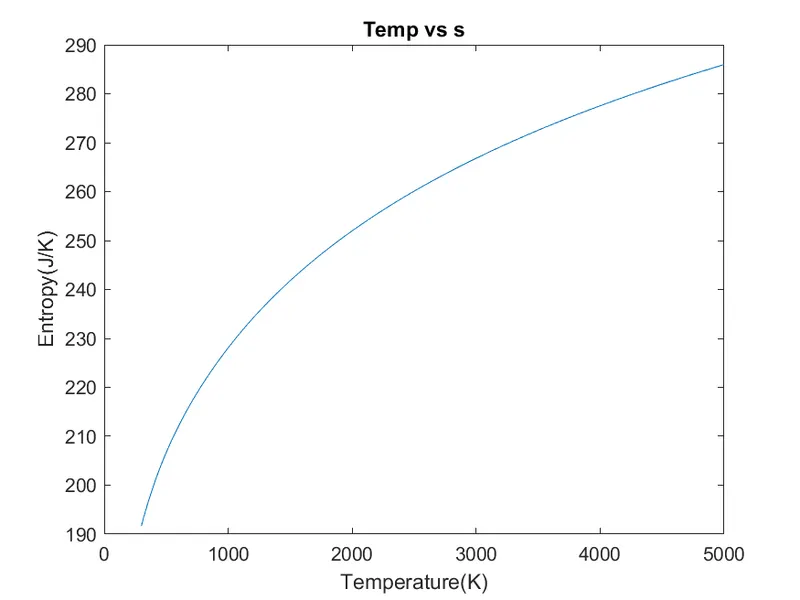
Plots for CO2:
Molecular weight in the Command window:
Conclusion:
Therefore, we have successfully parsed the given NASA thermodynamic data file and plotted the graphs of specific heat(Cp), enthalpy(H) and entropy(S) for the respective species name.