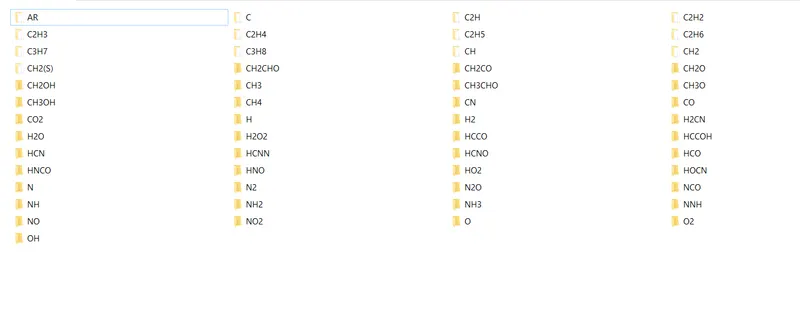
Project 1 - Parsing NASA thermodynamic data
Aim -Write a function that extracts the 14 co-efficients and calculates the enthalpy, entropy and specific heats ,molecular weight for all the species in the data file.
Introduction
Parsing a file means reading in a data stream and building a memory model of the content of that data. This aims at facilitating perfoming some kind of transformation on the data. Parsing splits a file or other input into pieces of data that can be easily stored or manipulated.
Formula

Explanation of the code
%parsing Nasa thermodynamic data
clear all
close all
clc
Opening the file THERMO and 'r' represents reading the data from the file after being opened
%getting the data from the provided file
f1=fopen('THERMO.dat','r')
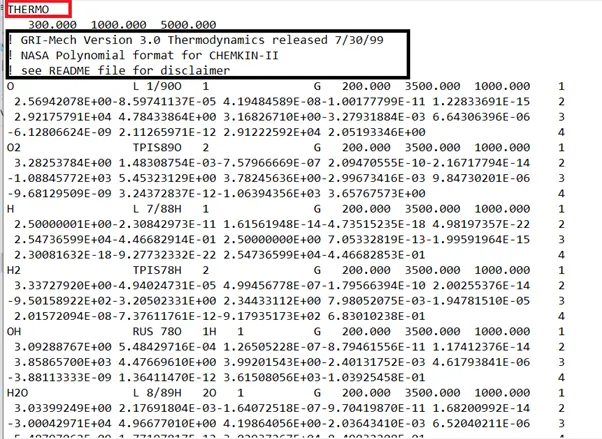
The first line which is highlighted in red is skipped
%skipping the first line
fgetl(f1)
fgetl is used get the ' 300.000 1000.000 5000.000'from the Thermo file after getting the file strsplit is used to split the
{0×0 char} {' 300.000'} {'1000.000'} {'5000.000'}
%getting the global temperature
tline1=fgetl(f1);
a=strsplit(tline1,' ');
{0×0 char} {' 300.000'} {'1000.000'} {'5000.000'}
str2num(a{3})= string to number '300' to number 300 where (a{3})=300
similarly
str2num(a{3})= a(3)=1000
str2num(a{4})= a(4)=5000
global temperature is not necessary to be extracted as it is not used anywhere
global_low_temp=str2num(a{2});
global_mid_temp=str2num(a{3});
global_high_temp=str2num(a{4});
the three lines which is highlighted in black is skipped using the below comments
%skipping the lines
for i=1:3
skipping=fgetl(f1)
end
To calculate the total number of lines, present in file we use the commands shown below
%c =Read characters, including white space.
fid = fopen('THERMO.dat','r');
Nrows =(numel(textread('THERMO.dat','%1c%*[^\n]'))-6)/4;
\n =represents the new line
Ignore the matching characters specified by *.
-6 mean first 5 line and 1 line at the end is eliminated
Divided by 4 so we get the final number of species
By using b=strsplit(tline2,' '); we get
{'O'} {' L 1/90O'} {' 1'} {' G'} {' 200.000'} {'3500.000'} {'1000.000'} {'1'}
We get the length of d that is 8
d=length(b);
for i=1:53
tline2=fgetl(f1);
b=strsplit(tline2,' ');
d=length(b);
name_of_species=b{1};
local_low_temp=str2num(b{d-3});
local_mid_temp=str2num(b{d-1});
local_high_temp=str2num(b{d-2});
After getting the 1st coefficient line and using strfind to find E in the line which is 12 27 42 57 72. g(1)represents 12 which means E is at the 12th position and +3 mean moving 3 position forward.
Similarly following the same logic to get all the 14 coefficients
coline1=fgetl(f1);
g=strfind(coline1,'E');
c1=str2num(coline1(1:g(1)+3));
c2=str2num(coline1(g(1)+4:(g(2)+3)));
c3=str2num(coline1(g(2)+4:(g(3)+3)));
c4=str2num(coline1(g(3)+4:(g(4)+3)));
c5=str2num(coline1(g(4)+4:(g(5)+3)));
2nd coefficient line
coline2=fgetl(f1);
g=strfind(coline2,'E');
c6=str2num(coline2(1:g(1)+3));
c7=str2num(coline2(g(1)+4:(g(2)+3)));
c8=str2num(coline2(g(2)+4:(g(3)+3)));
c9=str2num(coline2(g(3)+4:(g(4)+3)));
c10=str2num(coline2(g(4)+4:(g(5)+3)));
3nd coefficient line
coline3=fgetl(f1);
g=strfind(coline3,'E');
c11=str2num(coline3(1:g(1)+3));
c12=str2num(coline3(g(1)+4:(g(2)+3)));
c13=str2num(coline3(g(2)+4:(g(3)+3)));
c14=str2num(coline3(g(3)+4:(g(4)+3)));
%universal gas constant
R=8.314;
T=linspace(local_low_temp,local_high_temp,100);
Calling the function
[cp,H,S]=inputs(c1,c2,c3,c4,c5,c6,c7,c8,c9,c10,c11,c12,c13,c14,R,local_low_temp,local_mid_temp,local_high_temp,T);
Ploting the graphs
%Plotting
figure(1)
plot(T,cp)
title(name_of_species)
xlabel('temperature')
ylabel('specific heat')
figure(2)
plot(T,H)
title(name_of_species)
xlabel('temperature')
ylabel('Enthalpy')
figure(3)
plot(T,S)
title(name_of_species)
xlabel('temperature')
ylabel('Entropy')
Make new folder
mkdir(['C:\Users\Chiranth R\Desktop\Matlab codes\Plots\',name_of_species])
change directory
cd(['C:\Users\Chiranth R\Desktop\Matlab codes\Plots\',name_of_species])
save all figure 1
saveas(1, 'Specific heat.png')
save all figure 2
saveas(2, 'Enthalpy.png')
save all figure 3
saveas(3, 'Entropy.png')
Format data into string or character vector
sprintf= [M]=molecular_weight(name_of_species)
k=sprintf('%s mol_wt=%f',name_of_species,M)
disp(k)
end
Sub code
(If temperature is greater than local_mid_temp i,e 1 to 7 coefficient is considered else cofficent 8 to 14 is considered )
function[cp,H,S]=inputs(c1,c2,c3,c4,c5,c6,c7,c8,c9,c10,c11,c12,c13,c14,R,local_low_temp,local_mid_temp,local_high_temp,T)
for i=1:length(T)
if T(i)>local_mid_temp
cp(i)=(c1+c2.*T(i)+c3.*T(i).^2+c4*T(i).^3+c5*T(i).^4).*R;
H(i)=(c1+(c2.*T(i))./2+(c3.*T(i).^2)./3+(c4*T(i).^3)./4+(c5*T(i).^4)./5+(c6)./T(i)).*T(i).R;
S(i)=(c1.*log(T(i))+(c2.*T(i))+(c3.*T(i).^2)./2+(c4.*T(i).^3)./3+(c5.*T(i).^4)./4+c7).*R;
else
cp(i)=(c8+c9.*T(i)+c10.*T(i).^2+c11*T(i).^3+c12*T(i).^4).*R;
H(i)=(c8+(c9.*T(i))./2+(c10.*T(i).^2)./3+(c11*T(i).^3)./4+(c12*T(i).^4)./5(c13)./T(i)).*T(i).*R;
S(i)=(c8.*log(T(i))+(c9.*T(i))+(c10.*T(i).^2)./2+(c11.*T(i).^3)./3+(c12.*T(i).^4)./4+c14).*R;
end
end
end
Sub code
tf = strcmpi(s1,s2) compares s1 and s2, ignoring any differences in letter case. The function returns 1 (true) if the two are identical and 0 (false) otherwise. Text is considered identical if the size and content of each are the same, aside from case. The return result tf is of data type logical.
The input arguments can be any combination of string arrays, character vectors, and cell arrays of character vectors.
In common word if the string member in specie matches with the string member in element its corresponding mass is added to molecular mass
Molecular mass of a compound is the sum of the atomic mass of the atoms
function[M]=molecular_weight(name_of_species)
elements= ['O','H','C','N','A'];
atomic_mass = [15.999,1.0078,12.010,14.0067,39.948];
mol_wt=0;
for i = 1:length(name_of_species);
for j=1:length(elements);
if strcmpi(name_of_species(i),elements(j))
mol_wt=mol_wt+atomic_mass(j);
z=j;
end
end
here in CH2CHO where n =2
n=str2num(name_of_species(i));
if (n>1)
mol_wt=mol_wt+(atomic_mass(z)*(n-1));
end
end
M=mol_wt;
end
Main code
%parsing Nasa thermodynamic data
clear all
close all
clc
%getting the data from the provided file
f1=fopen('THERMO.dat','r')

%skipping the first line
fgetl(f1)

%getting the global temperature
tline1=fgetl(f1);

a=strsplit(tline1,'  ');

global_low_temp=str2num(a{2});
global_mid_temp=str2num(a{3});
global_high_temp=str2num(a{4});

%skipping the lines

for i=1:3
    skipping=fgetl(f1)
end

%reading the number of lines
fid = fopen('THERMO.dat','r');
Nrows =( numel(textread('THERMO.dat','%1c%*[^\n]'))-6)/4;

%getting the temperature and coefficients
 for i=1:53
tline2=fgetl(f1);
b=strsplit(tline2,'  ');
d=length(b);
name_of_species=b{1};
local_low_temp=str2num(b{d-3});
local_mid_temp=str2num(b{d-1});
local_high_temp=str2num(b{d-2});

coline1=fgetl(f1);
g=strfind(coline1,'E');
c1=str2num(coline1(1:g(1)+3));
c2=str2num(coline1(g(1)+4:(g(2)+3)));
c3=str2num(coline1(g(2)+4:(g(3)+3)));
c4=str2num(coline1(g(3)+4:(g(4)+3)));
c5=str2num(coline1(g(4)+4:(g(5)+3)));

coline2=fgetl(f1);
g=strfind(coline2,'E');
c6=str2num(coline2(1:g(1)+3));
c7=str2num(coline2(g(1)+4:(g(2)+3)));
c8=str2num(coline2(g(2)+4:(g(3)+3)));
c9=str2num(coline2(g(3)+4:(g(4)+3)));
c10=str2num(coline2(g(4)+4:(g(5)+3)));

coline3=fgetl(f1);
g=strfind(coline3,'E');
c11=str2num(coline3(1:g(1)+3));
c12=str2num(coline3(g(1)+4:(g(2)+3)));
c13=str2num(coline3(g(2)+4:(g(3)+3)));
c14=str2num(coline3(g(3)+4:(g(4)+3)));


%universal gas constant
R=8.314;
T=linspace(local_low_temp,local_high_temp,100);


[cp,H,S]=inputs(c1,c2,c3,c4,c5,c6,c7,c8,c9,c10,c11,c12,c13,c14,R,local_low_temp,local_mid_temp,local_high_temp,T);


%Plotting

figure(1)

plot(T,cp)
title(name_of_species)
xlabel('temperature')
ylabel('specific heat')

figure(2)

plot(T,H)
title(name_of_species)
xlabel('temperature')
ylabel('Enthalpy')

figure(3)

plot(T,S)
title(name_of_species)
xlabel('temperature')
ylabel('Entropy')
mkdir(['C:\Users\Chiranth R\Desktop\Matlab codes\Plots\',name_of_species])
cd(['C:\Users\Chiranth R\Desktop\Matlab codes\Plots\',name_of_species])
saveas(1, 'Specific heat.png')
saveas(2, 'Enthalpy.png')
saveas(3, 'Entropy.png')


[M]=molecular_weight(name_of_species)

k=sprintf('%s mol_wt=%f',name_of_species,M)
disp(k)
end
sub code for calculating enthalpy, entropy and specific heat
function[cp,H,S]=inputs(c1,c2,c3,c4,c5,c6,c7,c8,c9,c10,c11,c12,c13,c14,R,local_low_temp,local_mid_temp,local_high_temp,T)
for i=1:length(T)
    if T(i)>local_mid_temp


        cp(i)=(c1+c2.*T(i)+c3.*T(i).^2+c4*T(i).^3+c5*T(i).^4).*R;
        H(i)=(c1+(c2.*T(i))./2+(c3.*T(i).^2)./3+(c4*T(i).^3)./4+(c5*T(i).^4)./5+(c6)./T(i)).*T(i).*R;
        S(i)=(c1.*log(T(i))+(c2.*T(i))+(c3.*T(i).^2)./2+(c4.*T(i).^3)./3+(c5.*T(i).^4)./4+c7).*R;

    else

        cp(i)=(c8+c9.*T(i)+c10.*T(i).^2+c11*T(i).^3+c12*T(i).^4).*R;
        H(i)=(c8+(c9.*T(i))./2+(c10.*T(i).^2)./3+(c11*T(i).^3)./4+(c12*T(i).^4)./5+(c13)./T(i)).*T(i).*R;
        S(i)=(c8.*log(T(i))+(c9.*T(i))+(c10.*T(i).^2)./2+(c11.*T(i).^3)./3+(c12.*T(i).^4)./4+c14).*R;

    end
end
end
Sub function to calculate molecular weight
function[M]=molecular_weight(name_of_species)

elements= ['O','H','C','N','A'];
atomic_mass = [15.999,1.0078,12.010,14.0067,39.948];
mol_wt=0;
for i= 1:length(name_of_species);
for j= 1:length(elements);
    if strcmpi(name_of_species(i),elements(j))
      mol_wt=mol_wt+atomic_mass(j);
       z=j;
    end
end
n=str2num(name_of_species(i));
if (n>1)
        mol_wt=mol_wt+(atomic_mass(z)*(n-1));

end
end
M=mol_wt;
end
error faced
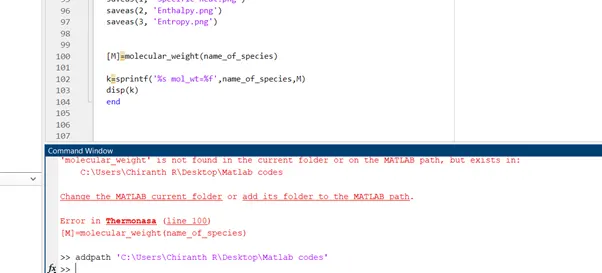
After adding the matlab folder to the matlab path the error was solved
Result
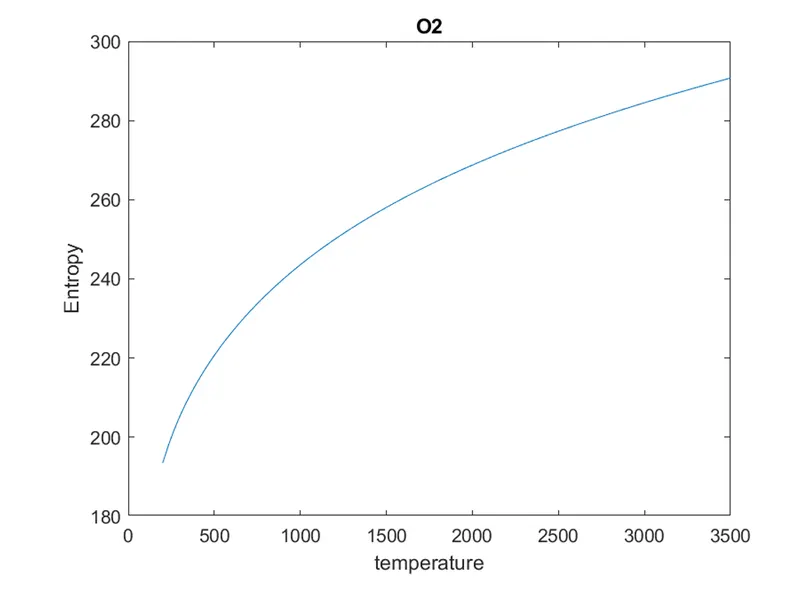
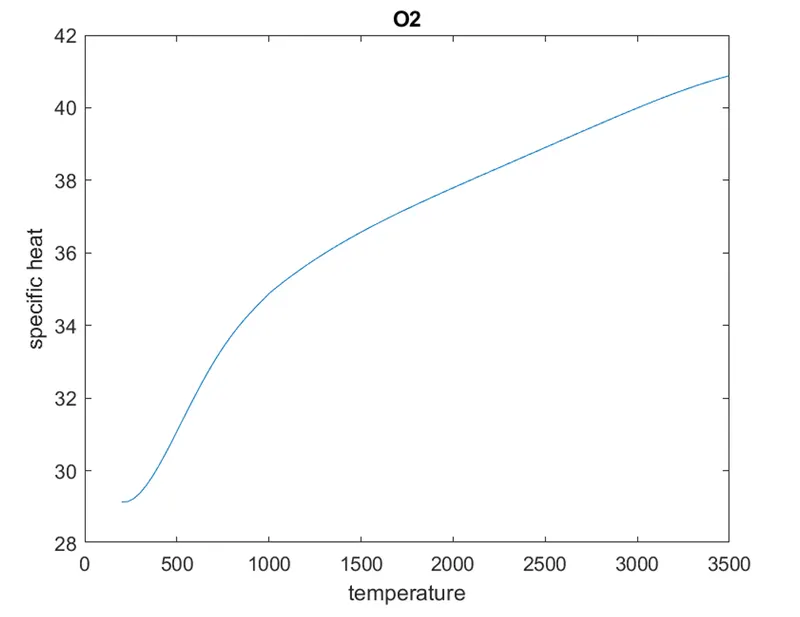
Plots for o2 species
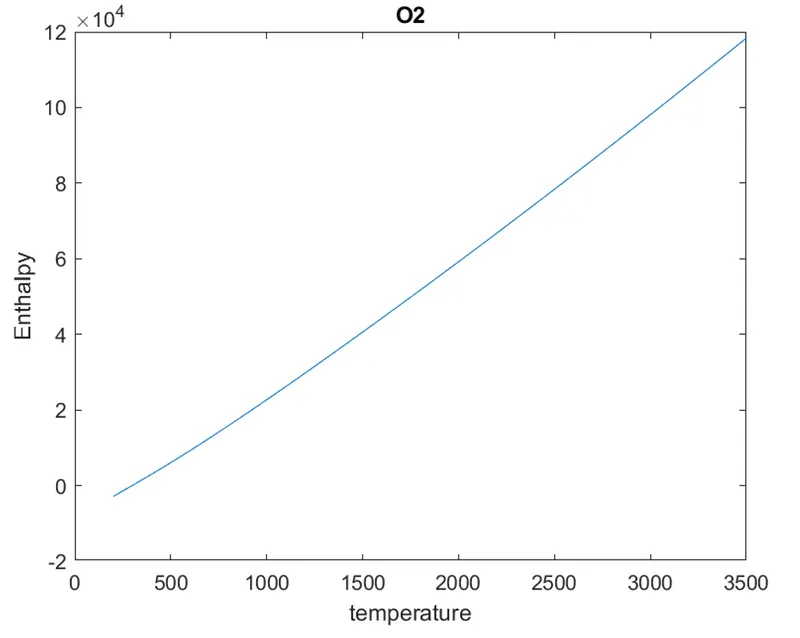
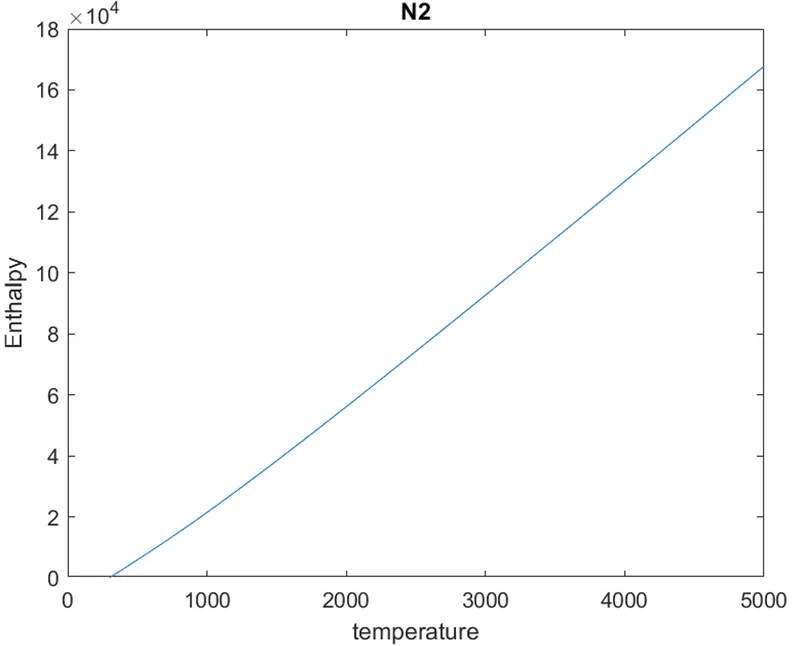
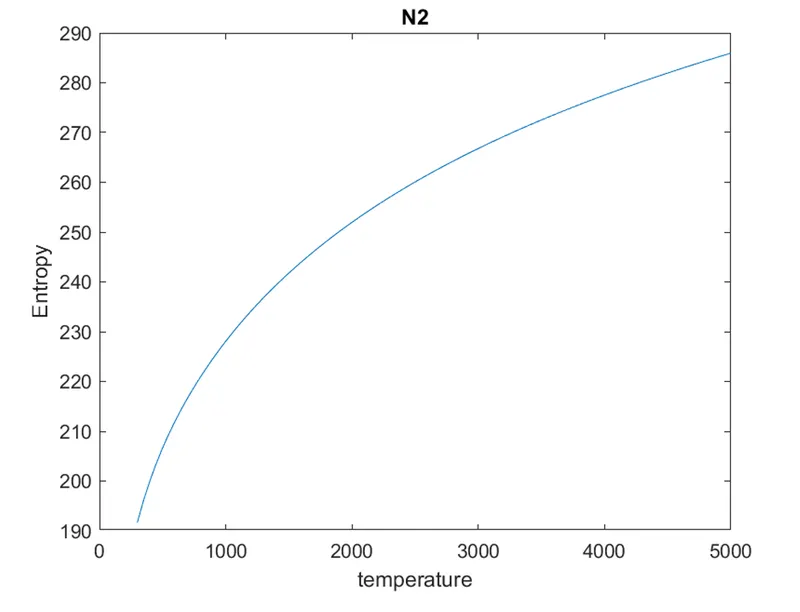
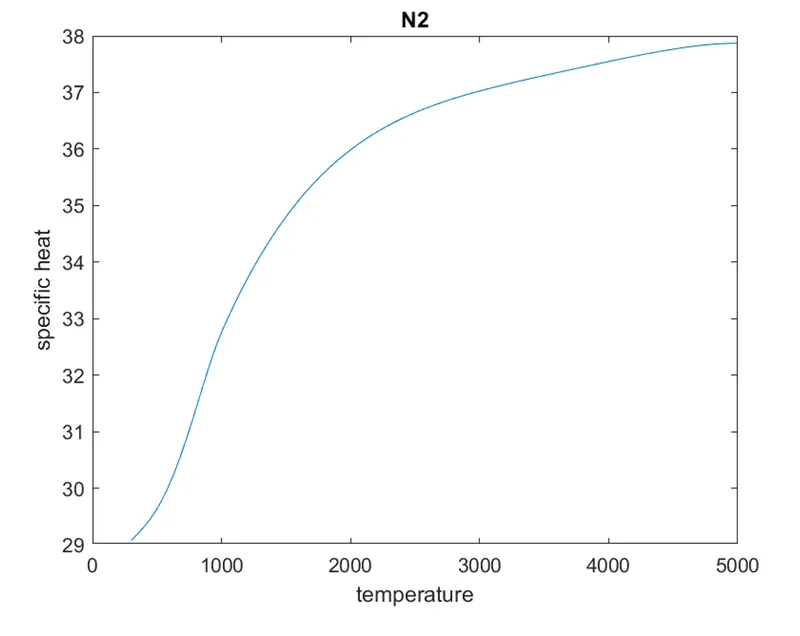
Plot for N2 species
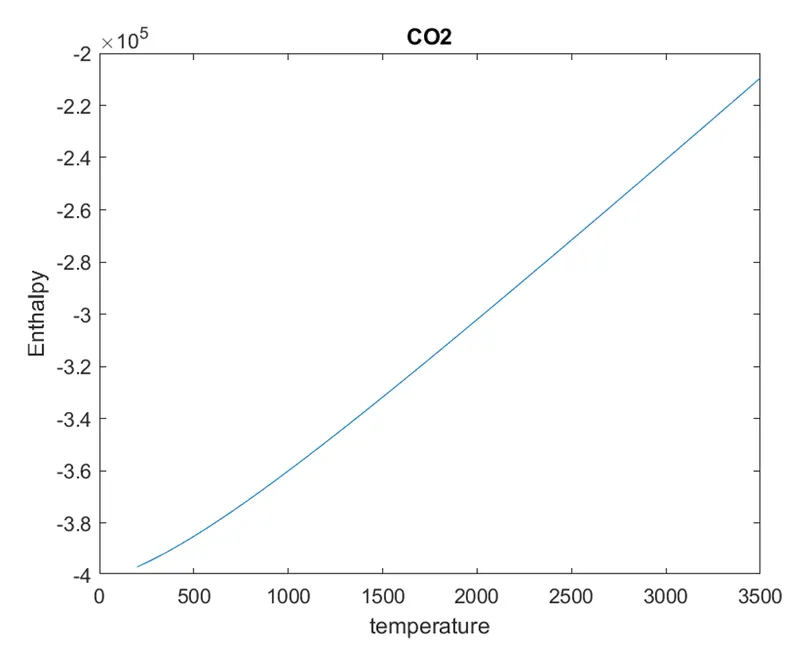
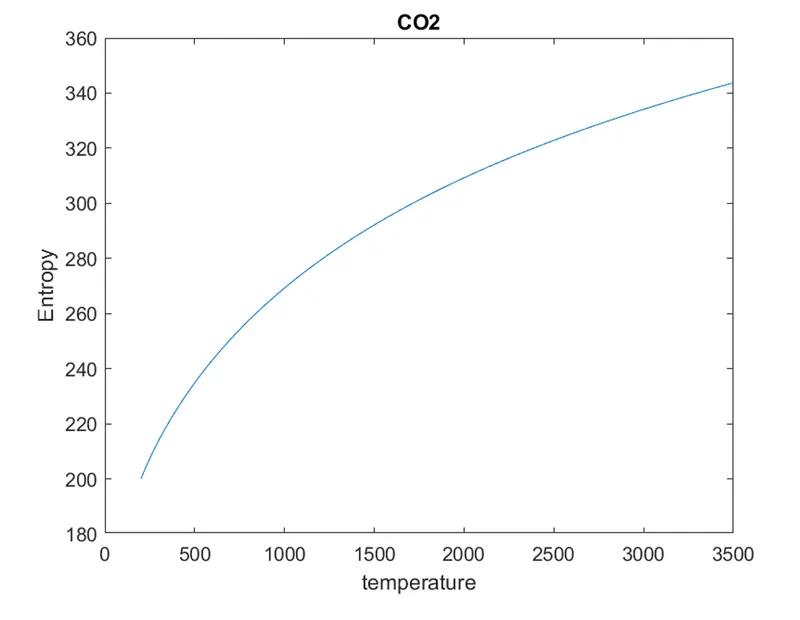
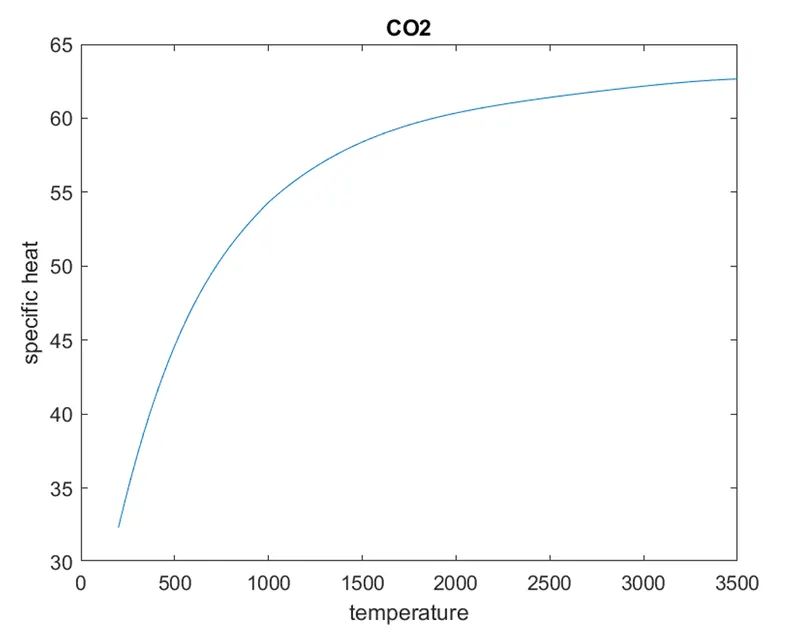
Plot for Co2 species
molecular weight of each species which is displayed in the command window.
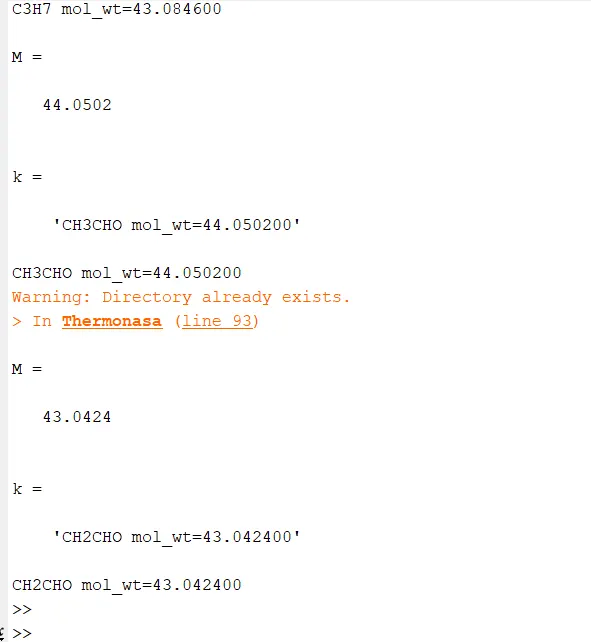
Plots of all the species are saved in the folder the screen shot of it is attached below.