Project 1 - Parsing NASA thermodynamic data
Objective :
- Write a code to parse the given NASA thermodynamic data file in Matlab.
- Write a code to extract each species and its temperature data.
- Write a code to extract the fourteen thermal properties of each species.
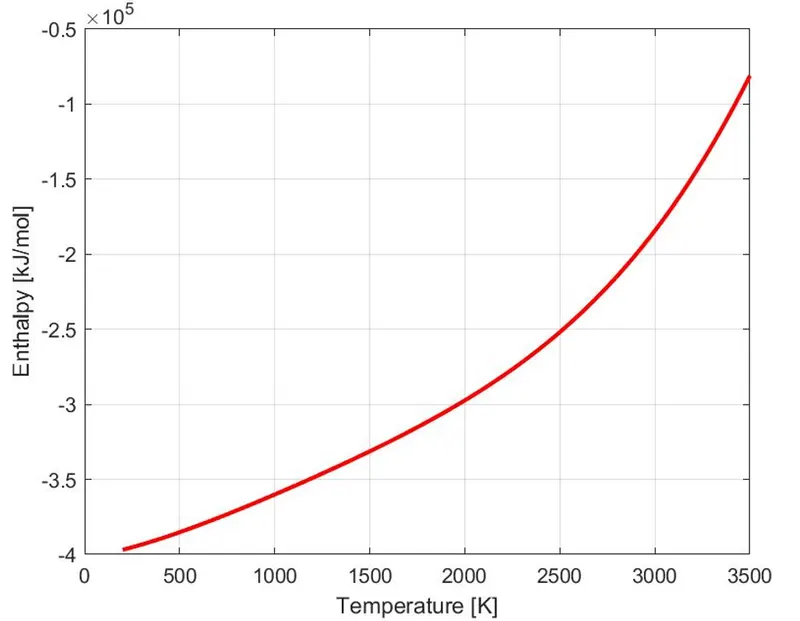
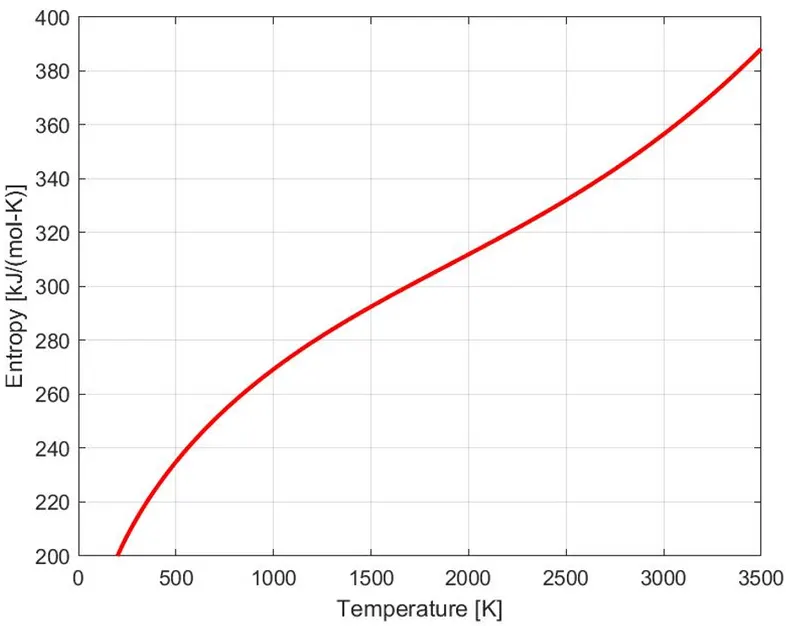
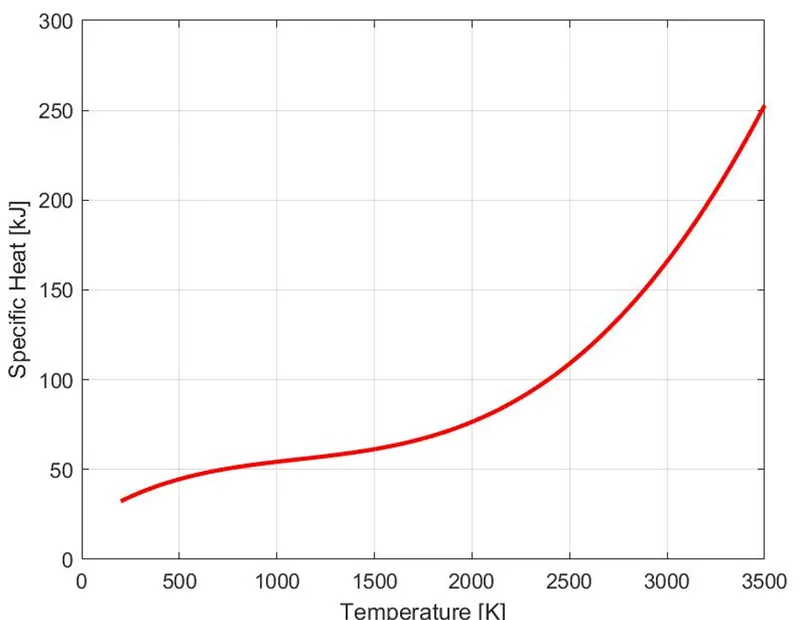
- Write functions to calculate specific heat, enthalpy, entropy and plot them against the local temperatures of each individual species.
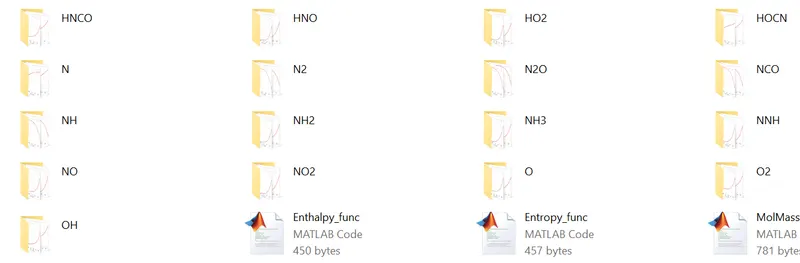
- Create separate directories for each species and save their respective plots as images.
- Write a code to calculate the molecular weight of each species.
Introduction :
There are a total of 53 species listed in Nasa's 'THERMO.dat' file. O
O2 H H2 OH H2O HO2 H2O2 C CH CH2 CH2S CH3 CH4 CO CO2 HCO CH2O CH2OH CH3O CH3OH C2H C2H2 C2H3 C2H4 C2H5 C2H6 CH2C0 HCCO HCCOH H2CN HCN HNO N NNH N2O NH NH2 NH3 NO NO2 HCNO HOCN HNCO NCO CN HCNN N2 AR C3H8 C3H7 CH3CHO CH2CHO
Each species is documented with fourteen parameters of which the first seven are high-temperature coefficients and the last seven are low-temperature coefficients.
The formulae for specific heat(Cp), enthalpy(H), and entropy(S) in terms of these coefficients are

where R is the universal gas constant and T is the temperature.
Matlab Program :
Functions
%% Specific Heat, Cp

function [Cp] = Specificheat_func(a1,a2,a3,a4,a5,a6,a7,a8,a9,a10,a11,a12,a13,a14,T,R,Temp_Mid)
% a1,a2,a3,a4,a5,a6,a7 are HIGH-temperature coefficients
% a8,a9,a10,a11,a12,a13,a14 are LOW-temperature coefficients

if T >= Temp_Mid
    Cp = (a1 + (a2*T) + (a3*(T.^2)) + (a4*(T.^3)) + (a5*(T.^4)))*R;
else
   Cp = (a8 + (a9*T) + (a10*(T.^2)) + (a11*(T.^3)) + (a12*(T.^4)))*R;
end
%% Enthalpy, H
function [H] = Enthalpy_func(a1,a2,a3,a4,a5,a6,a7,a8,a9,a10,a11,a12,a13,a14,T,R,Temp_Mid)
% a1,a2,a3,a4,a5,a6,a7 are HIGH-temperature coefficients
% a8,a9,a10,a11,a12,a13,a14 are LOW-temperature coefficients
if T >= Temp_Mid
H = (a1 + (a2.*T/2) + (a3.*(T.^2)/3) + (a4.*(T.^3)/4) + (a5.*(T.^4)/5) + (a6./T))*R.*T;
else
H = (a8 + (a9.*T/2) + (a10.*(T.^2)/3) + (a11.*(T.^3)/4) + (a12.*(T.^4)/5) + (a13./T))*R.*T;
end%% Entropy, S
function [S] = Entropy_func(a1,a2,a3,a4,a5,a6,a7,a8,a9,a10,a11,a12,a13,a14,T,R,Temp_Mid)
% a1,a2,a3,a4,a5,a6,a7 are HIGH-temperature coefficients
% a8,a9,a10,a11,a12,a13,a14 are LOW-temperature coefficients
if T >= Temp_Mid
S = ((a1.*log(T)) + (a2.*T) + ((a3.*(T).^2)/2) + ((a4.*(T).^3)/3) + ((a5.*(T).^4)/4) + a7)*R;
else
S = ((a8.*log(T)) + (a9.*T) + ((a10.*(T).^2)/2) + ((a11.*(T).^3)/3) + ((a12.*(T).^4)/4) + a14)*R;
endMain program
clear all
close all
clc
R = 8.314;     % Universal gas constant in J/(mol-K)

f1 = fopen('THERMO.dat', 'r');     % Reading the data from the file
fgetl(f1);
%% Reading the temperatures
tline = '300.000  1000.000  5000.000';
% Split the string value at space
A = strsplit(tline, ' ');     % strsplit(str, delimiter)
str2num(A{1});     % convert string into number
global_low_temp = str2num(A{1});
global_mid_temp = str2num(A{2});
global_high_temp = str2num(A{3});

% Skipping the comments
for i = 1:4
    fgetl(f1);
end

%% Parsing all species blocks
for i = 1:53
    % Getting species names
    L1 = fgetl(f1);     % Line #1
    L1 = strsplit(L1, ' ');
    Species = L1{1};
    %Local temperature data
    Temp_Low = str2num(L1{end-3});
    Temp_Mid = str2num(L1{end-1});
    Temp_High = str2num(L1{end-2});
    T = linspace(Temp_Low, Temp_High, 500);
    % Reading Temperature coefficients
    % High Temperature coefficients -- a1, a2, a3, a4, a5, a6, a7
    % Loe Temparature coefficients -- a8, a9, a10, a11, a12, a13, a14
    L2 = fgetl(f1);     % Line #2
    A = findstr(L2,'E');     % to find the place values of E => 12 27 42 57 72
    a1 = str2num(L2(1:12 + 3));
    a2 = str2num(L2(A(1)+4 : A(2)+3));    % A(1)=12 => A(1)+4=16th place   % A(2)=27 => A(2)+3=30th place
    a3 = str2num(L2(A(2)+4 : A(3)+3));
    a4 = str2num(L2(A(3)+4 : A(4)+3));
    a5 = str2num(L2(A(4)+4 : A(5)+3));
    L3 = fgetl(f1);     % Line #3
    A = findstr(L3,'E');     % to find the place values of E => 12 27 42 57 72
    a6 = str2num(L3(1:12 + 3));
    a7 = str2num(L3(A(1)+4 : A(2)+3));
    a8 = str2num(L3(A(2)+4 : A(3)+3));
    a9 = str2num(L3(A(3)+4 : A(4)+3));
    a10 = str2num(L3(A(4)+4 : A(5)+3));
    L4 = fgetl(f1);     % Line #4
    A = findstr(L4,'E');     % to find the place values of E => 12 27 42 57
    a11 = str2num(L4(1:12 + 3));
    a12 = str2num(L4(A(1)+4 : A(2)+3));
    a13 = str2num(L4(A(2)+4 : A(3)+3));
    a14 = str2num(L4(A(3)+4 : A(4)+3));

%% Calculating the thermodynamic propertis of species
% Specific Heat
Cp = Specificheat_func(a1,a2,a3,a4,a5,a6,a7,a8,a9,a10,a11,a12,a13,a14,T,R,Temp_Mid);

% Enthalpy

H = Enthalpy_func(a1,a2,a3,a4,a5,a6,a7,a8,a9,a10,a11,a12,a13,a14,T,R,Temp_Mid);

% Entropy
S = Entropy_func(a1,a2,a3,a4,a5,a6,a7,a8,a9,a10,a11,a12,a13,a14,T,R,Temp_Mid);

%% Folder creation
currentFolder = pwd;     % To return the path to the current folder
mkdir(Species);     % Creating a folder for each species
cd(Species);

%% Plots
1) Specific Heat vs Temperature
figure(1)
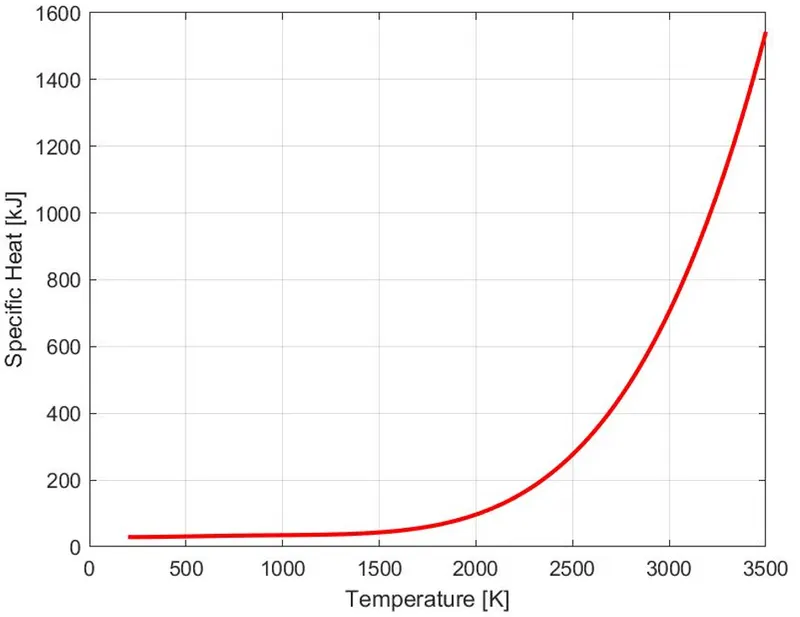
plot(T,Cp,'linewidth',2,'color','r')
xlabel('Temperature [K]')
ylabel('Specific Heat [kJ]')
grid on
saveas(figure(1), 'SpecificHeat.jpg')

% 2) Enthalpy vs Temperature
figure(2)
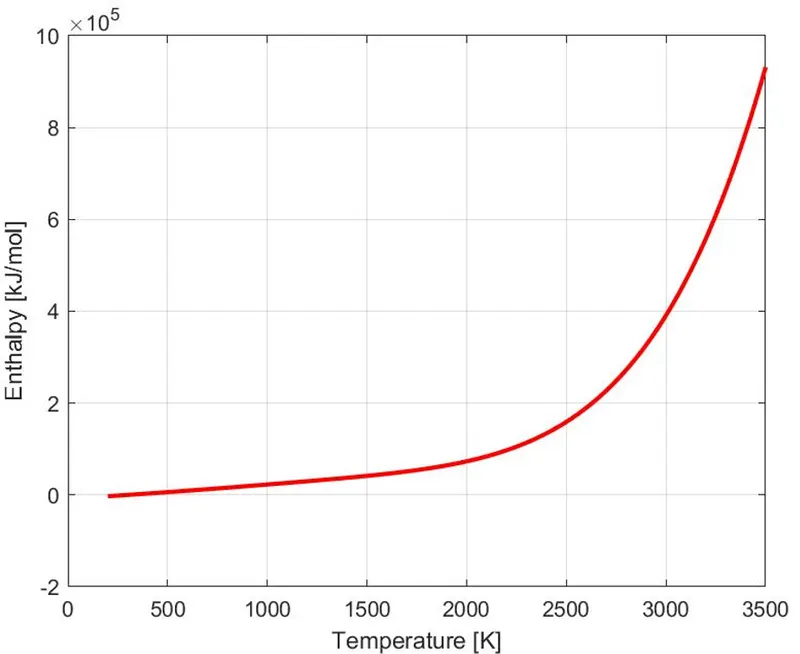
plot(T,H,'linewidth',2,'color','r')
xlabel('Temperature [K]')
ylabel('Enthalpy [kJ/mol]')
grid on
saveas(figure(2), 'Enthalpy.jpg')

% 3) Entropy vs Temperature
figure(3)
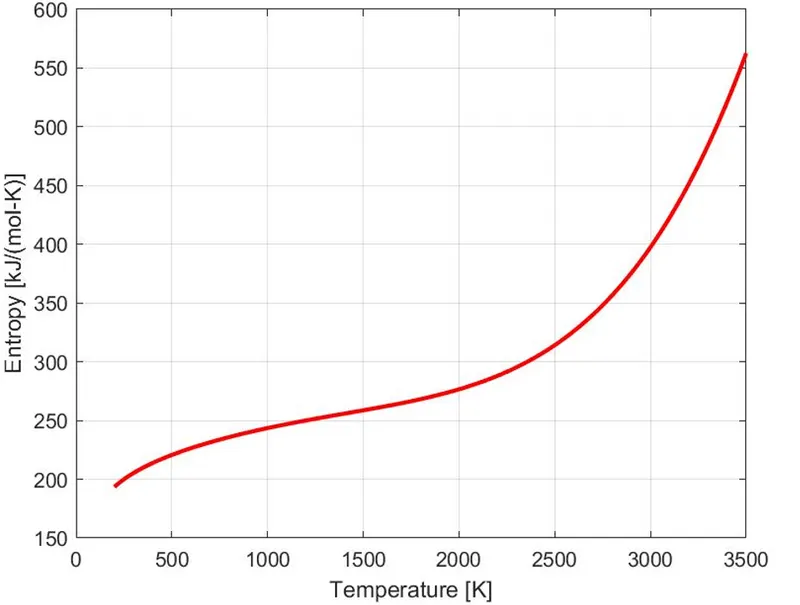
plot(T,S,'linewidth',2,'color','r')
xlabel('Temperature [K]')
ylabel('Entropy [kJ/(mol-K)]')
grid on
saveas(figure(3), 'Entropy.jpg')
cd('C:\Users\PadminiGanapathiraju\Documents\MATLAB\FileParsing')     % Returning to the main folder

%% Molecular weight of the species
% Available atoms in the file
Atom = ['O','H','C','S','N','A'];
% Atomic weights of the above listed atoms
% units of an atomic weight --- 1D = 1amu
% where D---Dalton, amu---atomic mass unit
AtomicWeight = [15.999 1.0078 12.0107 32.065 14.0067 39.948];

% Initial molecule range
MolMass = 0;
%Calculating the molecular weight of each species
for i = 1:length(Species)
    for j=1:length(Atom)
        if strcmp(Species(i), Atom(j))     % Comparing the string i and j
            MolMass = MolMass + AtomicWeight(j);
            k = j;
        end
    end
    % Checking the species with multiple elements
    X = str2num(Species);
    if X>1
        MolMass = MolMass + AtomicWeight(k)*(X-1);
    end
end
%print the molecular weight of each species
fprintf(Species);
fprintf(' MolMass: %f',MolMass );

end
fclose(f1)
Output :
O MolMass: 15.999000O2 MolMass: 15.999000H MolMass: 1.007800H2 MolMass: 1.007800OH MolMass: 17.006800H2O MolMass: 17.006800HO2 MolMass: 17.006800H2O2 MolMass: 17.006800C MolMass: 12.010700CH MolMass: 13.018500CH2 MolMass: 13.018500CH2(S) MolMass: 45.083500CH3 MolMass: 13.018500CH4 MolMass: 13.018500CO MolMass: 28.009700CO2 MolMass: 28.009700HCO MolMass: 29.017500CH2O MolMass: 29.017500CH2OH MolMass: 30.025300CH3O MolMass: 29.017500CH3OH MolMass: 30.025300C2H MolMass: 13.018500C2H2 MolMass: 13.018500C2H3 MolMass: 13.018500C2H4 MolMass: 13.018500C2H5 MolMass: 13.018500C2H6 MolMass: 13.018500CH2CO MolMass: 41.028200HCCO MolMass: 41.028200HCCOH MolMass: 42.036000H2CN MolMass: 27.025200HCN MolMass: 27.025200HNO MolMass: 31.013500N MolMass: 14.006700NNH MolMass: 29.021200N2O MolMass: 30.005700NH MolMass: 15.014500NH2 MolMass: 15.014500NH3 MolMass: 15.014500NO MolMass: 30.005700NO2 MolMass: 30.005700HCNO MolMass: 43.024200HOCN MolMass: 43.024200HNCO MolMass: 43.024200NCO MolMass: 42.016400CN MolMass: 26.017400HCNN MolMass: 41.031900N2 MolMass: 14.006700AR MolMass: 39.948000C3H8 MolMass: 13.018500C3H7 MolMass: 13.018500CH3CHO MolMass: 42.036000CH2CHO MolMass: 42.036000
ans =
0
>>
Screenshot of the window

Plots of O2
Plots of N2
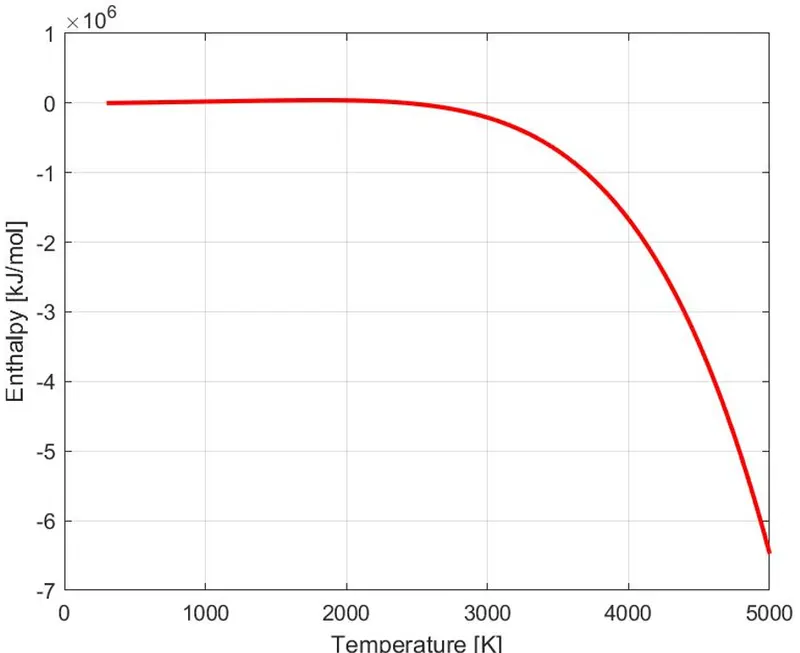
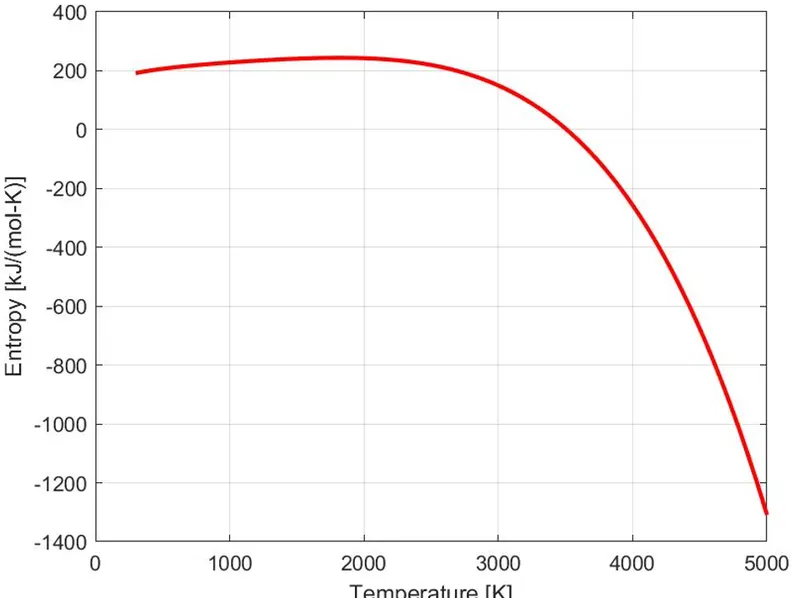
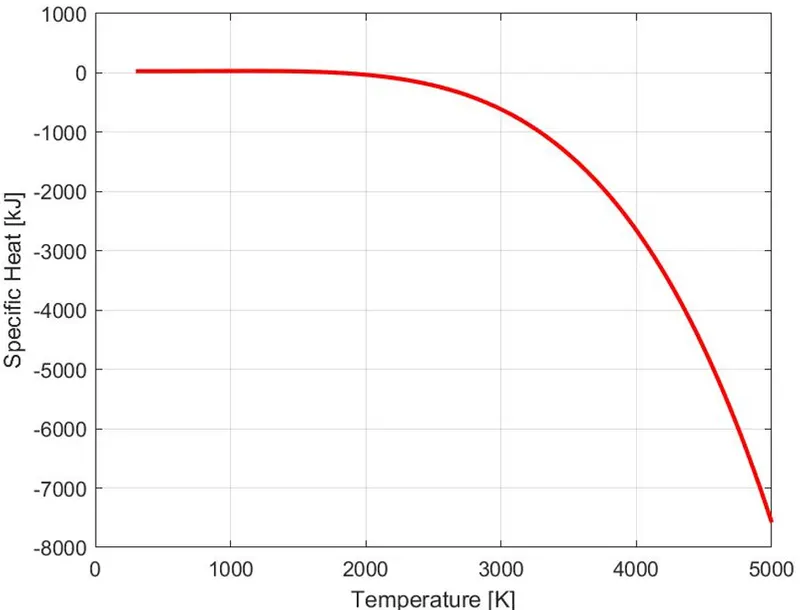
Plots of CO2