Project 1 - Parsing NASA thermodynamic data
- AIM:- Write a code in MATLAB to parse the NASA thermodynamics data file and then calculate thermodynamics prperties of various gas species.
- OBJECTIVE:-
1) writting a function that extracts the 14 co-efficients and calculate the enthaply , entropy and specific heat for all the species in data file.
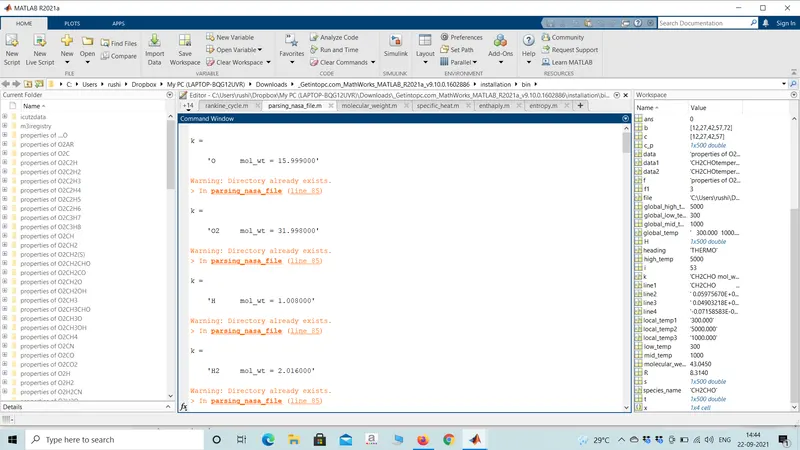
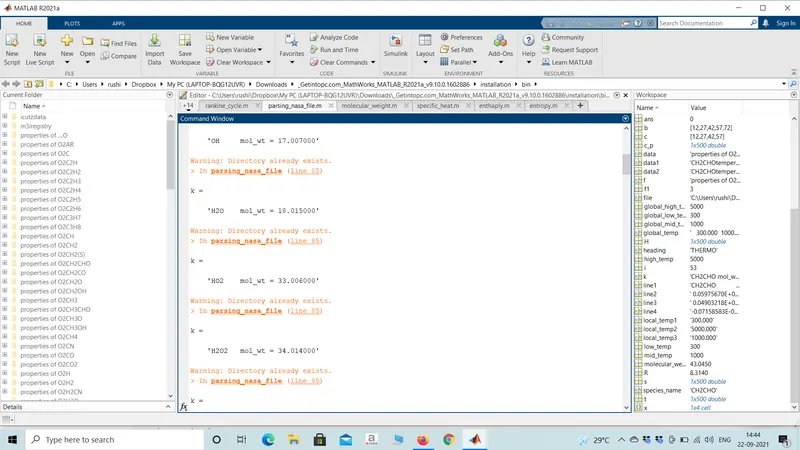
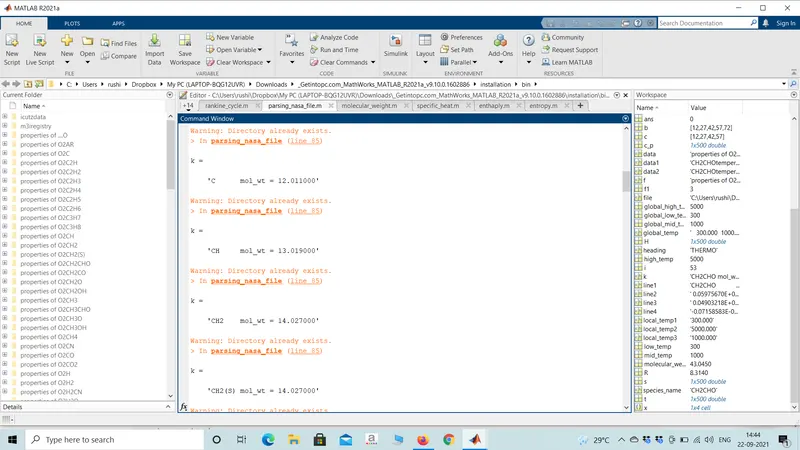
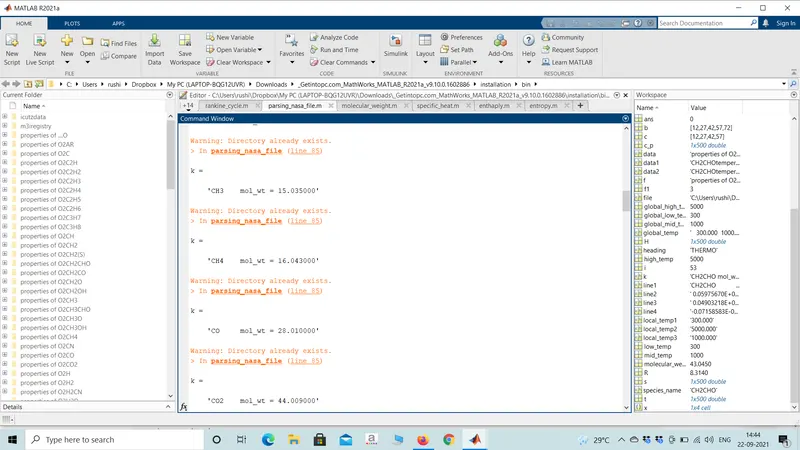
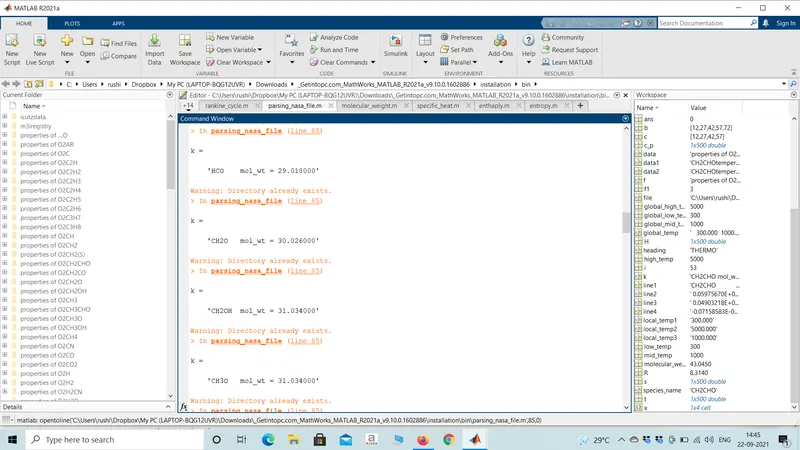
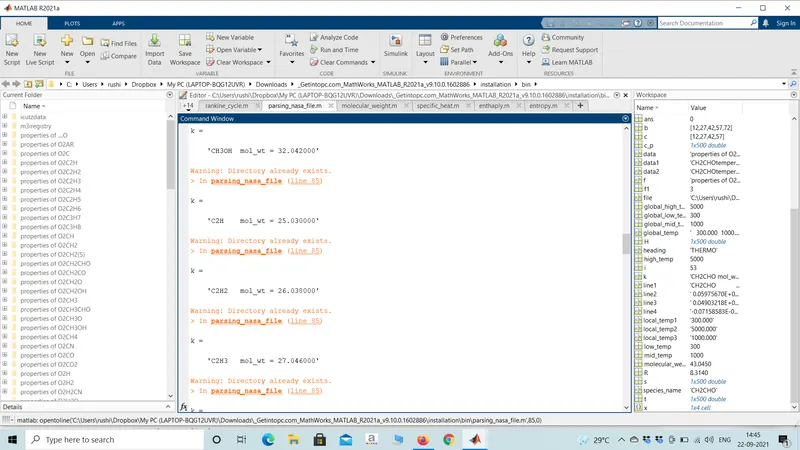
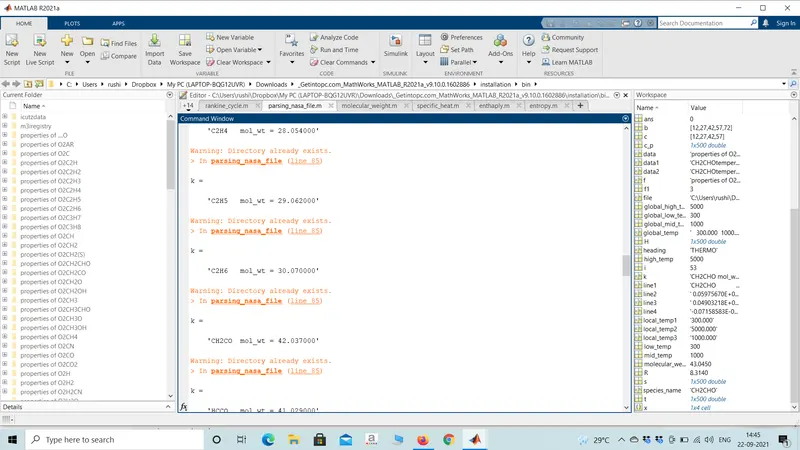
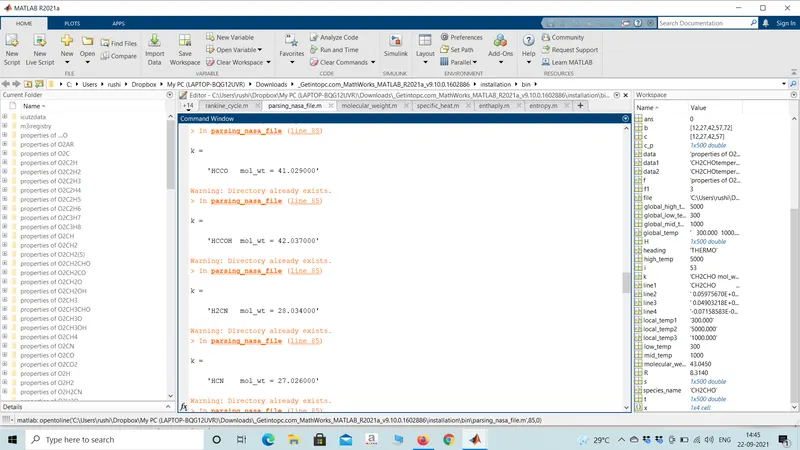
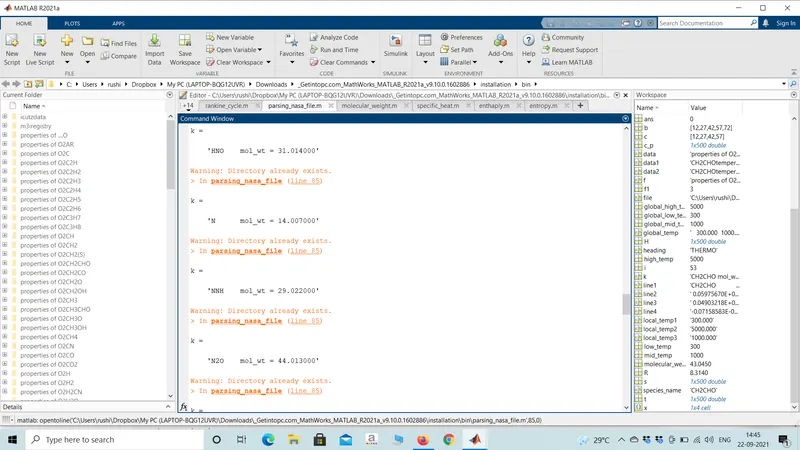
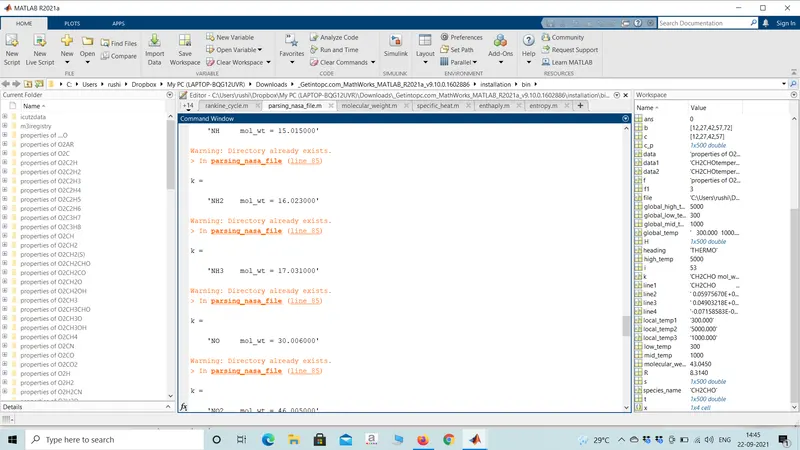
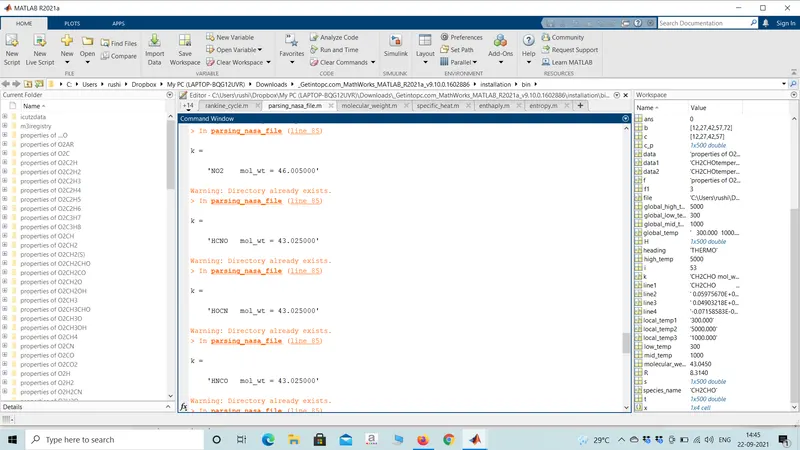
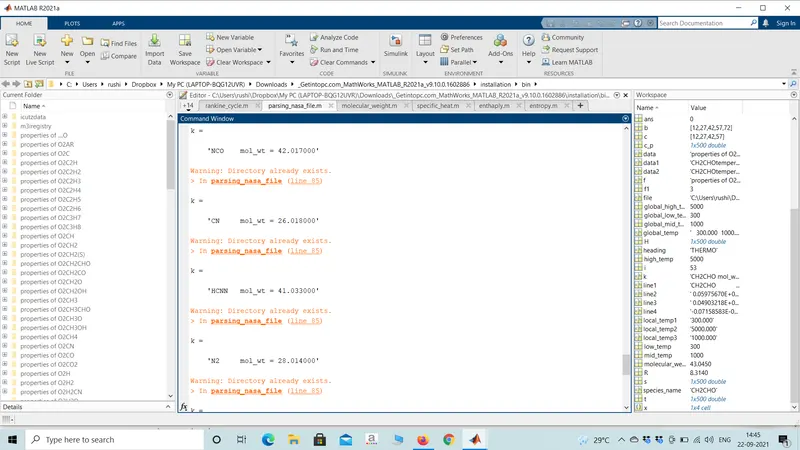
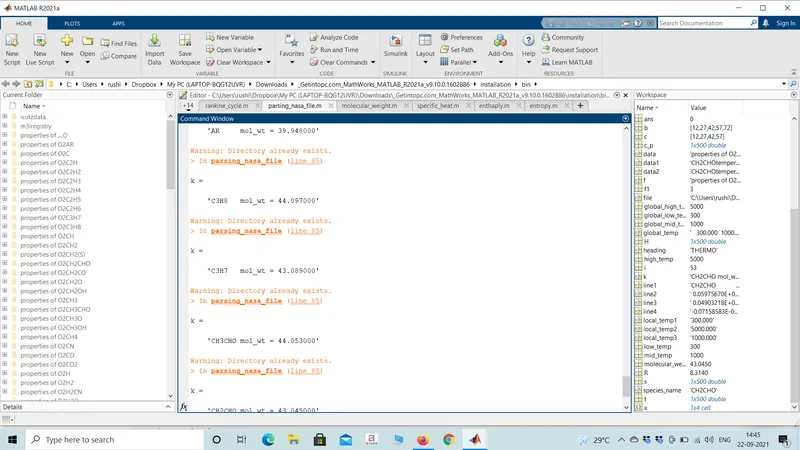
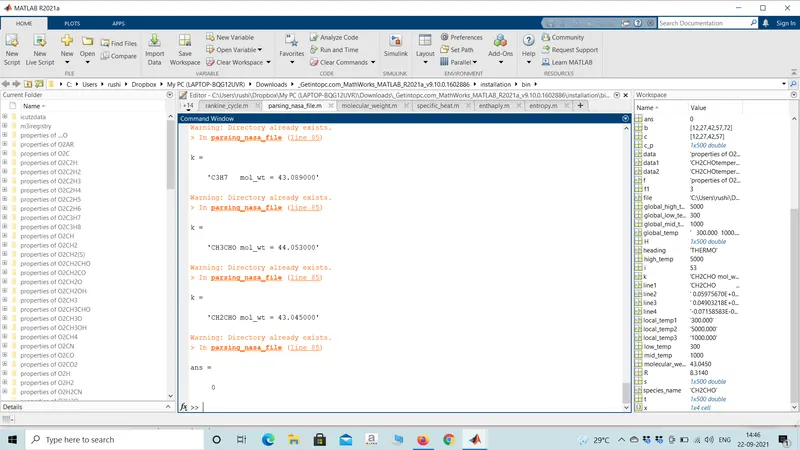
2) Calculate the molecular weight of each species and displaying it in command window.
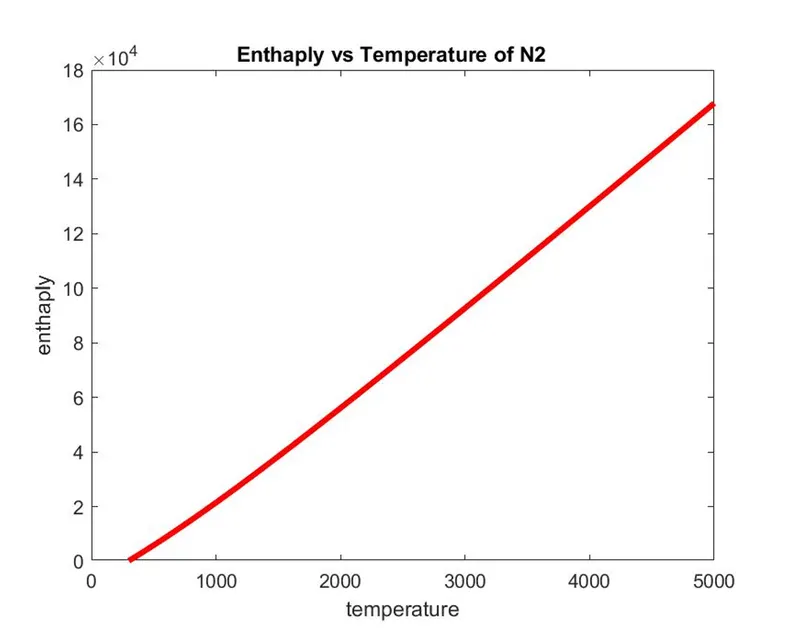
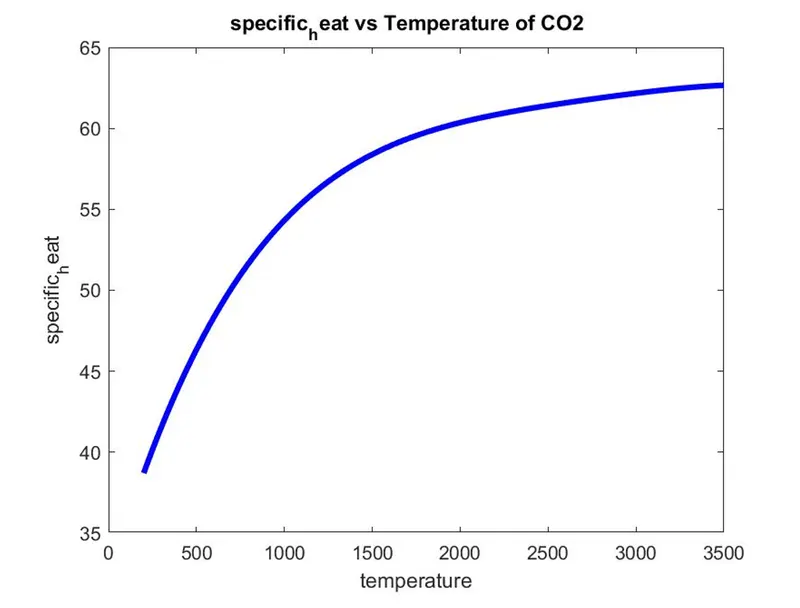
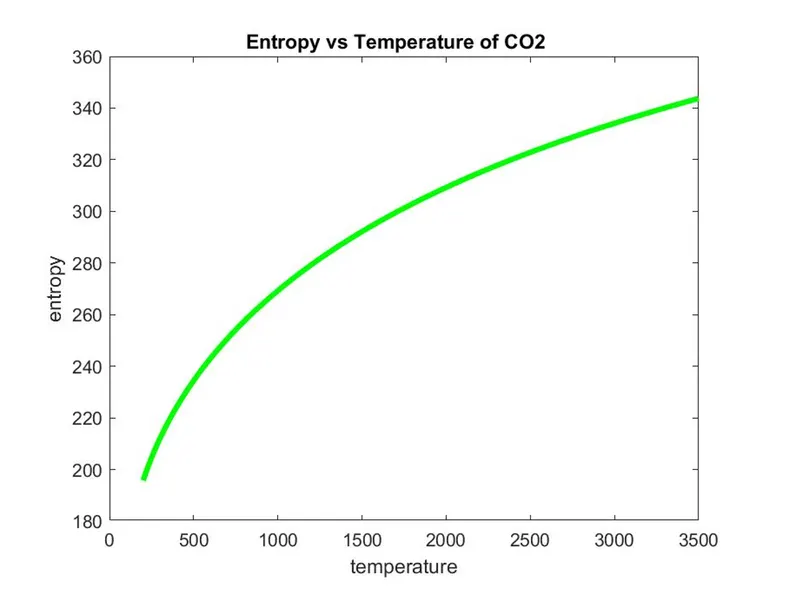
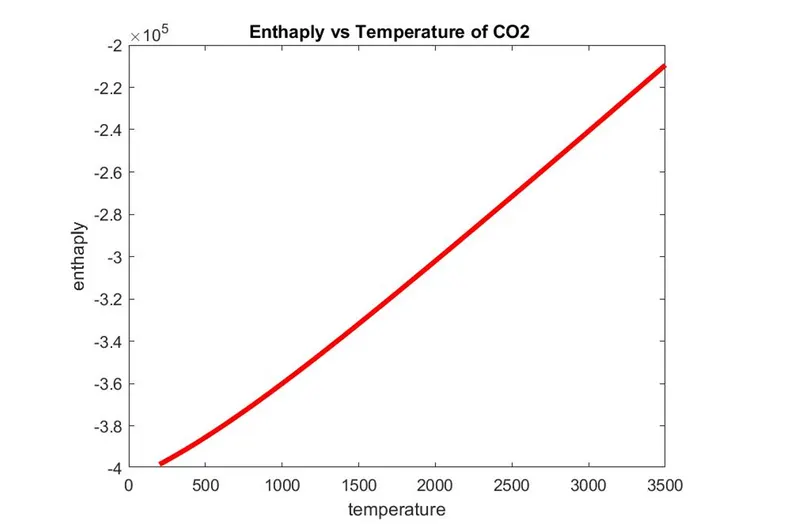
3) plotting the cp , Enthaply and Entropy for the local temperature range (low temperature: high temperature) specific for each sepecies.
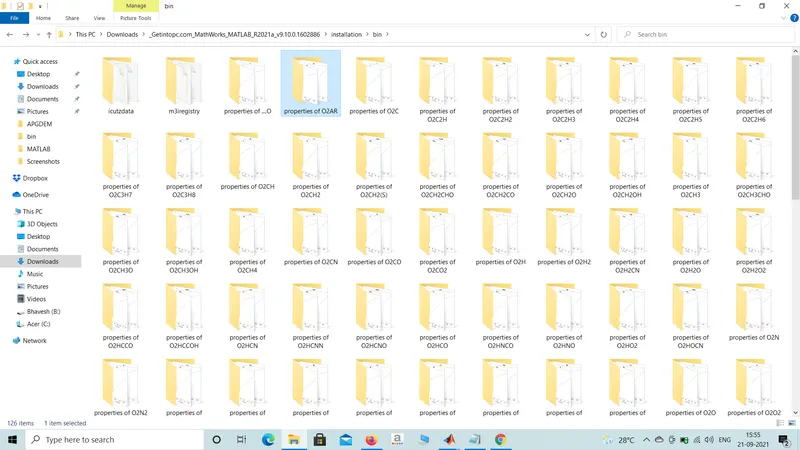
4) saving the plots as image with appropriate them in seprate folder for each species and suitable name.
- THEORY:-
File parsing -
parsing a file means reading in a data steam of some sort and building an in memory model of the semantic content in the data . this aim at faciliating performing some kind of transformation on the data.
Specific Heat -
The specific heat is the amount of heat per unit mass required to raise the temperature by one Degree Celsius.the relationship between heat and temperature change is usually expressed in the form of shown below where c is the specific heat.

Entropy-
Entropy the measure of a system thermal energy per unit temperature that is unavailable for doing usefull work.because work is obtained from ordered molecular motion , the amount of entropy is also a measure of the molecular disorder .

Enthaply-
Enthalpy a property of thermodynamics system is equal to the system internal energy plus the product of its pressure and volume .system contained so as to prevent mass transfer for processes at constant pressure the heat absorbed or released equal the change in enthaply.

- CODE:-
Main code-
close all
clear all
clc
% open the thermal data file
f1 = fopen('THERMO.dat','r'); %using fopen command open and read the THERMO.dat file.
% get heading file
heading= fgetl(f1); %assinging the heading to line 1 fgetl(),returns the next line without new line character.
% global temperature values
global_temp = fgetl(f1); %assinging the global temperatures value to line 2 fgetl(),returns the next line without new line character.
x = strsplit(global_temp);
global_low_temp = str2double(x{2}); %assinging the global low temperatures from arrray A is array number
global_mid_temp = str2double(x{3}); %assinging the global mid temperatures from arrray A is array number
global_high_temp = str2double(x{4}); %assinging the global high temperatures from arrray A is array number
fgetl(f1);
fgetl(f1);
fgetl(f1);
for i = 1:53 % running for loop for evvery molecules.
line1 = fgetl(f1); %assinging the molecule data first line from the file to species.
species_name = line1(1:6); %assinging the species name from the 1st 6 elements of species array.
% local temperature
local_temp1 = line1(49:55);
low_temp = str2double(local_temp1); %assinging the global low temperatures from arrray B is array number
local_temp2 = line1(58:65);
high_temp = str2double(local_temp2); %assinging the global mid temperatures from arrray B is array number
local_temp3 = line1(68:75);
mid_temp = str2double(local_temp3); %assinging the global high temperatures from arrray B is array number
% extracting the coefficient
line2 = fgetl(f1); %assinging the molecule data
line3 = fgetl(f1);
line4 = fgetl(f1);
a=strfind(line2,'E'); % Finding the 'E' letter in line2 differntiate the data
b=strfind(line3,'E');% Finding the 'E' letter in line3 differntiate the data
c=strfind(line4,'E');% Finding the 'E' letter in line4 differntiate the data
% extracting coefficient of high temperature
a1 = str2double(line2(1:a(1)+3));
a2 = str2double(line2(a(1)+4:a(2)+3));
a3 = str2double(line2(a(2)+4:a(3)+3));
a4 = str2double(line2(a(3)+4:a(4)+3));
a5 = str2double(line2(a(4)+4:a(5)+3));
a6 = str2double(line3(1:b(1)+3));
a7 = str2double(line3(b(1)+4:b(2)+3));
% extracting coefficient of low temperature
a8 = str2double(line3(b(2)+4:b(3)+3));
a9 = str2double(line3(b(3)+4:b(4)+3));
a10 = str2double(line3(b(4)+4:b(5)+3));
a11 = str2double(line4(1:c(1)+3));
a12 = str2double(line4(c(1)+4:c(2)+3));
a13 = str2double(line4(c(2)+4:c(3)+3));
a14 = str2double(line4(c(3)+4:c(4)+3));
% universal gas constant
R = 8.314;
t = linspace(low_temp,high_temp,500);
%calculating specific heat
c_p = specific_heat(a1,a2,a3,a4,a5,a8,a9,a10,a11,a12,mid_temp,R,t);
%calculating enthaply
H = enthaply(a1,a2,a3,a4,a5,a6,a8,a9,a10,a11,a12,a13,R,t,mid_temp);
%calculating entropy
s = entropy(a1,a2,a3,a4,a5,a7,a8,a9,a10,a11,a12,a14,R,t,mid_temp);
molecular_weight_calc = molecular_weight(species_name);
k = sprintf('%s mol_wt = %f', species_name,molecular_weight_calc)
% creating folder
data = strcat('properties of O2', species_name);
mkdir(data);
file = pwd;
% plotting
figure(1)
plot(t,c_p)
data1 = strcat(species_name,'temperature vs specific_heat');
xlabel('temperature')
ylabel('specific_heat')
title(species_name);
f = fullfile(data);
cd(f)
saveas(gcf,[pwd '/specific_heat vs temperature .jpg'])
cd(file)
figure(1)
plot(t,c_p)
data1 = strcat(species_name,'temperature vs specific_heat');
xlabel('temperature')
ylabel('specific_heat')
title(species_name);
f = fullfile(data);
cd(f)
saveas(gcf,[pwd '/specific heat vs temperature .jpg'])
cd(file)
figure(2)
plot(t,H)
data2 = strcat(species_name,'temperature vs enthaply');
xlabel('temperature')
ylabel('enthaply')
title(species_name);
cd(f)
saveas(gcf,[pwd '/enthaply vs temperature .jpg'])
cd(file)
figure(3)
plot(t,s)
data1 = strcat(species_name,'temperature vs entropy');
xlabel('temperature')
ylabel('entropy')
title(species_name);
cd(f);
saveas(gcf,[pwd '/entropy vs temperature .jpg'])
cd(file)
end
fclose(f1)
EXPLANATION OF THE MATLAB CODE:-
1. First open the THERMO.dat file to read.
2. Then read the Heading, Global temperatures and next 3 lines.
3. Run a for loop for every species.
- Get the species name.
- Get the local temperatures and after converting them into number we assign them in variables.
- Get all 14 coefficient using strsplit().
- Then calculate the Cp,H and S using the given formula for two temperatures range individually.
- plot the graph T-S,T-H & T-Cp graph and save then to specified folder according to their species name.
- calculate molecualar mmass calling the molecular mass function.
4.close the file
5.The molecular mass is defined in a different script(save the same folder).
Function to find specific heat:-
function c_p = specific_heat(a1,a2,a3,a4,a5,a8,a9,a10,a11,a12,mid_temp,R,t);
if t<=mid_temp
c_p = (a8+a9.*t+a10.*t.^2+a11.*t.^3+a12.*t.^4).*R;
else
c_p = (a1+a2.*t+a3.*t.^2+a4.*t.^3+a5.*t.^4).*R;
end
Function to find Entropy:-
function s = entropy(a1,a2,a3,a4,a5,a7,a8,a9,a10,a11,a12,a14,R,t,mid_temp)
if t<=mid_temp
s = (a8*log(t)+a9.*t+(a10.*t.^2/2)+(a11.*t.^3/3)+(a12.*t.^4/4)+a14).*R;
else
s = (a1*log(t)+a2.*t+(a3.*t.^2/2)+(a4.*t.^3/3)+(a5.*t.^4/4)+a7).*R;
end
Function to find Enthaply:-
function H = enthaply(a1,a2,a3,a4,a5,a6,a8,a9,a10,a11,a12,a13,R,t,mid_temp);
if t<=mid_temp
H = (a8+(a9.*t./2)+(a10.*t.^2/3)+(a11.*t.^3/4)+(a12.*t.^4/5)+(a13./t)).*R.*t;
else
H = (a1+(a2.*t./2)+(a3.*t.^2/3)+(a4.*t.^3/4)+(a5.*t.^4/5)+(a6./t)).*R.*t;
end
- ERRORS:-
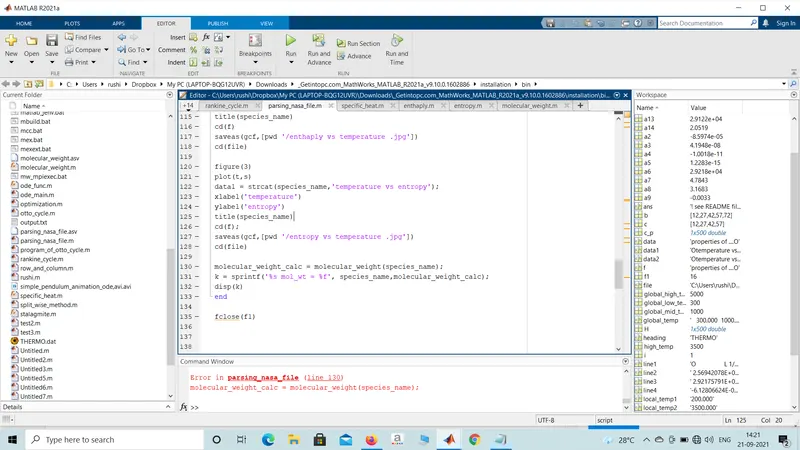
This Line write above the creating folder comments and then problem we solve .
- Final Result of Plotting:-
plot of species O2-
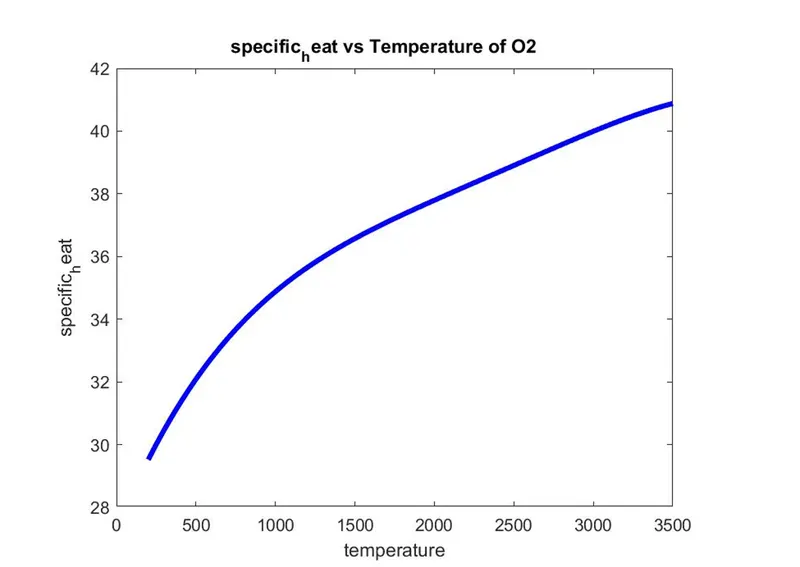
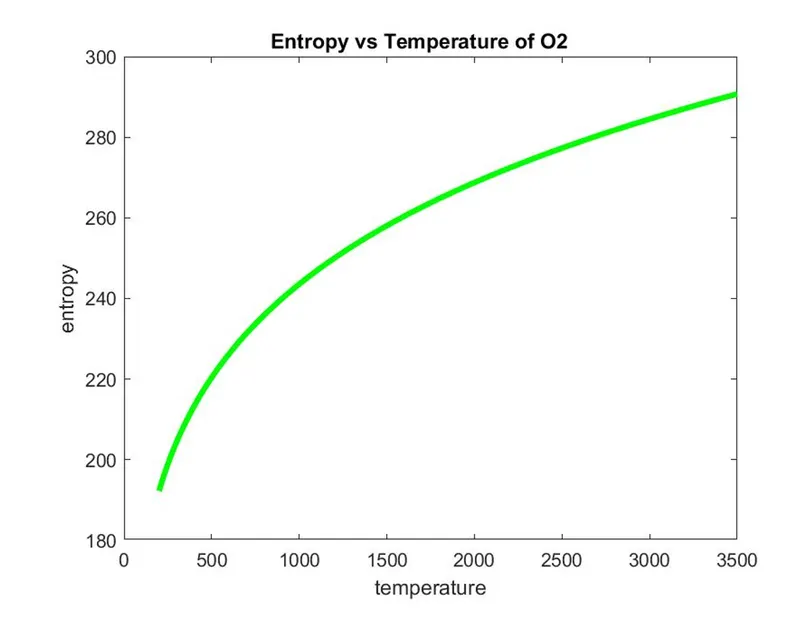
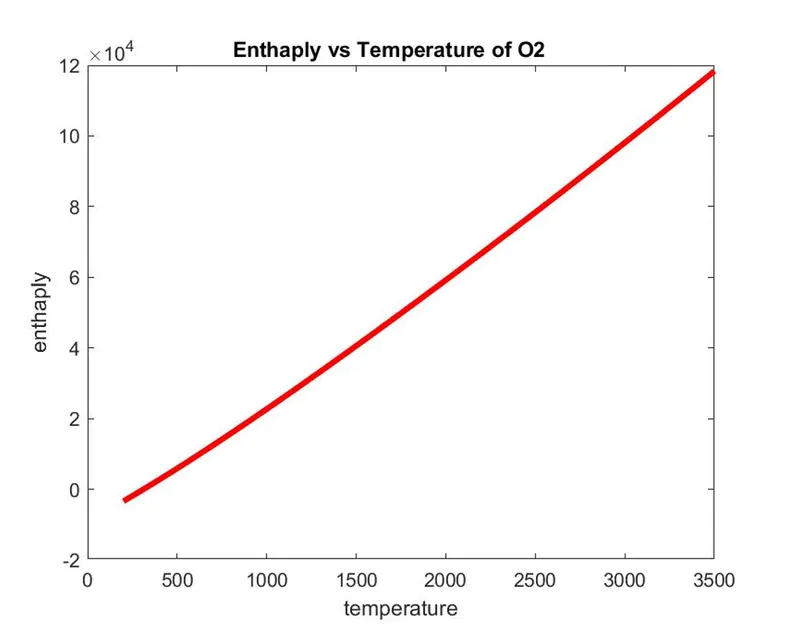
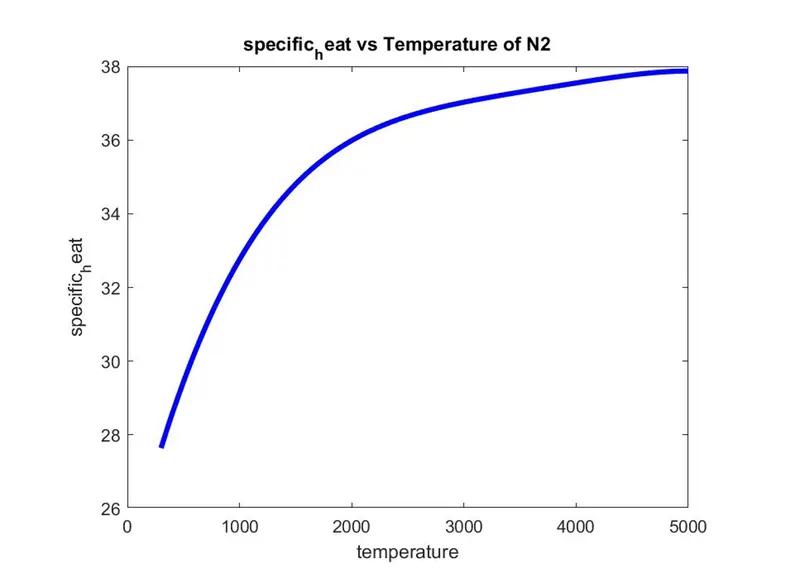
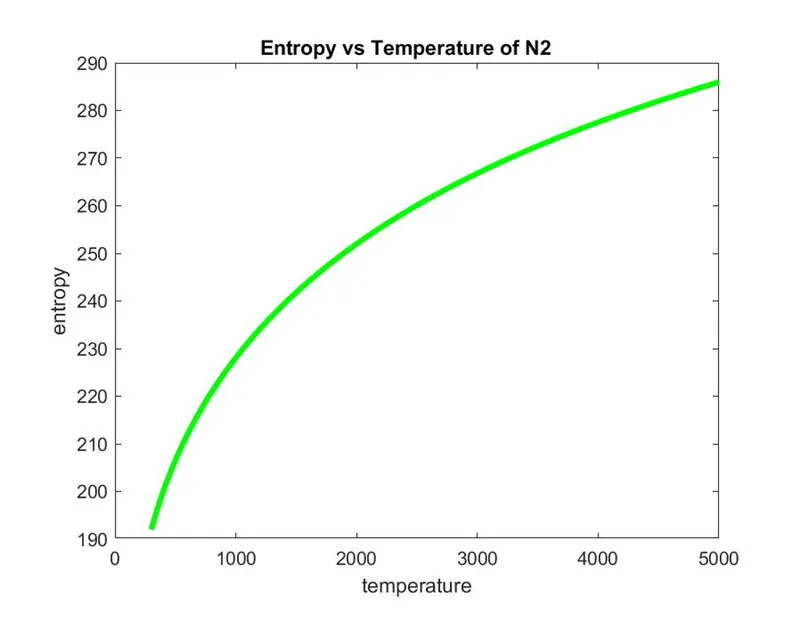
plot of species N2-
plot of species CO2-
Screenshot of the Directory where diffrent species are saved:-
Molecular Weight of each species:-