Project 1 - Parsing NASA thermodynamic data
%% Parsing the NASA thermodynamic species Data
clear all
close all
clc
A = fopen('THERMO.dat','r');

Title = fgetl(A);
t= strsplit(fgetl(A),' ');
% extracting global temperature values from the t array above
global_lowtemp = t(2);
global_midtemp = t(3);
global_hightemp = t(4);
for i =1:3
    fgetl(A)
end
SP_index = 1:53;
%%program code for extracting coeffs of all species using for loop
mkdir('species') % created a folder in the current directory to store the each species folders
for i = 1:length(SP_index)
    l = fgetl(A);
    L_input = strsplit(l, ' '); % creates a cell array, if used splitstring command
    SP_name = L_input{1};
         SP_lowtemp = str2double(L_input(length(L_input)-3));
         SP_midtemp = str2double(L_input(length(L_input)-1));
         SP_hightemp = str2double(L_input(length(L_input)-2));
         L1 = fgetl(A); % extracting first 5 coeffs from the line1 using fgetl
         read = strfind(L1,'E');
         for j =1:length(read)
            c(j) = str2double(L1(read(j)-11:read(j)+3));
         end
         L2 = fgetl(A); % extracting first 5 coeffs from the line1 using fgetl
         read = strfind(L2,'E');
         for j =1:length(read)
            d(j) = str2double(L2(read(j)-11:read(j)+3));
         end
         L3 = fgetl(A); % extracting first 5 coeffs from the line1 using fgetl
         read = strfind(L3,'E');
         for j =1:length(read)
            e(j) = str2double(L3(read(j)-11:read(j)+3));
         end
         coeff = [c,d,e]; % horizontal concat the coeffs in 'coeff' matrix
         Molecularweight = Mol_wt(SP_name); % calls a function to store the molecular_wt of each species

  %% plotting and saving
    folder = L_input{1};

    T = linspace(SP_lowtemp,SP_hightemp,1000);
    R = 8.314; % univeral gas constant
    for k = 1:length(T)
        [Cp(k),H(k),S(k)] = Thermo_formulas(coeff,T(k),SP_midtemp,R);
    end
    figure(1)
    plot(T,Cp,'color','r');
    xlabel('Temperature')
    ylabel('Specific Heat')
    figure(2)
    plot(T,H,'color','b');
    xlabel('Temperature')
    ylabel('Enthalpy')
    figure(3)
    plot(T,S,'color','g');
    xlabel('Temperature')
    ylabel('Entropy')

    cd('C:\Users\Adimin\OneDrive\Documents\matlab\species') % now we are inside the species folder created in line 18
    mkdir(SP_name) % created individual folder name dedicated to each species x 53 times
    cd(SP_name) % now we are inside the respective species folder to store the figures
    saveas(figure(1),'Specific_heat vs Temp.jpg')
    saveas(figure(2),'Enthalpy vs Temp.jpg')
    saveas(figure(3),'Entropy vs Temp.jpg')
    cd('C:\Users\Adimin\OneDrive\Documents\matlab')
    fprintf('Molecular weight of %s is %f.',SP_name,Molecularweight)

end
%% function to return Specific heat, Enthalpy & Entropy values to the selected species
function [Cp, H, S] = Thermo_formulas(C,T,T_M,R)
if T > T_M % using high temperature coeffs to calculated the properties of the species
Cp = R*(C(1) + C(2)*T + C(3)*T^2 +C(4)*T^3 +C(5)*T^4);
H = R*T*(C(1) + C(2)*T/2 + C(3)*T^2/3 +C(4)*T^3/4 +C(5)*T^4/5+ C(6)/T);
S = R*(C(1)*log(T) + C(2)*T + C(3)*T^2/2 +C(4)*T^3/3 +C(5)*T^4/4+C(7));
else % using low temperature coeffs to calculated the properties of the species
Cp = R*(C(8) + C(9)*T + C(10)*T^2 +C(11)*T^3 +C(12)*T^4);
H = R*T*(C(8) + C(9)*T/2 + C(10)*T^2/3 +C(11)*T^3/4 +C(12)*T^4/5+ C(13)/T);
S = R*(C(8)*log(T) + C(9)*T + C(10)*T^2/2 +C(11)*T^3/3 +C(12)*T^4/4+C(14));
end
endfunction below is used to calculate the Molecular weight of any given species made up with constituents like C,N,H,O,S.
function [M] = Mol_wt(name)

input = ['C','H','N','O','S'];
At_wt = [12,1,14,16,32];
M = 0;
for i = 1:length(name) % using the name entered, for every character in the string is compared with standard constituent format
    for j = 1:length(input)
        if(strcmpi(input(j),name(i))) == 1
            M = M + At_wt(j);
            Mc = j;
        end
    end
    n = str2double(name(i)); % this part of the code is to include the integer part in the species name
    if n>1;
        M = M + (At_wt(Mc)*(n-1));
    end
end
end
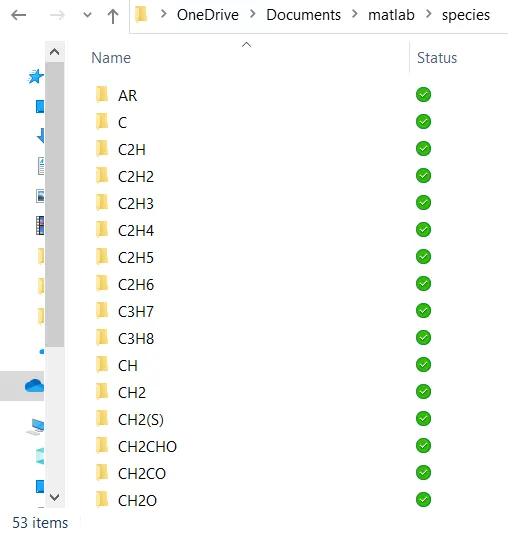
Ouput folder saving each species name:
output plots for O2 gas
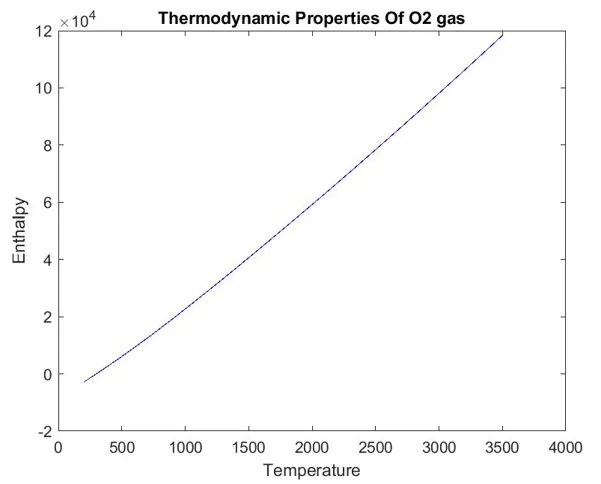
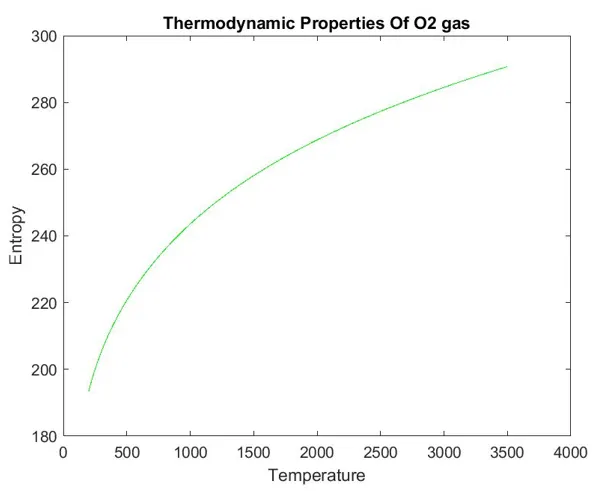
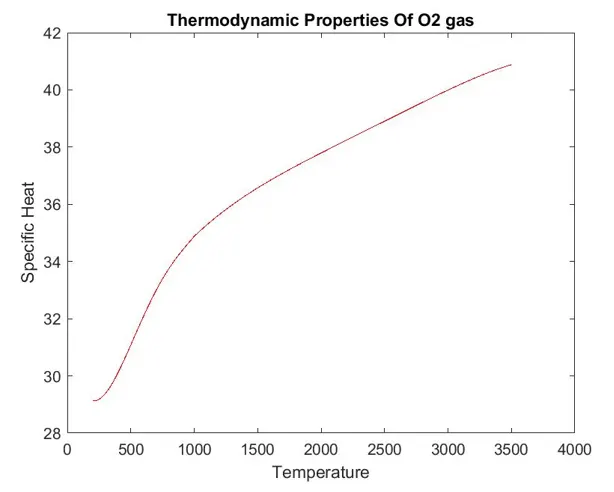
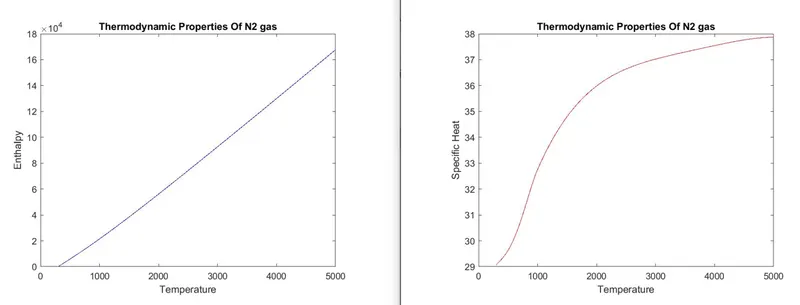
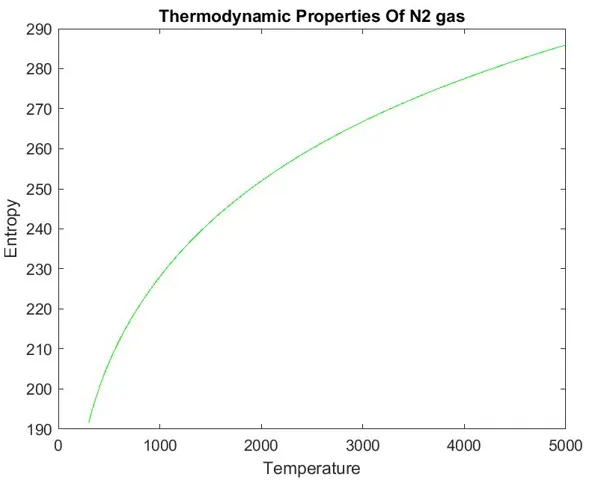
output plots for N2
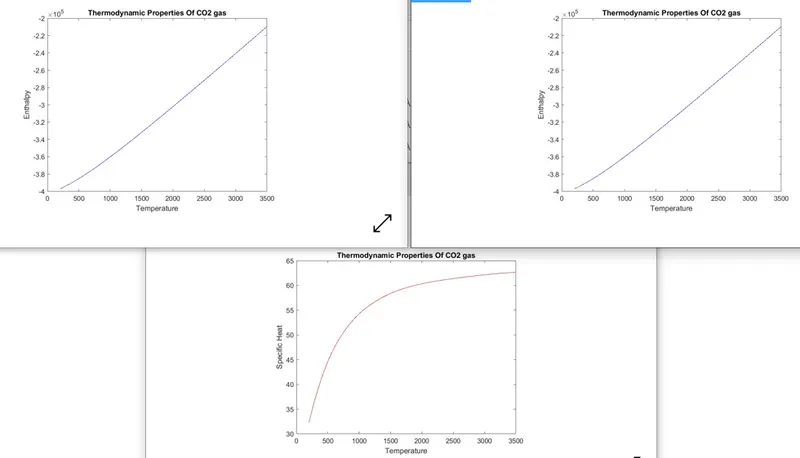
Output plot for Co2
Error faced
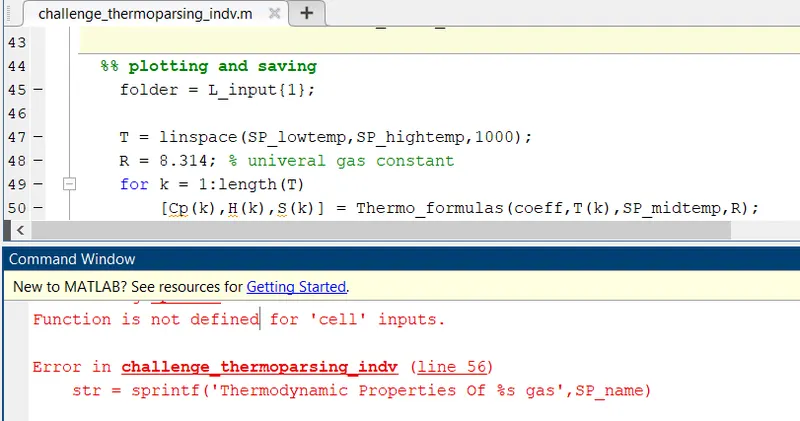
since the splitstring return a cell array, in which all elements are in character datatype. in order to assign a variable to any element in the output of splitstring, we need to use curly braces, which indicates its a character element.