Project 1 - Parsing NASA thermodynamic data
Aim :
To write a function that extracts the co-efficients and calculate the enthalpy, entropy and specific heats for all the species in the data file
To calculate the molecular weight of each species and display it in the command window.
To plot the Cp, Enthalpy and Entropy for the local temperature range
To save the plots as images with appropriate names and load them in separate folders for individual species.
Introduction :
In this project, we will be reading the NASA thermodynamic data and then calculat the thermodynamic properties such as specific heat, Enthalpy, Entropy and molecuar weight of various species and plot graph for them.
Working Algorithm :
The program begins with the clear all, close all and clc command to free up the command window and the workspace
Here the data is read from the external NASA thermodynamic file using fopen(to open the file) and fgetl(to read the content in the file line by line) commands
The useful header information will be extracted from the file such as global temperature limits.
Then we will proceed to extract the individual species data of all the species present in the file using fgetl command.
The data that is to be extracted for all the 53 species mentiond in the file are 14 coefficients, species name and local temperature limit.
This process is carriedout with the help of for loop
Calculation of specific heat, enthalpy, entropy and molecular weight will be done in separate function files and will be called in the main program
Then plots for each 53 species is created and saved in separate folders
Then the molecular weight of each species in shown in the command window.
Code :
clear all
close all
clc

%getting the data file
f1=fopen('THERMO.dat','r');
fgetl(f1)
%reading the header information
A=fgetl(f1);
A=strsplit(A,' ');
global_low_temp=str2num(A{2});
global_mid_temp=str2num(A{3});
global_high_temp=str2num(A{4});

%skipping next three lines
for i=1:3
    fgetl(f1);
end

%reading the species
for i=1:53

    header=fgetl(f1);
    x=strsplit(header,' ');

    species_name=(x{1});
    z=length(x);

    local_low_temp=str2double(x{z-3});
        local_high_temp=str2double(x{z-2});
            local_mid_temp=str2double(x{z-1});

            t1=local_low_temp;
            t2=local_mid_temp;
            t3=local_high_temp;

            %getting first line coeffecients (a1-a5)
            line_1=fgetl(f1);

            a=strfind(line_1,'E');
            a1=str2double(line_1(1:a(1)+3));
            a2=str2double(line_1(a(1)+4:a(2)+3));
            a3=str2double(line_1(a(2)+4:a(3)+3));
            a4=str2double(line_1(a(3)+4:a(4)+3));
            a5=str2double(line_1(a(4)+4:a(5)+3));

            %getting second line coeffeceints (a6-a10)
             line_2=fgetl(f1);

            a_1=strfind(line_2,'E');
            a6=str2num(line_2(1:a_1(1)+3));
            a7=str2double(line_2(a_1(1)+4:a_1(2)+3));
            a8=str2double(line_2(a_1(2)+4:a_1(3)+3));
            a9=str2double(line_2(a_1(3)+4:a_1(4)+3));
            a10=str2double(line_2(a_1(4)+4:a_1(5)+3));

            %getting third line coeffeceints (a10-a14)
             line_3=fgetl(f1);

            a_2=strfind(line_1,'E');
            a11=str2double(line_3(1:a_2(1)+3));
            a12=str2double(line_3(a_2(1)+4:a_1(2)+3));
            a13=str2double(line_3(a_2(2)+4:a_1(3)+3));
            a14=str2double(line_3(a_2(3)+4:a_1(4)+3));


            %creating folder
            mkdir(['F:\MATLAB\FP\',species_name]);

            T=linspace(t1,t3,1000);
            R=8.314;
            % to get array of specific heat, enthalpy and entropy
            for k=1:length(T)
    % to compare the species  temperature to assign the coeffeceints
    %a1-a7 (high temperature coeffeceints), a8-a14(low temperature coeffecients)
    if T(k)>t2

        %high temperature coeffeceints.

        cp=(a1+a2.*T+a3.*T.^2+a4.*T.^3+a5.*T.^4)*R;

        H=(a1+(a2.*T)/2+(a3.*T.^2)/3+(a4.*T.^3)/4+(a5.*T.^4)/5+(a6./T))*R.*T;

        S=a1.*log(T)+a2.*T+(a3.*T.^2)/2+(a4.*T.^3)/3+(a5.*T.^4)/4+a7;

    else
        %low temperature coeffecients

        cp=(a8+a9.*T+a10.*T.^2+a11.*T.^3+a12.*T.^4)*R;

        H=(a8+(a9.*T)/2+(a10.*T.^2)/3+(a11.*T.^3)/4+(a12.*T.^4)/5+(a13./T))*R.*T;

        S=a8.*log(T)+a9.*T+(a10.*T.^2)/2+(a11.*T.^3)/3+(a12.*T.^4)/4+a14;
    end
    end


            %plotting the graphs

            figure(1);
            plot(T,cp);
            grid on ;
            title(species_name);
            xlabel('Temperature');
            ylabel('Specific Heat');


            figure(2);
            plot(T,H);
            grid on ;
            title(species_name);
            xlabel('Temperature');
            ylabel('Enthalpy');


            figure(3);
            plot(T,S);
            grid on ;
            title(species_name);
            xlabel('Temperature');
            ylabel('Entropy');


            %changing the directory and saving the file
            cd(['F:\MATLAB\FP\',species_name]);

            saveas(1,'specific heat','jpg');
            saveas(2,'enthalpy','jpg');
            saveas(3,'entropy','jpg');


             %molecular_masscalculation


elements=['H','C','O','N','A'];
atomic_weight=[1.0079 12.0107 15.999 14.0067 39.948];
mol_mass=0;
for l=1:length(species_name)
    for m=1:length(atomic_weight)
        if strcmp(species_name(l),elements(m))
            mol_mass=mol_mass+atomic_weight(m);
            position=m;
        end
    end

n=str2double(species_name(l));
if n>1
    mol_mass=mol_mass+atomic_weight(position)*(n-1);

end
end
sprintf('Molecular Weight of %s:%f u',species_name,mol_mass)


end
             fclose(f1)
Result :
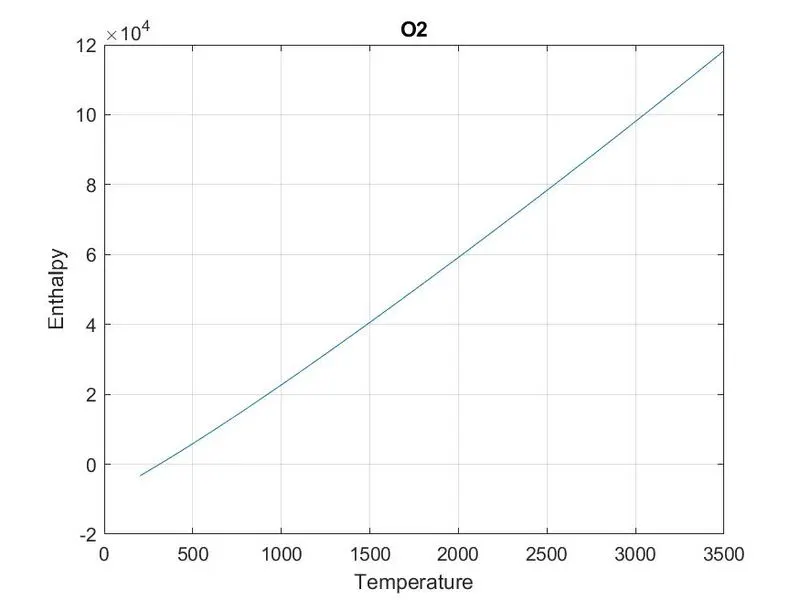
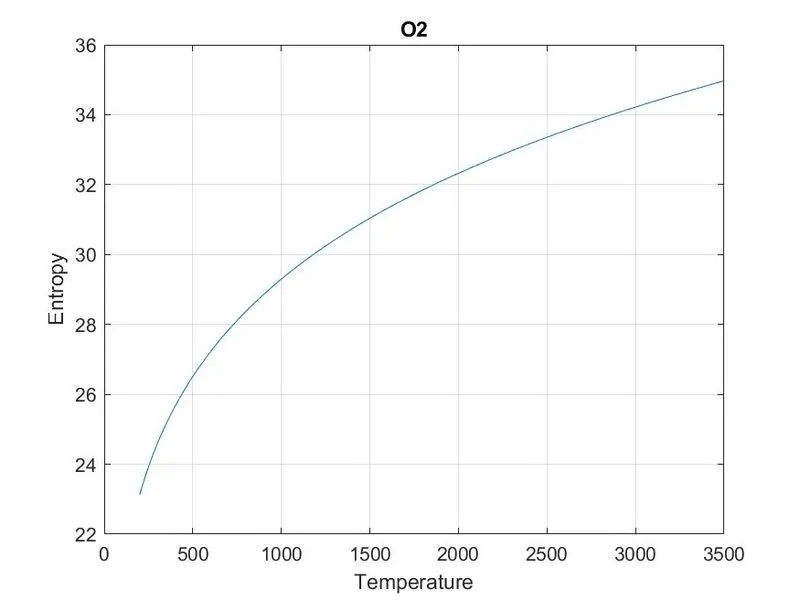
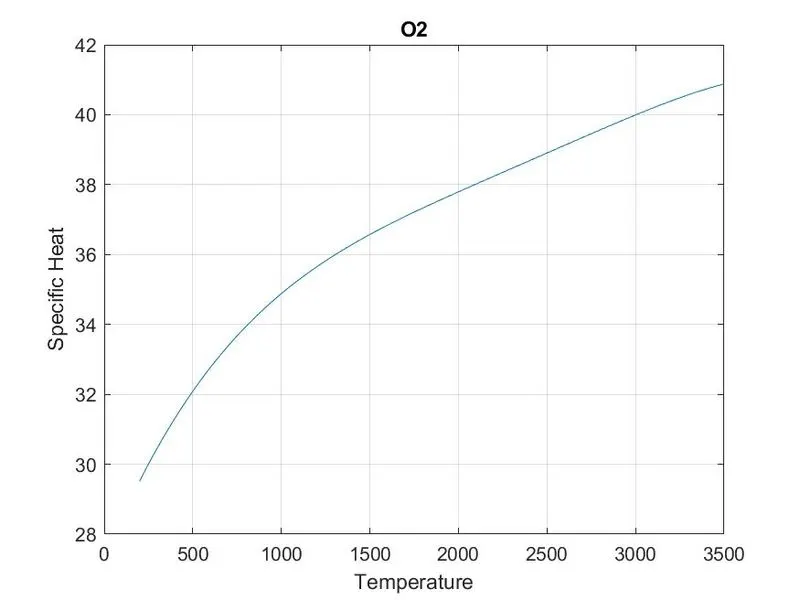
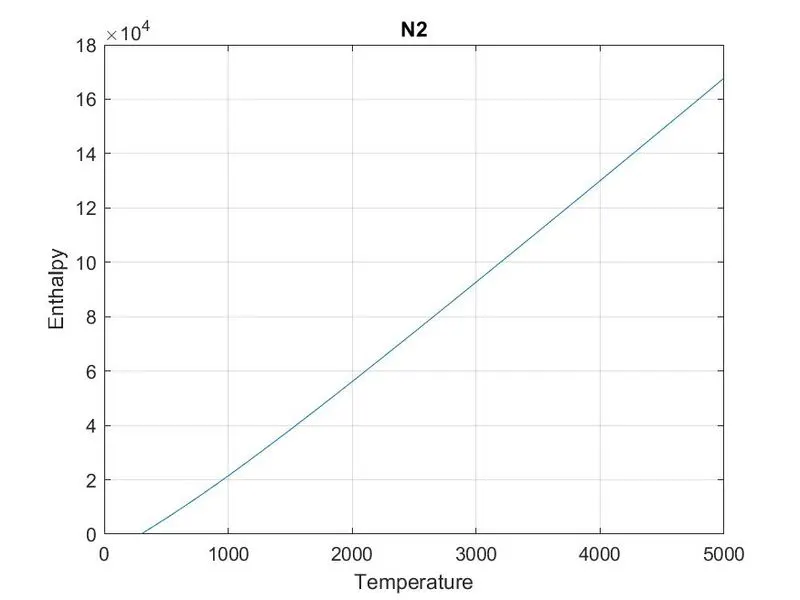
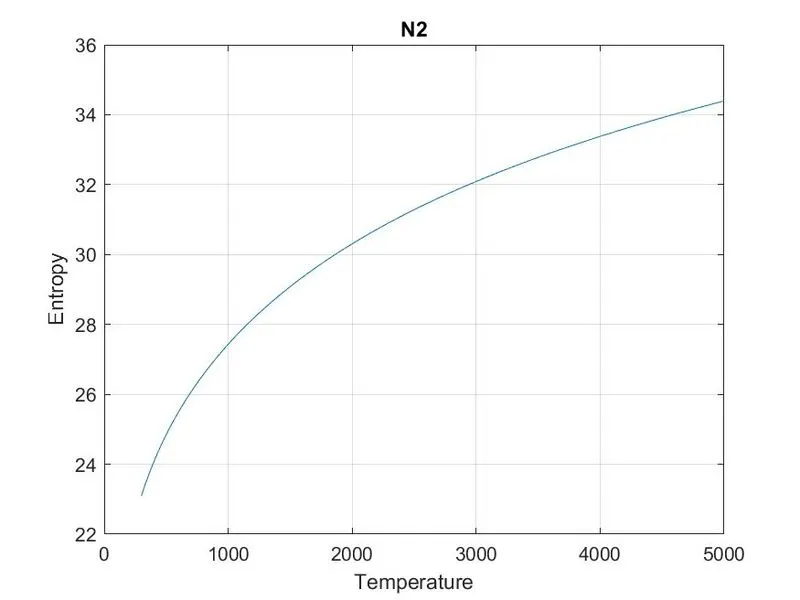
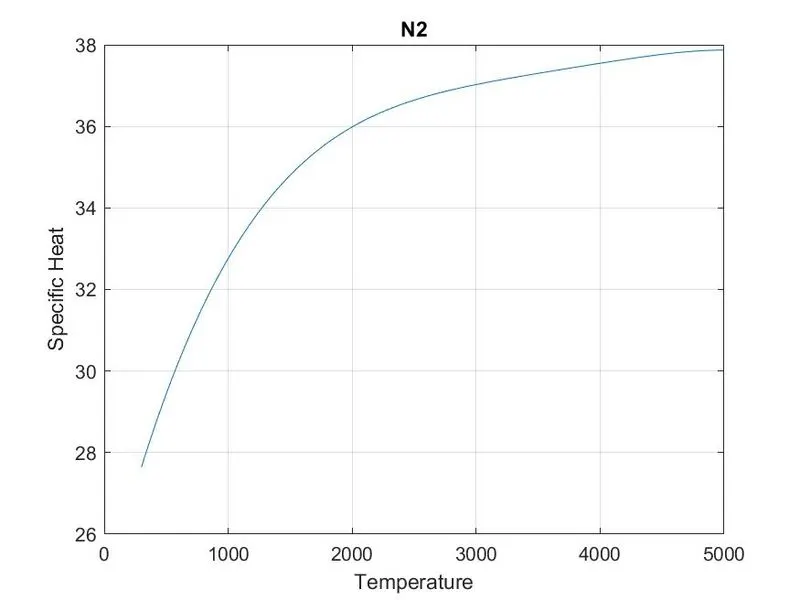
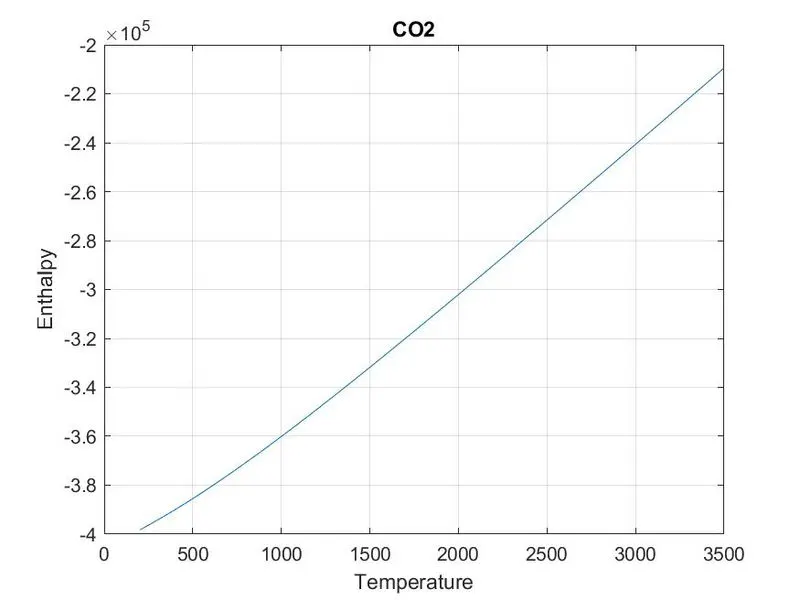
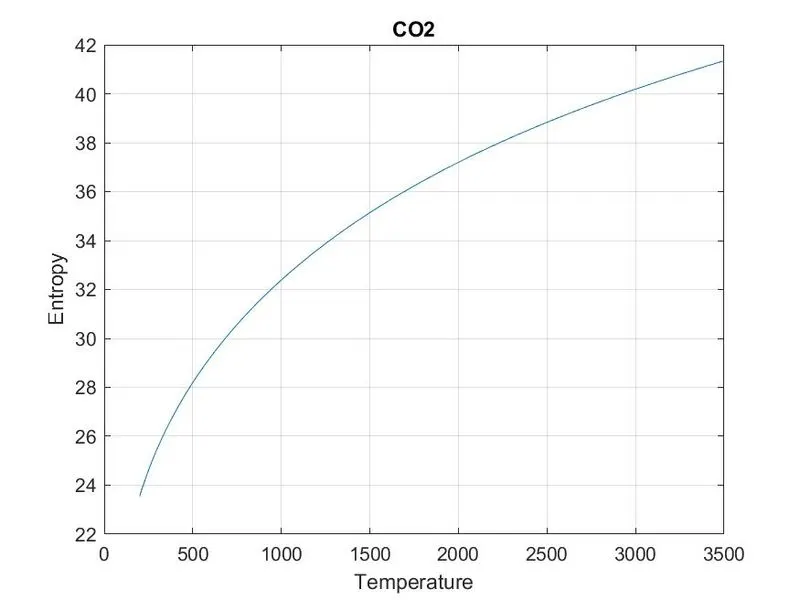
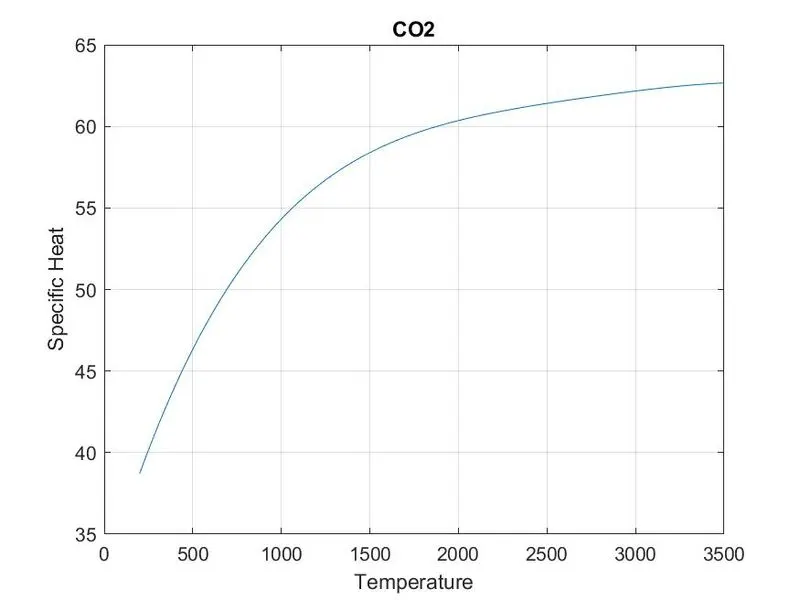

Thus the function that extracts the co-efficients and calculate the enthalpy, entropy and specific heats for all the species in the data file is done