Project 1 - Parsing NASA thermodynamic data
Aim- To Parse the THERMO.dat file and calculate enthalpy,entropy,specific heat and plot their graphs against temperature and store them in individual folders.
Theory-The process of "parsing" can be described as reading in a data stream of some sort and building an in-memory model or representation of the semantic content of that data, in order to facilitate performing some kind of transformation on the data
Formulaes-

Here the temperature varies for each species, the first 7 coefficients are used in high temperature range and the next 7 coefficents are used for low temperature range.
Molecular weight is calculated by the following formulae
Molecular weight=(number of atoms)*(atomic weight), where we calculate the molecular weight of all species.
Code explanation:
- First we open the ‘thermo.dat’ file to read data and extract information using the fopen command, extraction is done with fgetl command
- We call lines from3-5 to eliminate them so that we can call the species block in the file
- The reason we did the above step so that we don’t clutter our output with unnecessary data.
- We make a for loop so that we can fulfil our objective for all the species, total species present is 53
- We use findstr command to find the local temperatue by putting the accurate position of the text from the dat file, similarly for coefficients
- Str2num command is used to convert the data into scalar values
- Mkdir command is used to make a directory to save the plots for each species in individual folders
- For low temp and high temp if loop is used to designate required coefficents for the formula of enthalpy,specific heat.
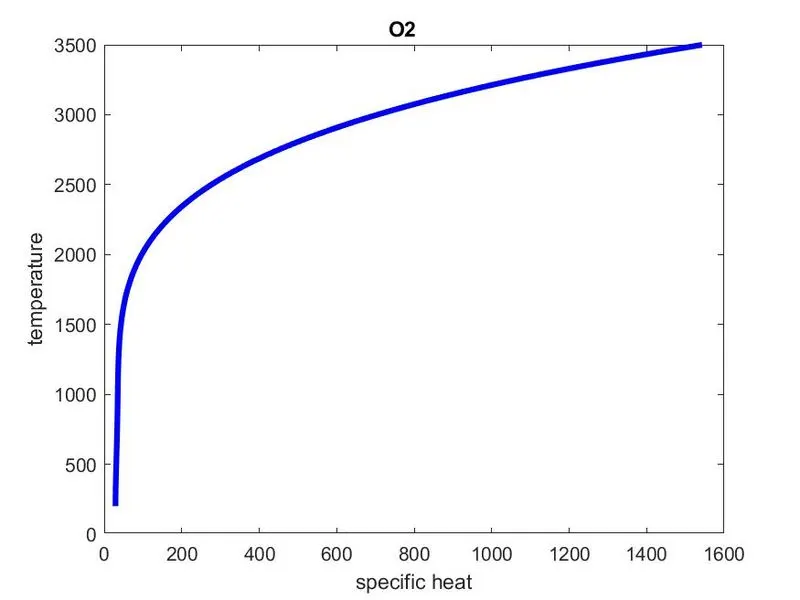
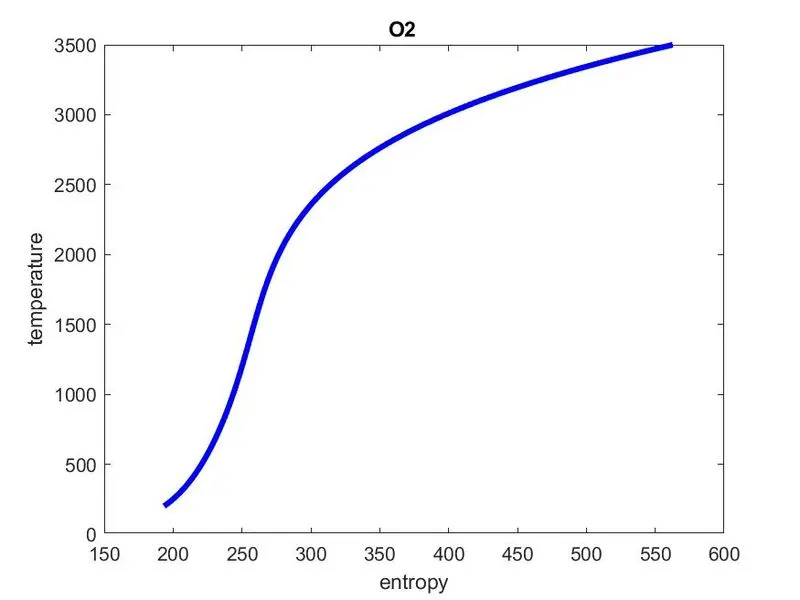
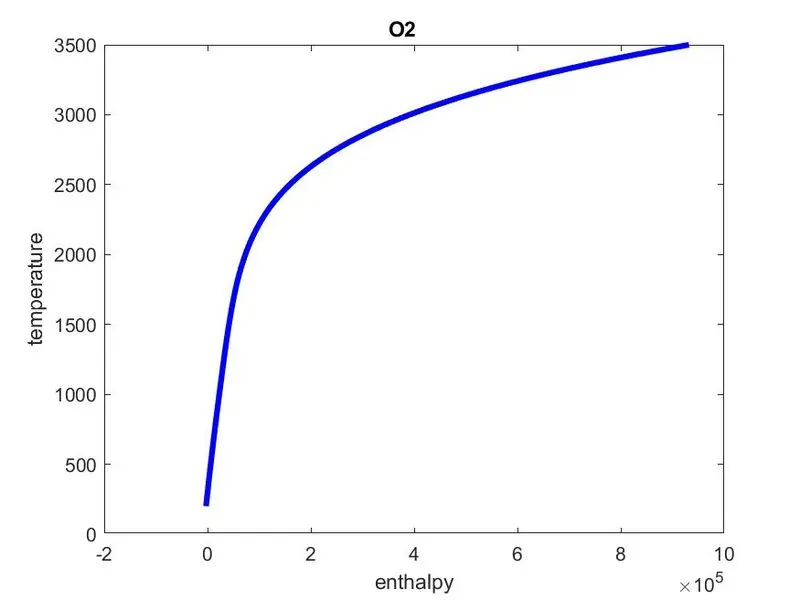
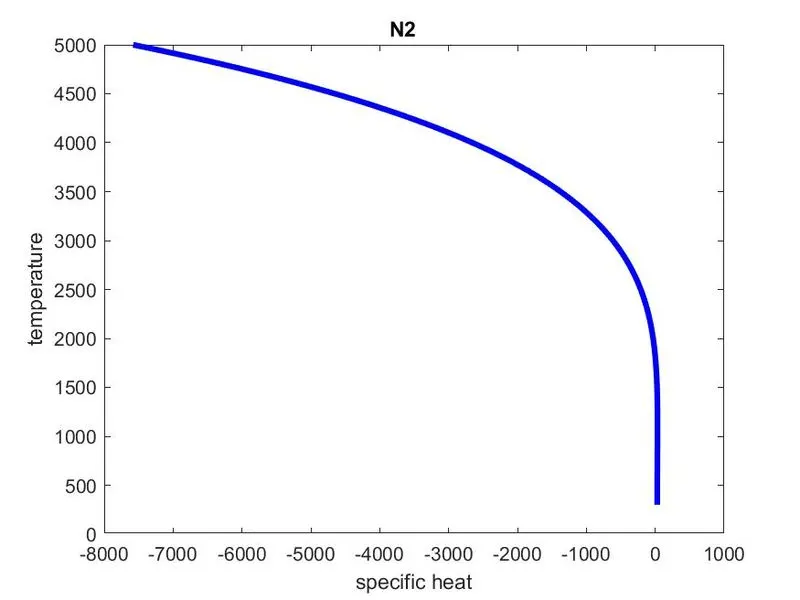
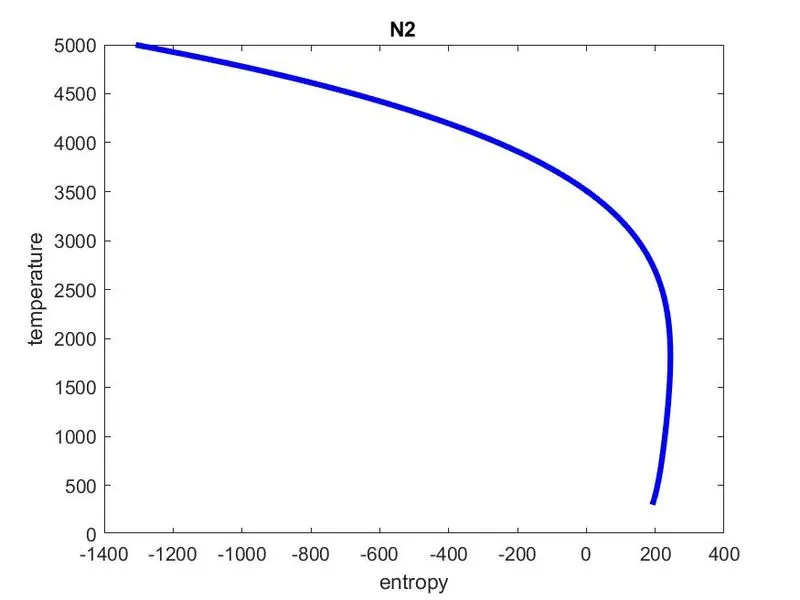
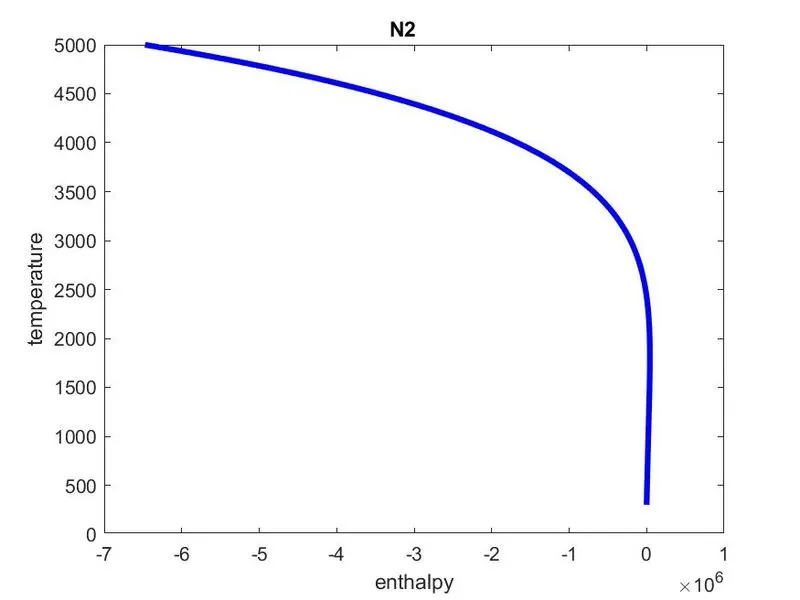
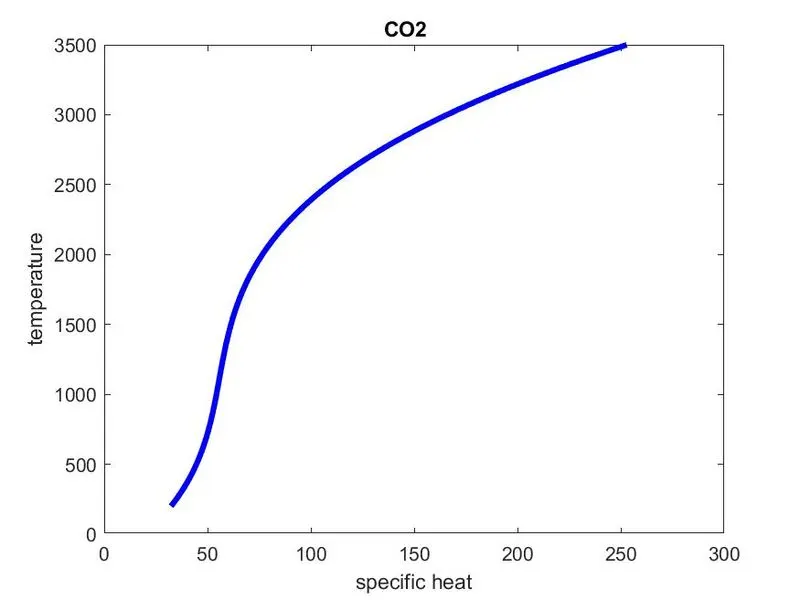
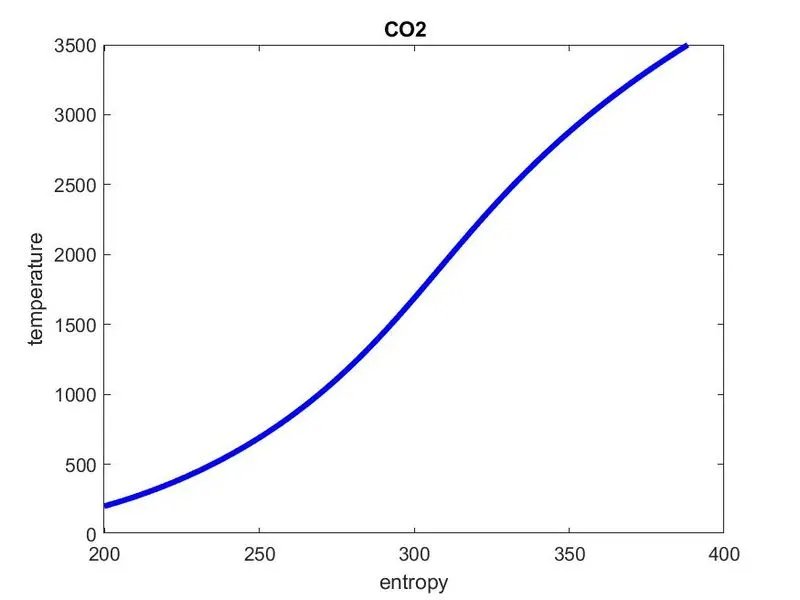
- 3 figures are plotted i.e enthalpy vs temp, specific heat vs temp, entropy vs temp. using the plot command
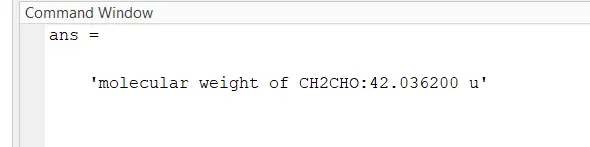
- Molecular weight is calculated my comparing the string of elements with their respective weights using the strcmp command.
- Molecular mass is weight of all the atoms present in a species.
- The name of the species is converted into number by str2num command and subtracting 1 from it we multiply (n-1) to atomic weight because initially we took account of one of the elements of the species.
- Cd command is used to change the directory
- Save as command is used to save the plots
- For loop is ended
- Fclose command is used to stop the code from running
code:
clear all
close all
clc

% reading dat file

f2 = fopen('thermo.dat', 'r');
% reading the header information and eliminating it
fgetl(f2)
fgetl(f2)
fgetl(f2)
fgetl(f2)
fgetl(f2)

% getting the speicies name and temperature
for i=1:53
local_temp = fgetl(f2)
species_name = local_temp(1:6)
t = findstr(local_temp, '.')
local_temp(52-3:52+3)
tl = local_temp(t(1)-3:t(1)+3);
tla = str2num(tl);  % converting to scalar
th = local_temp(t(2)-4:t(2)+3);
tha = str2num(th);  % converting to scalar
tm = local_temp(t(3)-4:t(3)+3);
tma = str2num(tm)    % converting to scalar

% getting coefficients
% line 2 of species block
coff1 = fgetl(f2)
A = findstr(coff1, 'E');
coff1(1:12+3)

a1 = coff1(1:A(1)+3);
z1 = str2num(a1);
a2 = coff1(A(1)+4:A(2)+3);
z2 = str2num(a2);
a3 = coff1(A(2)+4:A(3)+3)
z3 = str2num(a3);
a4 = coff1(A(3)+4:A(4)+3);
z4 = str2num(a4);
a5 = coff1(A(4)+4:A(5)+3);
z5 = str2num(a5);

% line 3 of species block
coff2 = fgetl(f2)
A1 = findstr(coff1, 'E');
coff2(1:12+3)

a6 = coff2(1:A1(1)+3);
z6 = str2num(a6);
a7 = coff2(A1(1)+4:A1(2)+3);
z7 = str2num(a7);
a8 = coff2(A1(2)+4:A1(3)+3)
z8 = str2num(a8);
a9 = coff2(A1(3)+4:A1(4)+3);
z9 = str2num(a9);
a10 = coff2(A1(4)+4:A1(5)+3);
z10 = str2num(a10);

% line 4 of species block
coff3 = fgetl(f2)
A2 = findstr(coff1, 'E');
coff3(1:12+3)

a11 = coff3(1:A2(1)+3);
z11 = str2num(a11);
a12 = coff3(A2(1)+4:A2(2)+3);
z12 = str2num(a12);
a13 = coff3(A2(2)+4:A2(3)+3)
z13 = str2num(a13);
a14 = coff3(A2(3)+4:A2(4)+3);
z14 = str2num(a14);

mkdir(['E:\skill lync practices\month 1 matlab\week 1\species\',species_name]);
% calculating enthalpy, entropy and specific heat
t = linspace(tla,tha,100);
R = 8.314

    if t >tma
        cp = (z1+z2.*t+z3.*t.^2+z4.*t.^3+z5.*t.^4).*R;
        h = (z1+(z2.*t)./2+(z3.T^2)./3+(z4.t^3)./4+(z5.t^4)./5+z6./t).*t.*R;
        s = (z1.*log(t)+z2.*t+(z3.*t.^2)./2+(z4.*t.^3)./3+(z5.*t.^4)./4+z6).*R;
    else
        cp = (z8+z9.*t+z10.*t.^2+z11.*t.^3+z12.*t.^4).*R;
        h = (z8+(z9.*t)/2+(z10.*t.^2)/3+(z11.*t.^3)/4+(z12.*t.^4)/5+(z13./t))*R.*t;
        s = (z8.*log(t)+z9.*t+(z10.*t.^2)./2+(z11.*t.^3)./3+(z12.*t.^4)./4+z14).*R;
    end

figure (1)
plot(cp,t,'linewidth',3, 'color','b')
xlabel('specific heat');
ylabel('temperature');
title(species_name);

figure (2)
plot(s,t,'linewidth',3,'color','b')
xlabel('enthalpy');
ylabel('temperature');
title(species_name);

figure (3)
plot(h,t,'linewidth',3,'color','b')
xlabel('entropy');
ylabel('temperature');
title(species_name);

% molecular weight code
elements = ['H', 'C', 'O', 'N', 'A'];
atomic_weight = [1.0079 12.0107 15.999 14.0067 39.948];
mol_mass = 0;
for j=1:length(species_name)
    for k=1:length(atomic_weight)
        if strcmp(species_name(j),elements(k))
            mol_mass=mol_mass+atomic_weight(k);
            save=k;
        end
    end
    n=str2double(species_name(1));
    if n>1
        mol_mass=mol_mass+atomic_weight(k)*(n-1);
    end
    sprintf('molecular weight of %s:%f u',species_name,mol_mass)
end


cd(['E:\skill lync practices\month 1 matlab\week 1\species\',species_name])

saveas(1,'cp vs temp.jpg')
saveas(2,'s vs temp.jpg')
saveas(3,'h vs temp.jpg')

end
fclose(f2)
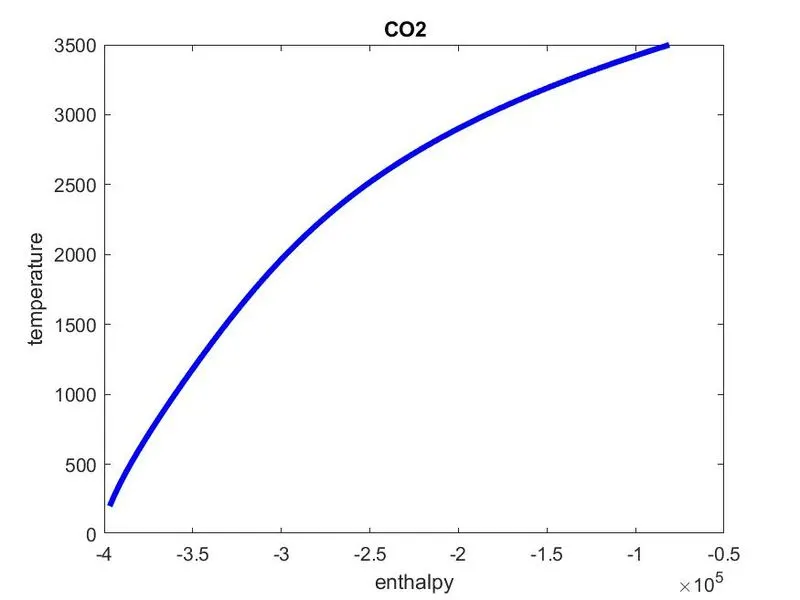
plots of o2, N2, Co2
o2
cp vs temp
entropy vs temp
enthalpy vs temp
N2
specific heat vs temp
entropy vs time
enthalpy vs time
Co2
specific heat vs temp
entropy vs temp
enthalpy vs time
screenshot of molecular weight
errors faced
mostly syntax errors and placement of element wise operators. a few errors during coversion of coefficients into numbers.
references