Project 1 - Parsing NASA thermodynamic data
OBJECTIVE: NASA has came-up with a set of "Polynomials" to evaluate the 'Thermodynamic properties' of various species for 'Specific Heat (Cp)', 'Enthalpy (H)' & 'Entropy (S)', documented in form of 'Co-efficients' and stored as "THERMO.dat" file.
Now with the "File Parsing" operation in 'Matlab', we have to compute a program to :
- Extract all 14 coefficients separately.
- Calculate 'Entropy', 'Enthalpy' & 'Specific Heat' for all given species.
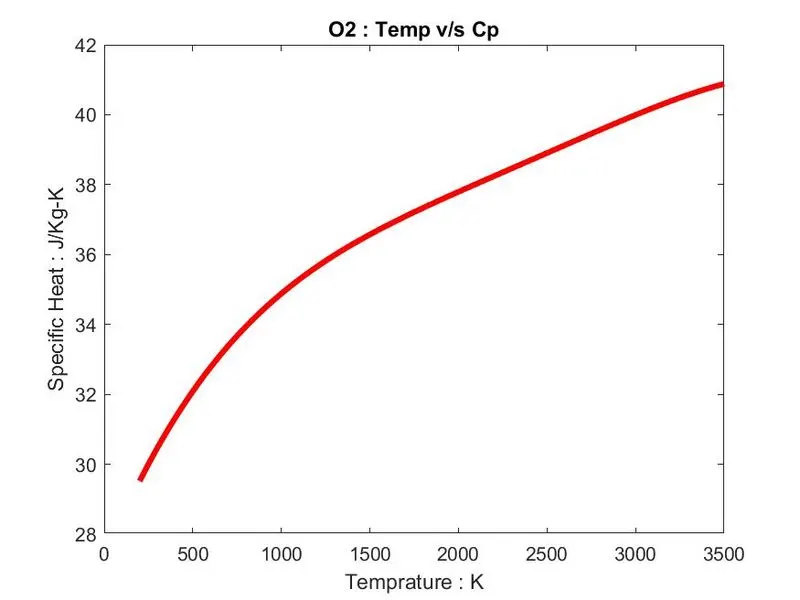
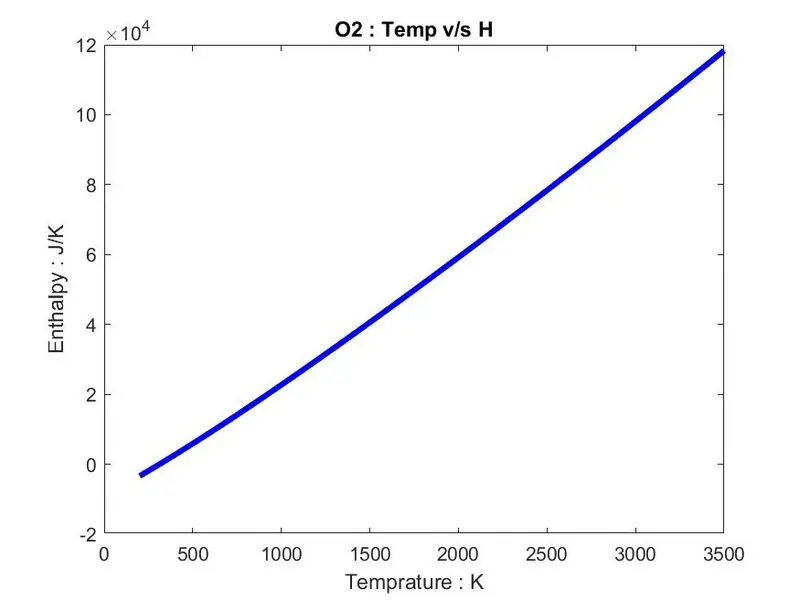
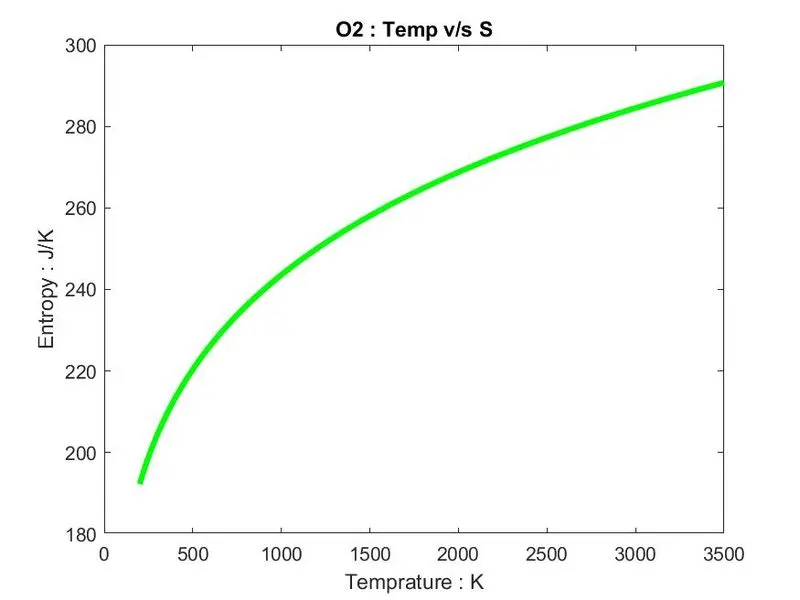
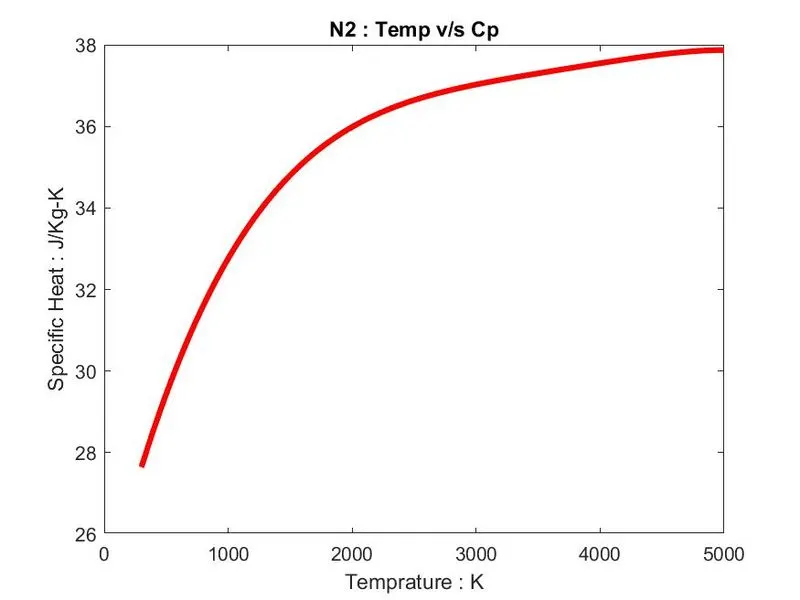
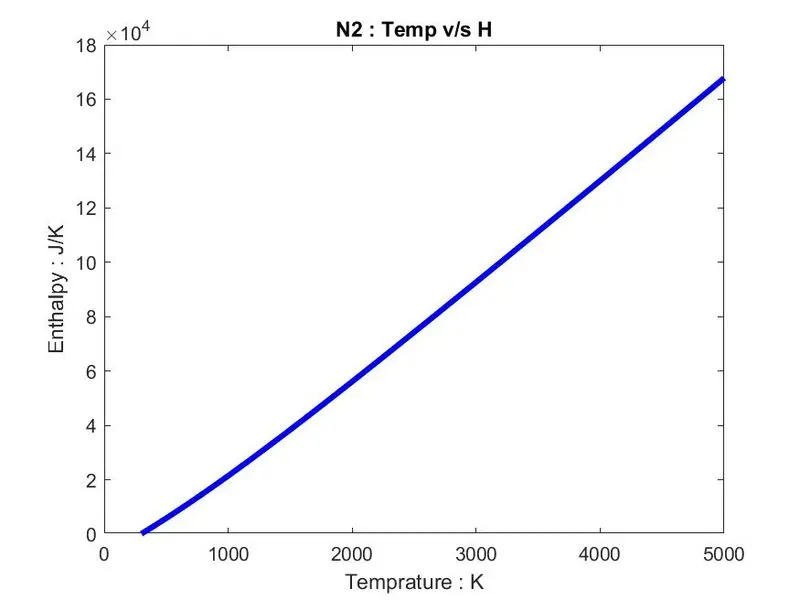
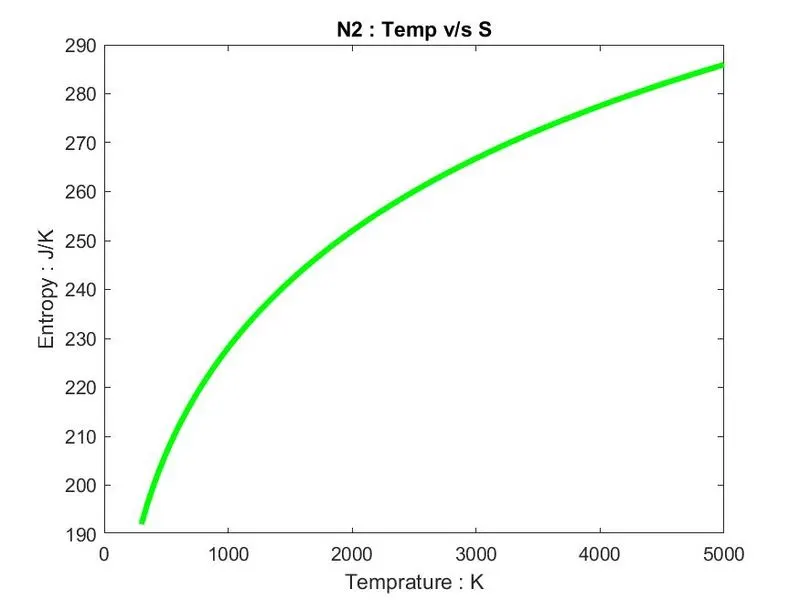
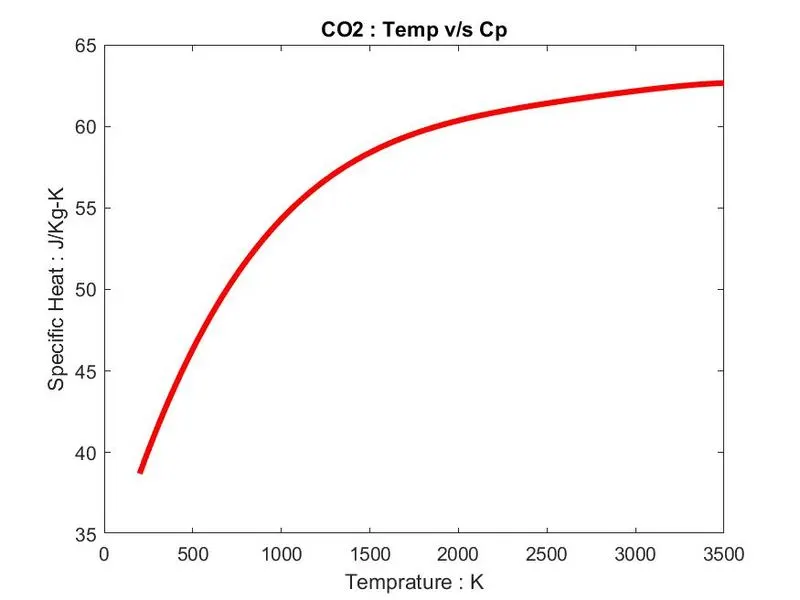
- Plot "Cp vs T", "H vs T", "S vs T" for local temperature(Low temperature : High temperature).
- Save all plots as images with proper "Species_name" and save & dump them in a separate folder.
- Calculate "Molecular_weight" for individual species & display on 'Command Window'.
FILE PARSING: In general, File Parsing means extracting data from any extension type file to a Matlab programming language. Here we extracted a file derived by NASA for information regarding 'Thermodynamic Properties' of various species.
MAIN PROGRAM CODING:
clear all
close all
clc

% NASA THERMO coefficients for different species readable file opens:
f1 = fopen('THERMO.dat','r');           % THERMO.dat file is called upon to get data

% The Title of File Parsing "THERMO"
tline = fgetl(f1);                      % 'tline' command is used to read "THERMO.dat" file line by line.
Title = textscan(tline,'%s');           % 'Title' is saved in form of cell & '%s' is used to read complete line.

% Values for global tempratures
tline = fgetl(f1);                      % Reads a new line from '.dat' file
A = strsplit(tline,' ');                % Splits the set of string as per selection of delimiter(creates seperation wall between strings).
global_low_temp = str2double(A{2});     % Global low temprature
global_mid_temp = str2double(A{3});     % Global high temprature
global_high_temp = str2double(A{4});    % Global division of temprature


for i = 1:3                             % This for loop is created for eliminating or skipping headers.
tline = fgetl(f1);                      % To skip the headers we ran 'fgetl' 3 times in a loop.
end


% Now we make a loop for all the species available in NASA TERMO.dat file....
for j = 6:4:217                         % Here 'for' loop is calling a loop from 6:217 in a set of 4.
tline = fgetl(f1);                      % Reads a new line from '.dat' file
B1 = strsplit(tline,' ');               % Splits the entire array in a small sets of strings with help of 'space delimiter'.
Species_name = B1{1};                   % Defines individual species name in form of Array.
Local_temprature = strfind(tline,'.');  % Find a set of string by help of '. delimiter'.
TL = str2double(tline(52-3:52+3));      % Lower range temprature
TH = str2double(tline(62-4:62+3));      % High range temprature
TM = str2double(tline(72-4:72+3));      % Division between tempratures

% Now we are seperating coefficients from NASA THERMO.dat file :
% Coefficient line 1:
tline = fgetl(f1);                      % Reads a new line from '.dat' file
C = strfind(tline,'E');                 % Find new strings, read in 'tline'...with "E" as delimiter
C01 = str2double(tline(1:12+3));        % Coefficient 1
C02 = str2double(tline(C+4:27+3));      % Coefficient 2
C03 = str2double(tline(C+19:42+3));     % Coefficient 3
C04 = str2double(tline(C+34:57+3));     % Coefficient 4
C05 = str2double(tline(C+49:72+3));     % Coefficient 5

% Coefficient line 2:
tline = fgetl(f1);                      % Reads a new line from '.dat' file
D = strfind(tline,'E');                 % Find new strings, read in 'tline'...with "E" as delimiter
C06 = str2double(tline(1:12+3));        % Coefficient 6
C07 = str2double(tline(D+4:27+3));      % Coefficient 7
C08 = str2double(tline(D+19:42+3));     % Coefficient 8
C09 = str2double(tline(D+34:57+3));     % Coefficient 9
C10 = str2double(tline(D+49:72+3));     % Coefficient 10

% Coefficient line 3:
tline = fgetl(f1);                      % Reads a new line from '.dat' file
F = strfind(tline,'E');                 % Find new strings, read in 'tline'...with "E" as delimiter
C11 = str2double(tline(1:12+3));        % Coefficient 11
C12 = str2double(tline(F+4:27+3));      % Coefficient 12
C13 = str2double(tline(F+19:42+3));     % Coefficient 13
C14 = str2double(tline(F+34:57+3));     % Coefficient 14

% Calculation to find Enthalpy, Entropy, Specific heat :
T = linspace(TL,TH,100);                % Set of temprature (Kelvin, k)
R = 8.314;                              % Universal gas constant (Kg*m^2*s^-2*k^-1*mol^-1)

% Calling a function "enthalpy_entropy_specificheat_function.m".....
[H,S,Cp] = enthalpy_entropy_specificheat_function(T,R,TM,C01,C02,C03,C04,C05,C06,C07,C08,C09,C10,C11,C12,C13,C14);

figure (1)                              % Plot between Temp & Specific Heat
plot(T,Cp,'linewidth',3,'color','r')
xlabel('Temprature : K')
ylabel('Specific Heat : KJ/mol-k')
title([Species_name,' : ','Temp v/s Cp'])

figure (2)                              % Plot between Temp & Enthalpy
plot(T,H,'linewidth',3,'color','b')
xlabel('Temprature : K')
ylabel('Enthalpy : KJ')
title([Species_name,' : ','Temp v/s H'])

figure (3)                              % Plot between Temp & Entropy
plot(T,S,'linewidth',3,'color','g')
xlabel('Temprature : K')
ylabel('Entropy : KJ/K')
title([Species_name,' : ','Temp v/s S'])

% Now creating a set of commands to save individual species plot :
oldfolder = cd('C:\Ashish\Matlab\File Parsing'); % Changes the directory to save this file.
% All individual plots are saved by 'saveas' command :
% 'fullfile' used to allot a name to folders.
% 'sprintf' converts any sort of data to string or vector form & here is used to allot a name to individual plots saved in folders.
saveas(figure (1), fullfile([Species_name '_Plots'],sprintf([Species_name '_Temp_vs_Cp.jpg'])));
saveas(figure (2), fullfile([Species_name '_Plots'],sprintf([Species_name '_Temp_vs_H.jpg'])));
saveas(figure (3), fullfile([Species_name '_Plots'],sprintf([Species_name '_Temp_vs_S.jpg'])));
end

fclose(f1);     % closes the file, opened to retract data from...
STEP-BY-STEP EXPLANATION OF THE MAIN PROGRAM:
- "THERMO.dat" data file is opened by the command 'fopen'.
- 'fgetl' command is used to read an individual line at once, saves in form of 'strings' & prints in the command window as "tline". "tline" is a 'temporary line' phrasing used in the entire program to avoid too many elements in the workspace. 'Title' of the program is given as "THERMO" in cell form and saved as "%s" to a read-only character vector.
- To find the global temperatures, we read a line by 'fgetl' and split it by using the "strsplit" command with 'space delimiter'. Now to read individual temperatures, the "str2double" command is used to get a 'double-precision string' and provide proper allocation.

- As the next three lines are not required for collecting any type of data so to eliminate them, we create a 'for' loop for those three lines and eliminate them.

- Now next line is read and as it contains important data for future calculation, so first we split a line by 'space delimiter' and evaluate "Species_name" as a character string. Secondly, to get local temperature values we use the 'strfind' command with '.' as a delimiter to find an appropriate location and creates a program for 'low', 'medium' & 'high' local temperatures.

- The way we have found the values for 'local temperature', now we evaluate in the same manner for finding values of '14 Coefficients'. We first find the common thing between all coefficients which is 'E' and creates a program to read each value appropriately. We follow this procedure for three lines individually.

- NOTE: The above coefficients are in a total of 14 elements out of which the first 7 are "high order temperature" range and the rest 7 are "low order temperature" range.
- "Line 5 & 6" are in a 'for' loop to repeat the process for each set-of-4 for given species.

- In the same loop, we create a function to calculate values for "Cp, H, S" for both 'Low & High Local Temperature.
- After that, a plot is created for "Cp vs T", "H vs T" & "S vs T" and to save them in a separate folder we change the directory for saving this program by "oldFolder = cd(newFolder)".
- Now time to save plots with proper 'Species' name as file-name and 'Species' name along with 'Plot type' as plot-name.
- As the main program coding is finished, it's time to close the "THERMO.dat" file which is done by the 'fclose' command.
POLYNOMIAL FUNCTION:
function [H,S,Cp] = enthalpy_entropy_specificheat_function(T,R,TM,C01,C02,C03,C04,C05,C06,C07,C08,C09,C10,C11,C12,C13,C14)

for i = length(T)
    if T(i)<=TM
        H = (C08 +C09.*(T./2) + C10.*((T.^2)./3) + C11.*((T.^3)./4) + C12.*((T.^4)./5) + C13./T).*T.*R ;
        S = (C08.*log(T) + C09.*T + C10.*((T.^2)./2) + C11.*((T.^3)./3) + C12.*((T.^4)./4) + C14).*R ;
        Cp = (C08 + C09.*T + C10.*(T.^2) + C11.*(T.^3) +C12.*(T.^4)).*R ;
    else
        H = (C01 +C02.*(T./2) + C03.*((T.^2)./3) + C04.*((T.^3)./4) + C05.*((T.^4)./5) + C06./T).*T.*R ;
        S = (C01.*log(T) + C02.*T + C03.*((T.^2)./2) + C04.*((T.^3)./3) + C05.*((T.^4)./4) + C07).*R ;
        Cp = (C01 + C02.*T + C03.*(T.^2) + C04.*(T.^3) +C05.*(T.^4)).*R ;
    end
end
This is the Polynomial for calculating 'Thermodynamic properties'. 
The logic used to create this polynomials function is in "if-else" form with a 'for' loop for a fixed value of TH (1000). We used 'if' - "T(i) is less than TH, then, lower temperature coefficients will be calculated, 'else' - the higher temperature coefficients will be calculated.
MOLECULAR WEIGHT PROGRAM:
clear all
close all
clc

% NASA THERMO coefficients for different species readable file opens:
f1 = fopen('THERMO.dat','r');                      % THERMO.dat file is called upon to get data

for i = 1:5                                        % This for loop is created for eliminating or skipping headers.
tline = fgetl(f1);                                 % To skip the headers we ran 'fgetl' 3 times in a loop.
end

for j = 6:4:217                                    % Here 'for' loop is calling a loop from 6:217 in a set of 4.
tline = fgetl(f1);                                 % Reads a new line from '.dat' file
B1 = strsplit(tline,' ');                          % Splits the entire array in a small sets of strings with help of 'space delimiter'.
Species_name = B1{1};                              % Defines individual species name in form of Array.

    for k = 7:9                                    % This for loop is created for eliminating or skipping headers.
        tline = fgetl(f1);                         % To skip the headers we ran 'fgetl' 3 times in a loop.
        x = textscan(tline,'%*s');
    end

% % Calculation of molecular weight for different species :
Elements = ['H','C','N','O','AR','(S)'];          % Elements present in THERMO.dat file .
Atomic_mass = [1  12  14  16  40 0 0 0 0];        % Atomic weight of each elements of Species.
Molecular_weight = zeros;                         % As 'Molecular_weight' value changes in each loop, so it need a pre-fixed value to restart...

for l = 1:length(Species_name)                              % Creates a dimensional value for 'Species_name'
    [a,b] = str2num(Species_name(l));                       % "str2num" converts 'chr' to 'num'...to be used as logic..
% a = numerical super-script
% b = numerical sub-scrpit + a
    if b == 0                                               % initial condition...when no sub-script is present..
        z = find(Elements == Species_name(l));              % find values for non-zero elements
        Molecular_weight(l) = Atomic_mass(z);               % logic 1 : to find molecular weight for b equals to zero.
    else
        Molecular_weight(l-1) = a*Molecular_weight(l-1);    % logic 2 : to find molecular weight for b not equals to zero.
    end
end
Total_Molecular_weight = sum(Molecular_weight);             % logic 3: add both logic 1 & 2 for combined required output.

% Print the values of individual species for Molecular_weight :
fprintf('Molecular weight of %s : %d\n',Species_name,Total_Molecular_weight)
% "fprintf" is used to display statements.
end

fclose(f1);
The program created to calculate Molecular weight is very easy logically. First, we opened the file 'THERMO.dat' and extracted only the species name rest of all other content is eliminated. The logic used here is that we define 'Elements' and their 'Atomic masses' as separate constituents. Then taking 'Species_name' as a base we create a 'for' loop with if-else conditions to make it look like an independent function. With help of 'str2num' - 'Species_name' is converted into a looping string value. After that, at the initial position 'Elements' & 'Species_name' are equated to each other in terms of for-loop with 'find' command. As we move forward to the if-else condition, a required relation is created b/w 'Molecular_weight' & 'Atomic_mass'. At last, they are printed to the command window by using the 'fprintf' command.
COMMAND WINDOW FOR MOLECULAR WEIGHT:
Molecular weight of O : 16
Molecular weight of O2 : 32
Molecular weight of H : 1
Molecular weight of H2 : 2
Molecular weight of OH : 17
Molecular weight of H2O : 18
Molecular weight of HO2 : 33
Molecular weight of H2O2 : 34
Molecular weight of C : 12
Molecular weight of CH : 13
Molecular weight of CH2 : 14
Molecular weight of CH2(S) : 14
Molecular weight of CH3 : 15
Molecular weight of CH4 : 16
Molecular weight of CO : 28
Molecular weight of CO2 : 44
Molecular weight of HCO : 29
Molecular weight of CH2O : 30
Molecular weight of CH2OH : 31
Molecular weight of CH3O : 31
Molecular weight of CH3OH : 32
Molecular weight of C2H : 25
Molecular weight of C2H2 : 26
Molecular weight of C2H3 : 27
Molecular weight of C2H4 : 28
Molecular weight of C2H5 : 29
Molecular weight of C2H6 : 30
Molecular weight of CH2CO : 42
Molecular weight of HCCO : 41
Molecular weight of HCCOH : 42
Molecular weight of H2CN : 28
Molecular weight of HCN : 27
Molecular weight of HNO : 31
Molecular weight of N : 14
Molecular weight of NNH : 29
Molecular weight of N2O : 44
Molecular weight of NH : 15
Molecular weight of NH2 : 16
Molecular weight of NH3 : 17
Molecular weight of NO : 30
Molecular weight of NO2 : 46
Molecular weight of HCNO : 43
Molecular weight of HOCN : 43
Molecular weight of HNCO : 43
Molecular weight of NCO : 42
Molecular weight of CN : 26
Molecular weight of HCNN : 41
Molecular weight of N2 : 28
Molecular weight of AR : 40
Molecular weight of C3H8 : 44
Molecular weight of C3H7 : 43
Molecular weight of CH3CHO : 44
Molecular weight of CH2CHO : 43
All species 'Molecular weight' is displayed here.
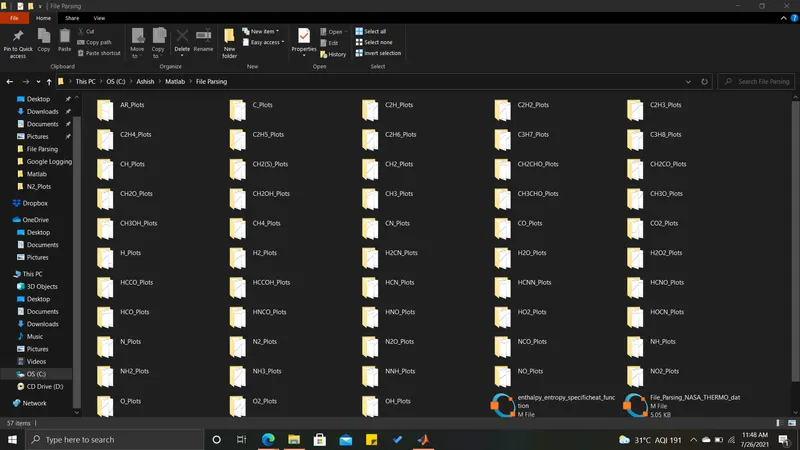
SCREENSHOT: The upper shown pic is the attachment to show where all individually saved folders for different species plots are.
PLOTS FOR CO2, O2, N2:
O2:-
N2:-
CO2:-
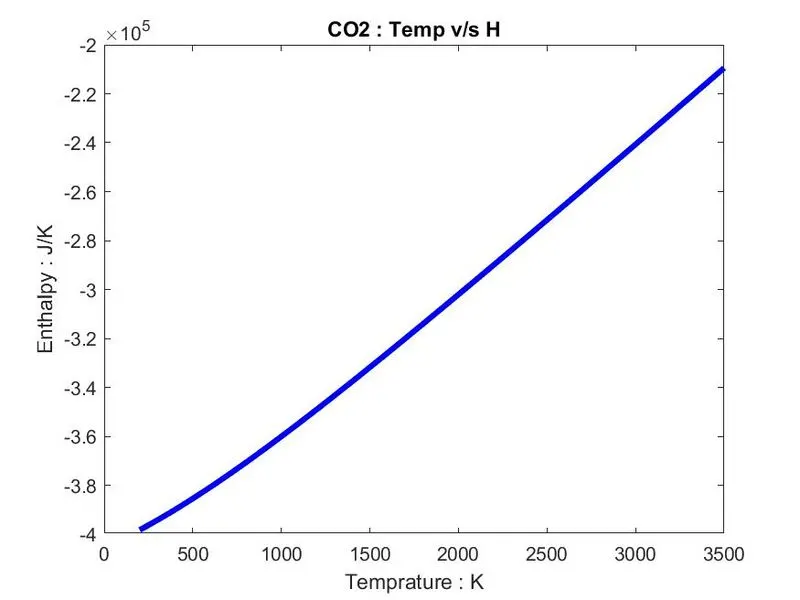
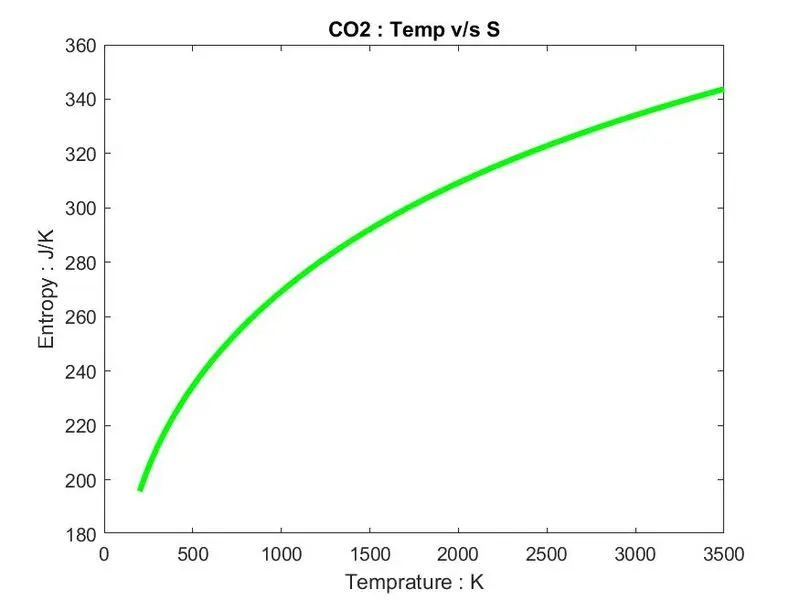
ERRORS FACED WHILE PROGRAMMING:
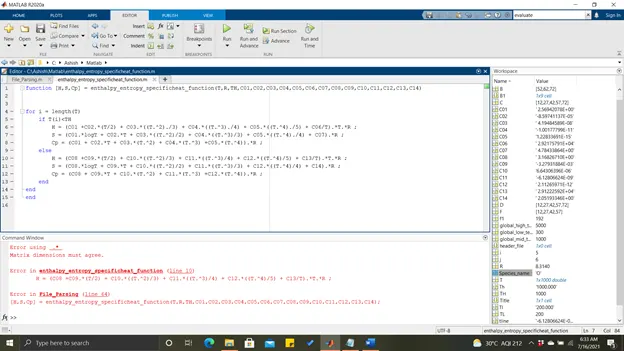 This is the main program error that occurred because of 'operators' not being placed in the proper position. " Operators are placed correctly to avoid such phrases error. "
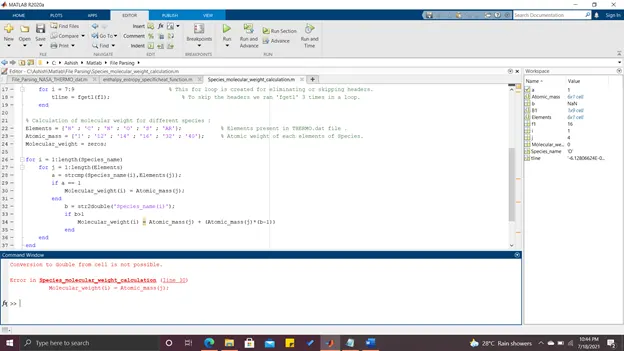 This is a 'Molecular weight' program in which the error is of creating the program with proper logic.
REFERENCES: