Project 1 - Parsing NASA thermodynamic data
AIM : To write a code in MATLAB to parse a NASA thermodynamic file and then calculate thermodynamic properties of various gas species.
THEORY :
Polynomials for calculation of cp, h, s values
here R is universal gas constant, T is temperature

Specific heat :
The Specific heat is the amount of heat per unit mass required to rise the temperature by one degree celcius. The relationship between heat and temperature change is usually expressed in the form shown below where, Cp is specific heat.
Cp = R*(a1+(a2*T)+(a3*(T).^2)+(a4*(T).^3)+(a5*(T).^4))
Entropy :
Entropy is the measure of systems thermal energy per unit temperture that is unavailable for doing useful work. Because work is obtained from ordered molecular motion, the amount of entropy is also a measure of molecular disorder or randomness of a system.
S = R*(a1.*log(T)+(a2*T)+((a3*(T).^2)/2)+((a4*(T).^3)/3)+(a5*(T).^4)/4)+a7)
Enthalpy :
Enthalpy is the sum of systems internal energy and the product of its pressure and volume. In a system contained so as to prevent mass transfer, for processes at constant pressure, the heat absorbed or released equals to Enthalpy.
H = R*T.*(a1+((a2*T)/2))+((a3*(T).^2)/3)+((a4*(T).^3)/4)+((a5*(T).^4)/5)+((a6./T)))
MATLAB code :
1. Main code
clear all
close all
clc

f1 = fopen('THERMO.dat','r')
heading = fgetl(f1);
temp = fgetl(f1);
global_temp = strsplit(temp,' ');
glowtemp = str2num(global_temp{2});
gmidtemp = str2num(global_temp{3});
ghightemp = str2num(global_temp{4});

for i=1:3
    fgetl(f1);
end
for i=1:53
    a = fgetl(f1);
    [species,remain] = strtok(a);
    localtemp = strfind(remain,'.');
    low_temp = str2double(remain(localtemp(1)-4:localtemp(1)+3));
    high_temp = str2double(remain(localtemp(2)-4:localtemp(2)+3));
    mid_temp = str2double(remain(localtemp(3)-4:localtemp(3)+3));

    %species_name = strtok(a)
    l1 = fgetl(f1);
    l2 = fgetl(f1);
    l3 = fgetl(f1);
    pos1 = strfind(l1,'E');
    pos2 = strfind(l2,'E');
    pos3 = strfind(l3,'E');

    a1 = str2double(l1(1:pos1(1)+3));
    a2 = str2double(l1(pos1(1)+4:pos1(2)+3));
    a3 = str2double(l1(pos1(2)+4:pos1(3)+3));
    a4 = str2double(l1(pos1(3)+4:pos1(4)+3));
    a5 = str2double(l1(pos1(4)+4:pos1(5)+3));
    a6 = str2double(l2(1:pos2(1)+3));
    a7 = str2double(l2(pos2(1)+4:pos2(2)+3));
    a8 = str2double(l2(pos2(2)+4:pos2(3)+3));
    a9 = str2double(l2(pos2(3)+4:pos2(4)+3));
    a10 = str2double(l2(pos2(4)+4:pos2(5)+3));
    a11 = str2double(l3(1:pos3(1)+3));
    a12= str2double(l3(pos3(1)+4:pos3(2)+3));
    a13 = str2double(l3(pos3(2)+4:pos3(3)+3));
    a14= str2double(l3(pos3(3)+4:pos3(4)+3));


    Mass = M_M(species);
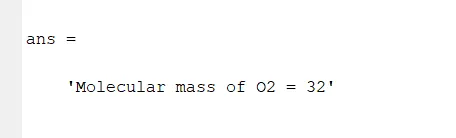
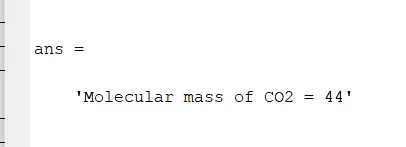
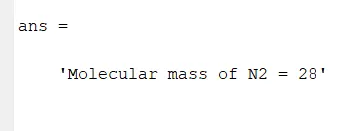
    sprintf('Molecular mass of %s = %d',species,Mass)
    R = 8.314;
    T = low_temp:high_temp;

    if(T>mid_temp)
        Cp = R*(a1+(a2*T) + (a3*(T.^2)) + (a4*(T.^3)) + (a5*(T.^4)));

        H = R*(a1*T + a2*(T.^2)/2 + (a3*(T.^3)/3) + (a4*(T.^4)/4) + (a5*(T.^5)/5)+a6);

        S = R*(a1*log(T) + (a2*T) + (a3*(T.^2)/2) + (a4*(T.^3)/3) + (a5*(T.^4)/4) + a7);

    else

        Cp = R*(a8+(a9*T) + (a10*(T.^2)) + (a11*(T.^3)) + (a12*(T.^4)));

        H = R*(a8*T + a9*(T.^2)/2 + (a10*(T.^3)/3) + (a11*(T.^4)/4) + (a12*(T.^5)/5) + a13);

        S = R*(a8*log(T) + (a9*T) + (a10*(T.^2)/2) + (a11*(T.^3)/3) + (a12*(T.^4)/4) + a14);

    end

    name = sprintf('%s',species);
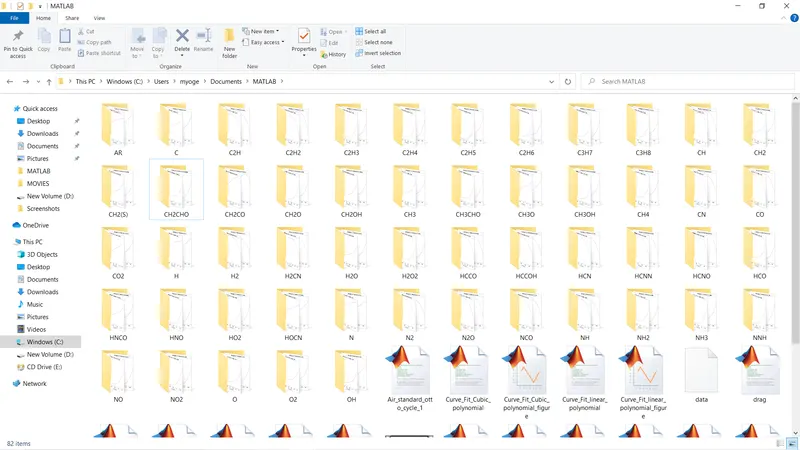
    mkdir(name);
    cd(name);

    %plotting
    figure(1)
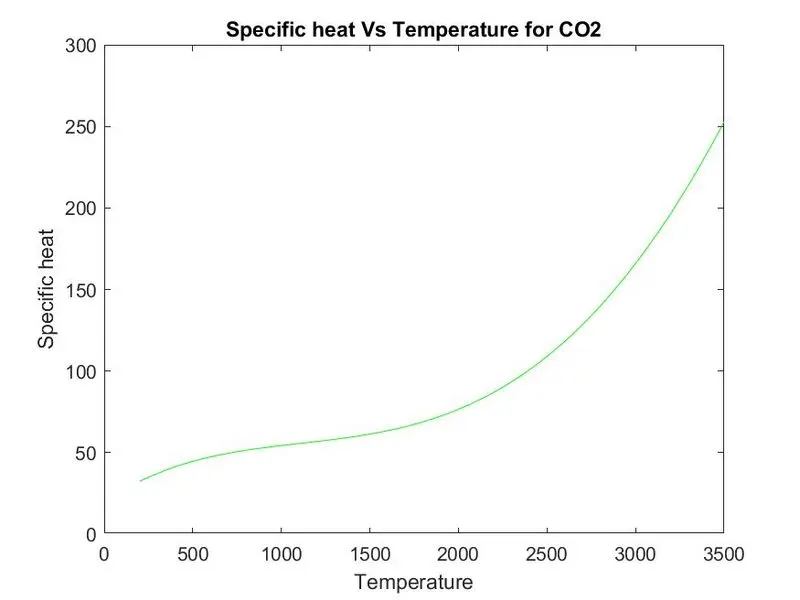
    plot(T,Cp,'g');
    xlabel('Temperature');
    ylabel('Specific heat');
    title(sprintf('Specific heat Vs Temperature for %s',species));

    figure(2)
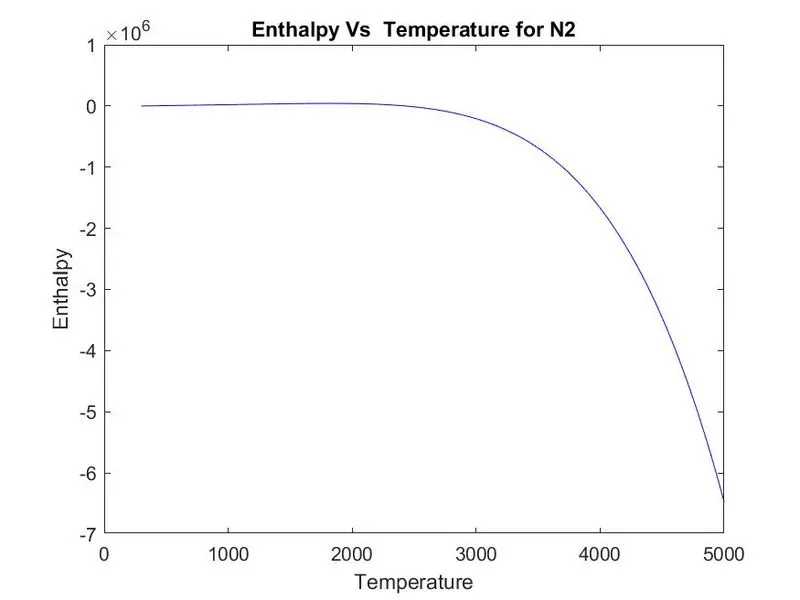
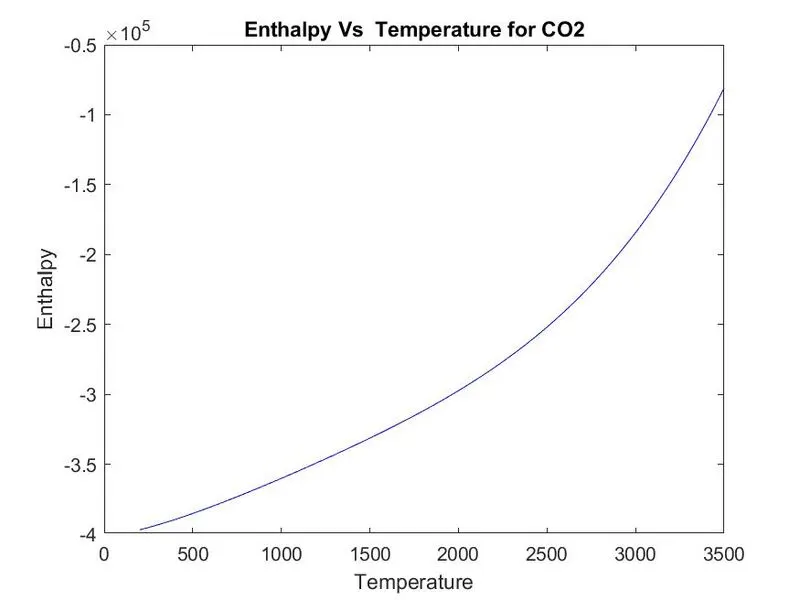
    plot(T,H,'b');
    xlabel('Temperature');
    ylabel('Enthalpy');
    title(sprintf('Enthalpy Vs  Temperature for %s',species));

    figure(3)
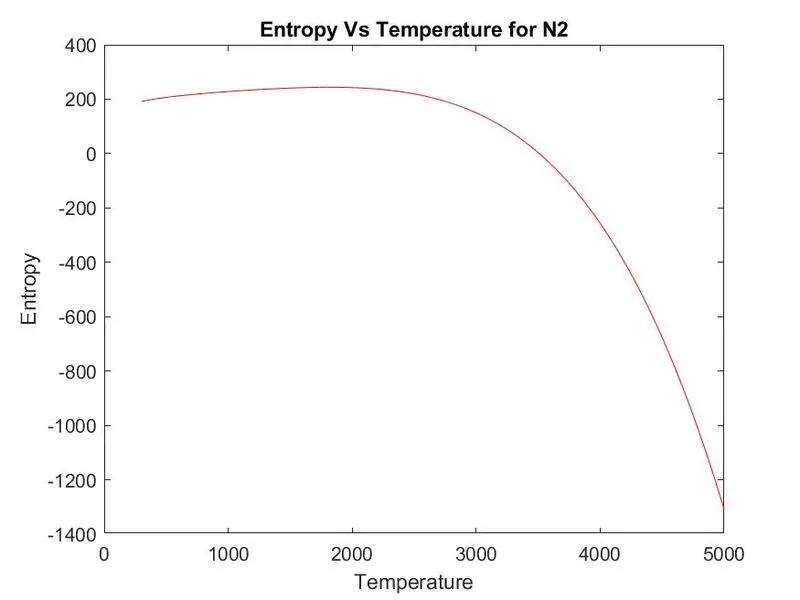
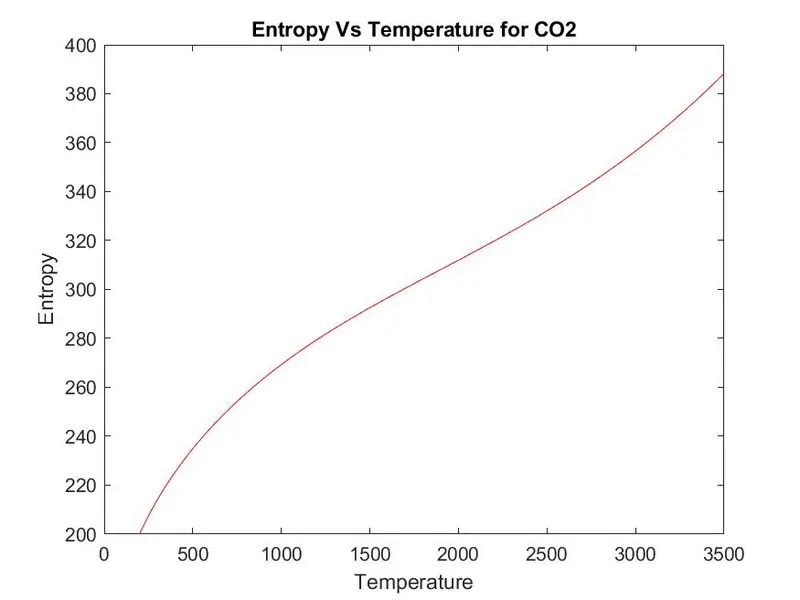
    plot(T,S,'r');
    xlabel('Temperature');
    ylabel('Entropy');
    title(sprintf('Entropy Vs Temperature for %s',species));

    saveas(1,'specific heat.jpg')
    saveas(2,'enthalpy.jpg')
    saveas(3,'entropy.jpg')

    cd...;

end
2. Function to calculate molecular mass
function[molmass] = M_M(species)
elements = ['H','C','N','O','R'];
AW = [1 12 14 16 40];
molmass = 0;

for i=1:length(species)
    for j=1:length(elements)
        if strcmpi(species(i),elements(j))
            molmass = molmass + AW(j);
            position = j;
        end
    end

    n = str2double(species(i));
    if n>1
        molmass = molmass + (AW(position))*(n-1);
    end
end
end
Exlpanition of code:
- First I opened the "THERMO.dat" data file using 'fopen' command.
- The command 'fgetl' is used to access lines in the file. This command can also be used to skip the unnecessary lines and to read the required information in the loop.
- The required information like global and local temperature can be accessed through 'strsplit' or 'strfind' command by including suitable delimiters like '.' and ' ' in the command.
- The global and local temperatures are extracted. But in this program only local temperatures are used for calculations.
- The string data is converted to numbers using 'str2num' or 'str2double' commands.
- Using 'for' loop, the coefficients of polynomials can be extracted.
- The Cp,H,S values for each species are found out by using polynamials for the range of temperatures.
- The function is created to calculate molecular mass of the species. The 'strcmpi' command is used to compare the strings.
- Graphs are plotted and images are saved in jpg files using 'saveas' command. Directory is created using 'mkdir' and 'cd' commands. 'mkdir' is used to change the directory and 'cd' is used to up the folder by one.
OUTPUT :
Molecular weights :-
Graphs :-
1. O2
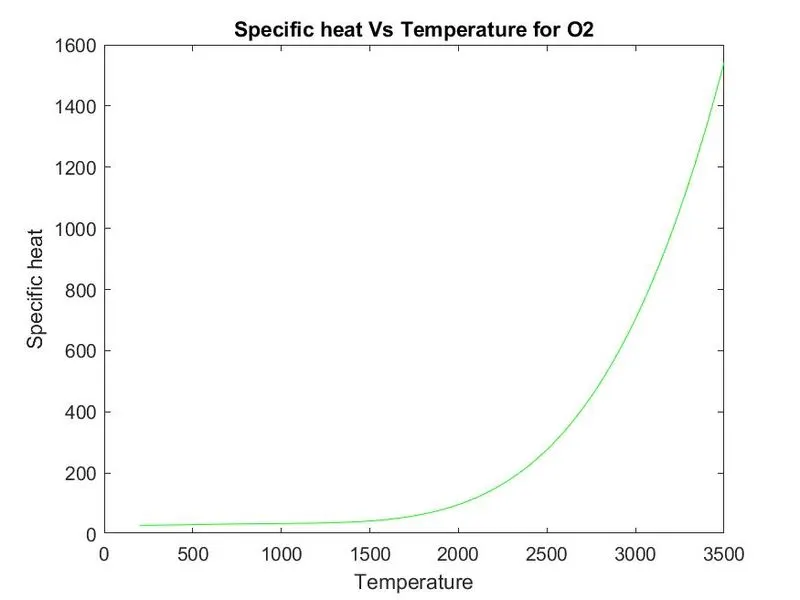
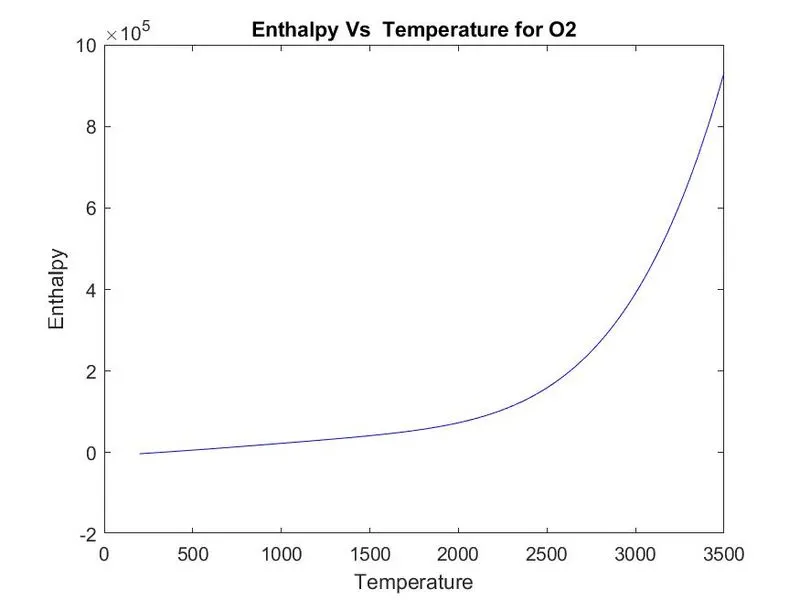
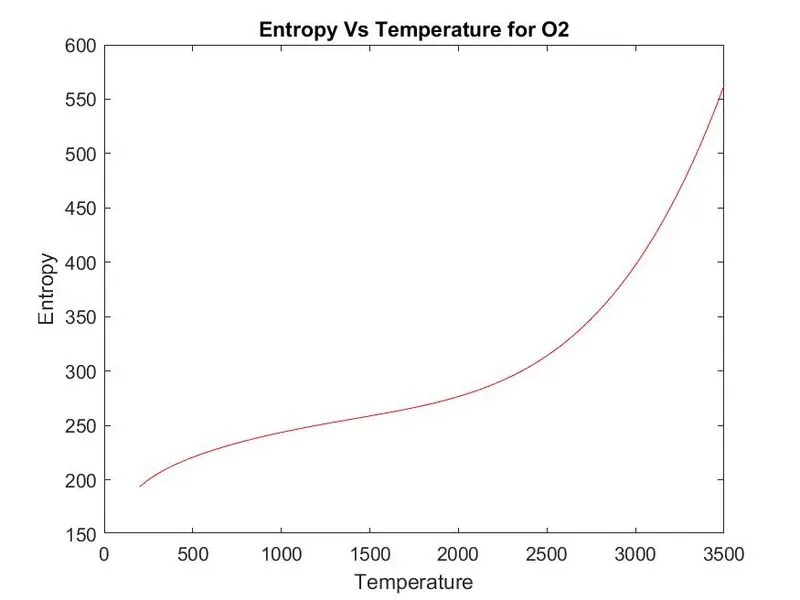
2. N2
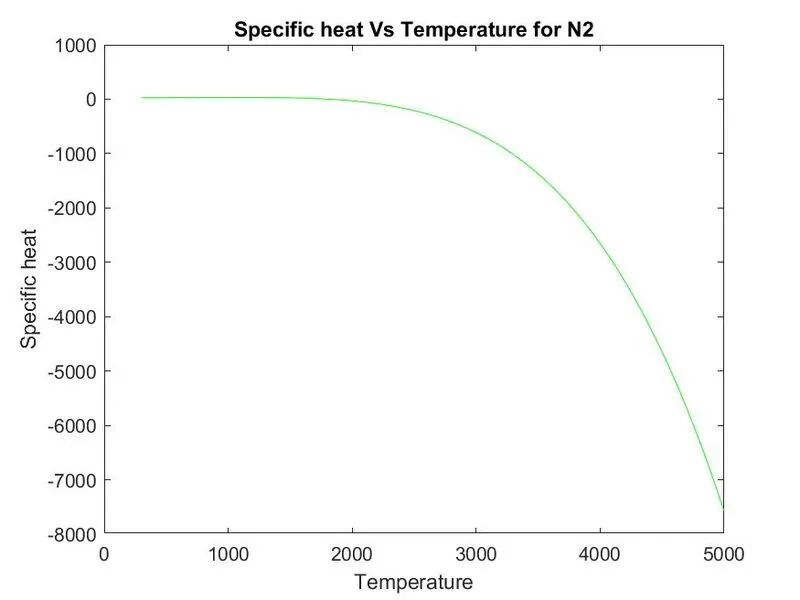
3. CO2
CONCLUSION :
The molecular weights are camculated and grapls are plotted.