Project 1 - Parsing NASA thermodynamic data
Ans:
File Parsing : It is done to extract data from the file, it should be as generic as possible to fetch the data from different files.
1. Write a function that extracts the 14 coefficients and calculate the enthalpy, entropy and specific heats for all the species in the data file.
Given Formulae:

where, R= Universal gas constant
T= Temperature
Cp= Specific Heat, H= Enthaly, S= Entropy
High Temperature coefficients: a1,a2,a3,a4,a5,a6,a7
Low Temperature coefficients: a8,a9,a10,a11,a12,a13,a14
- Here, the Local Temperature range is considered which is unique for each individual species.
Local Low Temperature=300
Local Mid Temperture= 1000
Local High Temperature= 5000
- Function to calculate the Specific Heat : (specific_heat.m)
function [Cp]=specific_heat(a1,a2,a3,a4,a5,a6,a7,a8,a9,a10,a11,a12,a13,a14,local_low_temp,local_mid_temp,local_high_temp,t,R)
if (t>local_mid_temp)
    Cp=R*(a1+(a2.*t)+(a3.*(t.^2))+(a4.*(t.^3))+(a5.*(t.^4)));
else
     Cp=R*(a8+(a9.*t)+(a10.*(t.^2))+(a11.*(t.^3))+(a12.*(t.^4)));
end
- Function to calculate the Enthalpy : (enthalpy.m)
function [H]=enthalpy(a1,a2,a3,a4,a5,a6,a7,a8,a9,a10,a11,a12,a13,a14,local_low_temp,local_mid_temp,local_high_temp,t,R)
if (t>local_mid_temp)
    H=(a1+((a2.*t)/2)+((a3.*(t.^2))/3)+((a4.*(t.^3))/4)+((a5.*(t.^4))/5)+(a6./t)).*t*R;
else
    H=(a8+((a9.*t)/2)+((a10.*(t.^2))/3)+((a11.*(t.^3))/4)+((a12.*(t.^4))/5)+(a13./t)).*t*R;
end
- Function to calculate the Entropy : (entropy.m)
function [S]=entropy(a1,a2,a3,a4,a5,a6,a7,a8,a9,a10,a11,a12,a13,a14,local_low_temp,local_mid_temp,local_high_temp,t,R)
if (t>local_mid_temp)
   S=((a1.*logt)+(a2.*t)+((a3.*(t.^2))/2)+((a4.*(t.^3))/3)+(a5.*(t.^4))+a7);
else
   S=((a8.*logt)+(a9.*t)+((a10.*(t.^2))/2)+((a11.*(t.^3))/3)+(a12.*(t.^4))+a14);
end- Function to calculate the Molecular Weight: (molecular_weight.m)
function [MW]=molecular_weight(species_name)

atomic_mass=[15.999,1.008,12.011,14.007,39.948];
elements=['O','H','C','N','A'];
m_wt=0;

for i=1:length(species_name)
    for j=1:length(elements)
        if strcmpi(species_name(i),elements(j))
            m_wt=m_wt+atomic_mass(j);
            k=j;
        end
    end
    t=str2double(species_name(i));
    if(t>1)
        m_wt=m_wt+(atomic_mass(k)*(t-1));
    end
    MW=m_wt;
end
- Main Program for NASA Thermodynamic file parsing : (file_parsing.m)
The main program just takes the "THERMO.dat" file as an input and generates Cp,H & S plots.
clear all
close all
clc

%Main Program for NASA Thermodynamic File Parsing
%opening the THERMO.dat file in read mode
f1=fopen('THERMO.dat','r');

%reading the header information from thermo.dat file using fget command
%which reads the file line by line
fgetl(f1);

%Storing the Global Temperature value in gt
gt=fgetl(f1);

%to ignore the comment block consisiting of 3 lines
fgetl(f1);
fgetl(f1);
fgetl(f1);

%reading the species block
for i=1:53
    tline=fgetl(f1);
    s=strsplit(tline,' '); %split the line when space character encounters
    species_name=s{1}; %monoatomic oxygen
    A=strfind(tline,'G'); %to find the character G in the line
    temp_value=tline(A+4:length(tline));
    local_temp_value=strsplit(temp_value,' '); %splits the string into three parts of local temperature range values
    local_low_temp=str2double(local_temp_value{1}); %stores the local low temperature
    local_high_temp=str2double(local_temp_value{2}); %stores the local high temperature
    local_mid_temp=str2double(local_temp_value{3}); %stores the local mid temperature

    line1=fgetl(f1); %reads the next line in species block
    %to find the 1st coefficient a1
    a=findstr(line1,'E'); %finds the character 'E' in the string
    a1=line1(1:a(1)+3); %1st coefficient value in string type
    a1=str2num(a1); %storing the 1st coefficient value in integer type

    %to find the 2nd coefficient a2
    a2=line1(a(1)+4:a(2)+3); %2nd coefficient value in string type
    a2=str2num(a2); %storing the 2nd coefficient value in integer type

    %to find the 3rd coefficient a3
    a3=line1(a(2)+4:a(3)+3); %3rd coefficient value in string type
    a3=str2num(a3); %storing the 3rd coefficient value in integer type

    %to find the 4th coefficient a4
    a4=line1(a(3)+4:a(4)+3); %4th coefficient value in string type
    a4=str2num(a4); %storing the 4th coefficient value in integer type

    %to find the 5th coefficient a5
    a5=line1(a(4)+4:a(5)+3); %5th coefficient value in string type
    a5=str2num(a5); %storing the 5th coefficient value in integer type

   line2=fgetl(f1); %reads the next line in species block
    %to find the 6th coefficient a6
    a6=line2(1:a(1)+3); %6th coefficient value in string type
    a6=str2num(a6); %storing the 6th coefficient value in integer type

    %to find the 7th coefficient a7
    a7=line2(a(1)+4:a(2)+3); %7th coefficient value in string type
    a7=str2num(a7); %storing the 7th coefficient value in integer type

    %to find the 8th coefficient a8
    a8=line2(a(2)+4:a(3)+3); %8th coefficient value in string type
    a8=str2num(a8); %storing the 8th coefficient value in integer type

    %to find the 9th coefficient a9
    a9=line2(a(3)+4:a(4)+3); %9th coefficient value in string type
    a9=str2num(a9); %storing the 9th coefficient value in integer type

    %to find the 10th coefficient a10
    a10=line2(a(4)+4:a(5)+3); %10th coefficient value in string type
    a10=str2num(a10); %storing the 10th coefficient value in integer type

  line3=fgetl(f1); %reads the next line in species block
    %to find the 11th coefficient a11
    a11=line3(1:a(1)+3); %11th coefficient value in string type
    a11=str2num(a11); %storing the 11th coefficient value in integer type

    %to find the 12th coefficient a12
    a12=line3(a(1)+4:a(2)+3); %12th coefficient value in string type
    a12=str2num(a12); %storing the 12th coefficient value in integer type

    %to find the 13th coefficient a13
    a13=line3(a(2)+4:a(3)+3); %13th coefficient value in string type
    a13=str2num(a13); %storing the 13th coefficient value in integer type

    %to find the 14th coefficient a14
    a14=line3(a(3)+4:a(4)+3); %14th coefficient value in string type
    a14=str2num(a14); %storing the 14th coefficient value in integer type


    %Local Temperature Range
    t=linspace(local_low_temp,local_high_temp,100);

    %R is universal gas constant
    R=8.314;

    %Calculate the value of the specific heat
    %call the function specific_heat.m
    Cp=specific_heat(a1,a2,a3,a4,a5,a6,a7,a8,a9,a10,a11,a12,a13,a14,local_low_temp,local_mid_temp,local_high_temp,t,R);

    %Calculate the value of the enthalpy
    %call the function enthalpy.m
    H=specific_heat(a1,a2,a3,a4,a5,a6,a7,a8,a9,a10,a11,a12,a13,a14,local_low_temp,local_mid_temp,local_high_temp,t,R);

    %Calculate the value of the entropy
    %call the function entropy.m
    S=specific_heat(a1,a2,a3,a4,a5,a6,a7,a8,a9,a10,a11,a12,a13,a14,local_low_temp,local_mid_temp,local_high_temp,t,R);


    %Create separate folder for species
 mkdir(['D:',species_name])
  cd(species_name)

    %Plot for temperature vs specific heat
    figure(1)
    plot(t,Cp)
    xlabel('Temperature');
    ylabel('Specific Heat');
    title('Plot for Temperature vs Specific Heat');
    image=getframe(gcf);
    imwrite(image.cdata,'T vs Cp.png')
    saveas(1,'Specific Heat','jpg')


    %Plot for temperature vs Enthalpy
    figure(2)
    plot(t,H)
    xlabel('Temperature');
    ylabel('Enthalpy');
    title('Plot for Temperature vs Enthalpy');
    image=getframe(gcf);
    imwrite(image.cdata,'T vs H.png')
    saveas(2,'Enthalpy','jpg')


    %Plot for temperature vs Entropy
    figure(3)
    plot(t,S)
    xlabel('Temperature');
    ylabel('Entropy');
    title('Plot for Temperature vs Entropy');
    image=getframe(gcf);
    imwrite(image.cdata,'T vs S.png')
    saveas(3,'Entropy','jpg')

    cd ..
    %call the function moleculat_Weight.m
    %calculate the molecular mass
    [MW]=molecular_weight(species_name);
    E=sprintf('%s Molecular Weight=%f',species_name,MW);
    disp(E)
end
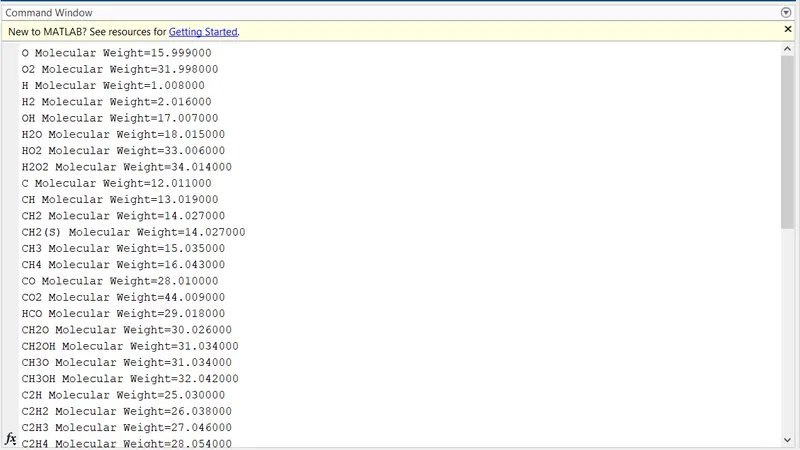
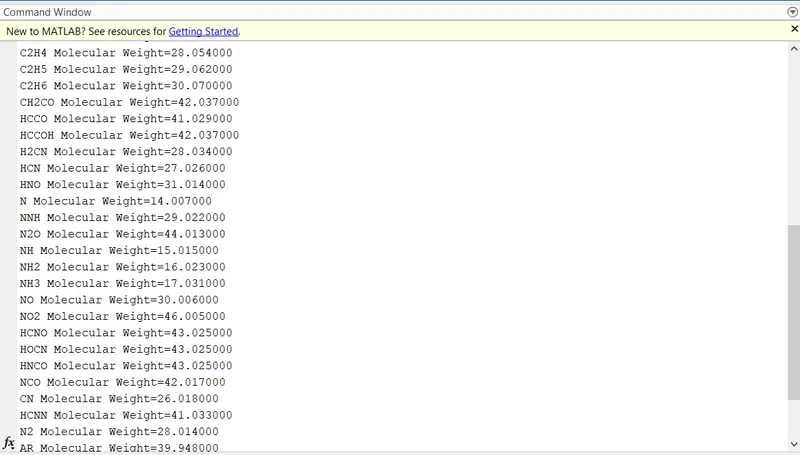
2. Calculation of the molecular weight of each species and display in the command window:

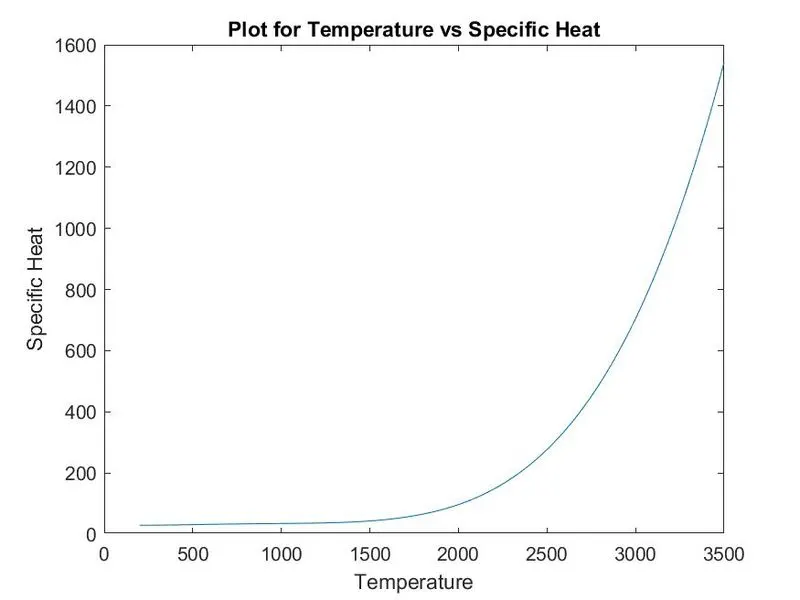
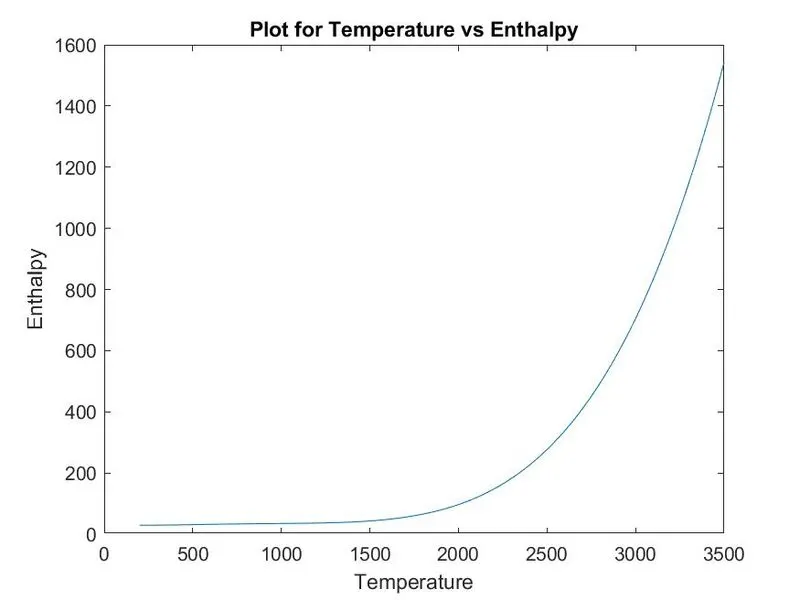
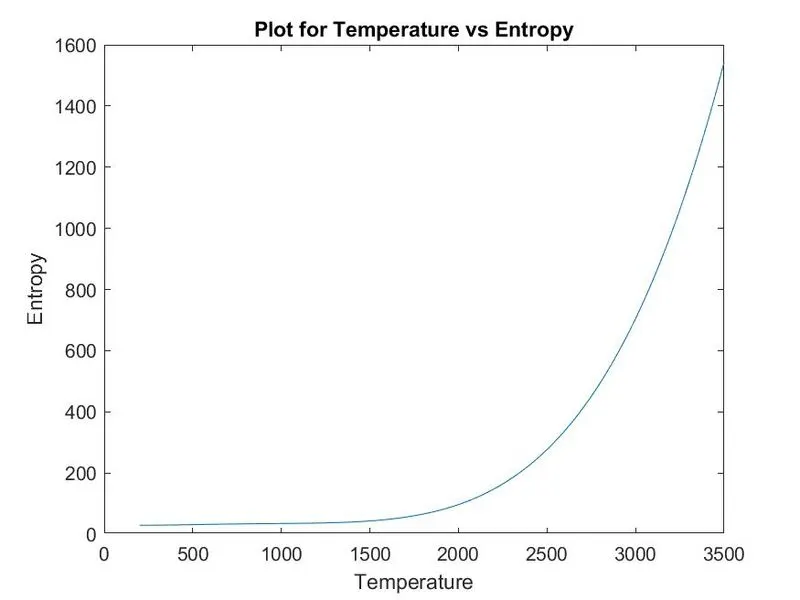
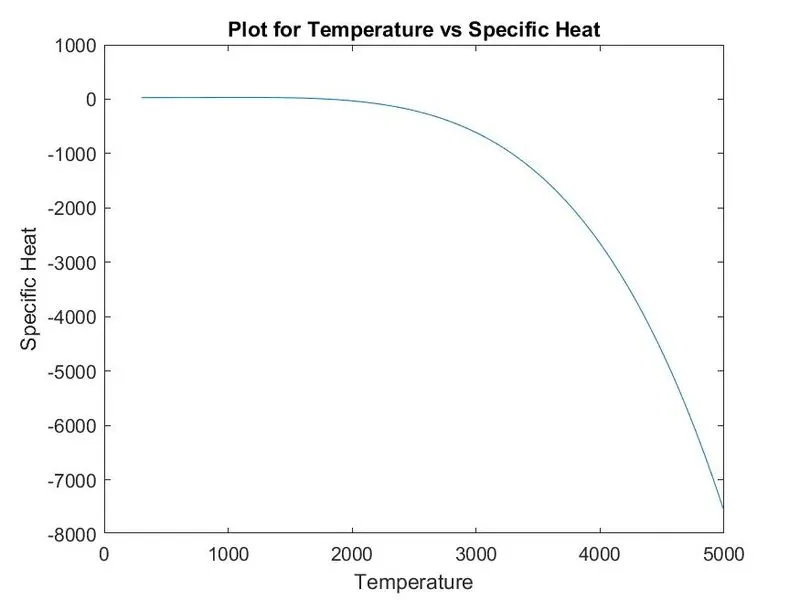
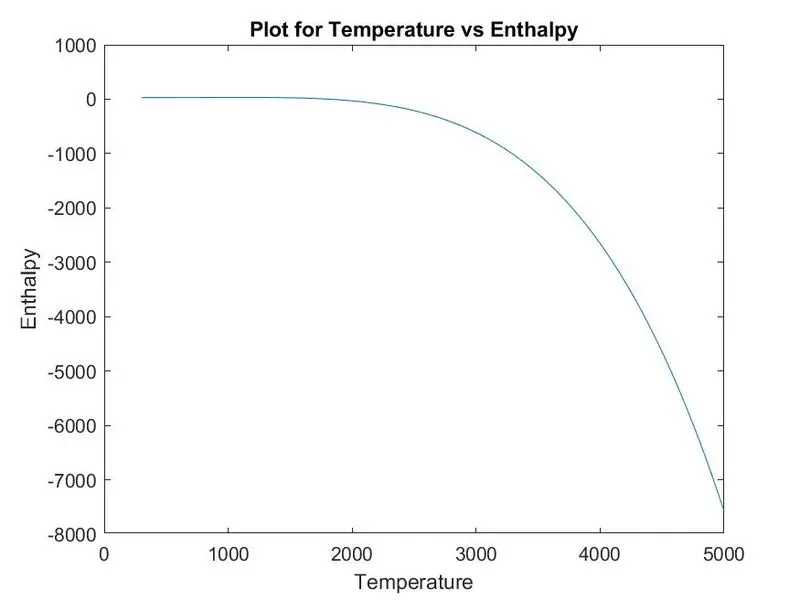
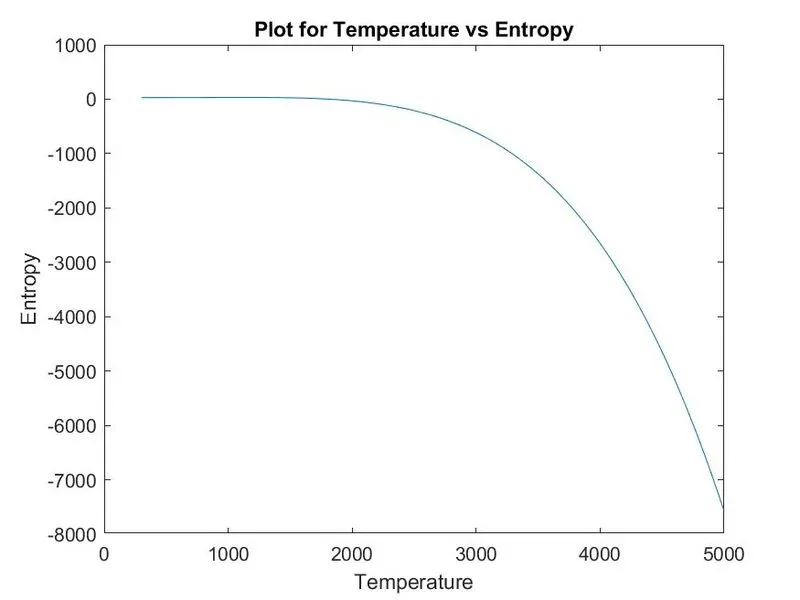
3. Plot the Cp, Enthalpy and Entropy for the local temperature range (low temp:high temp) specific for each species.
OUTPUT PLOTS:
- Plots for O2:
- Plots for N2:
- Plots for CO2:
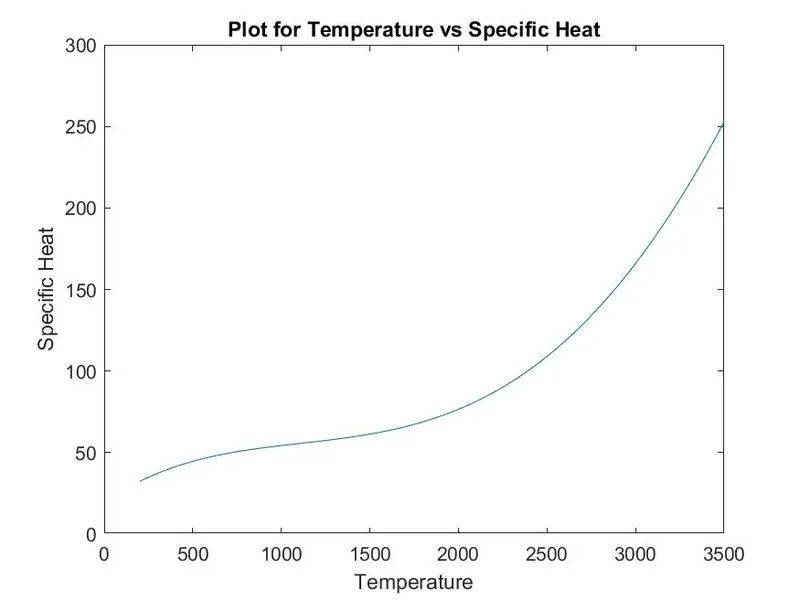
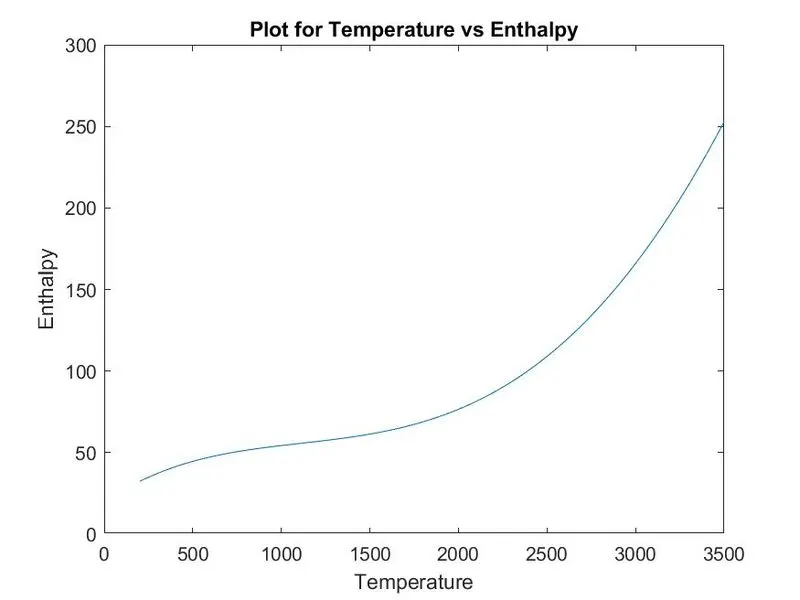
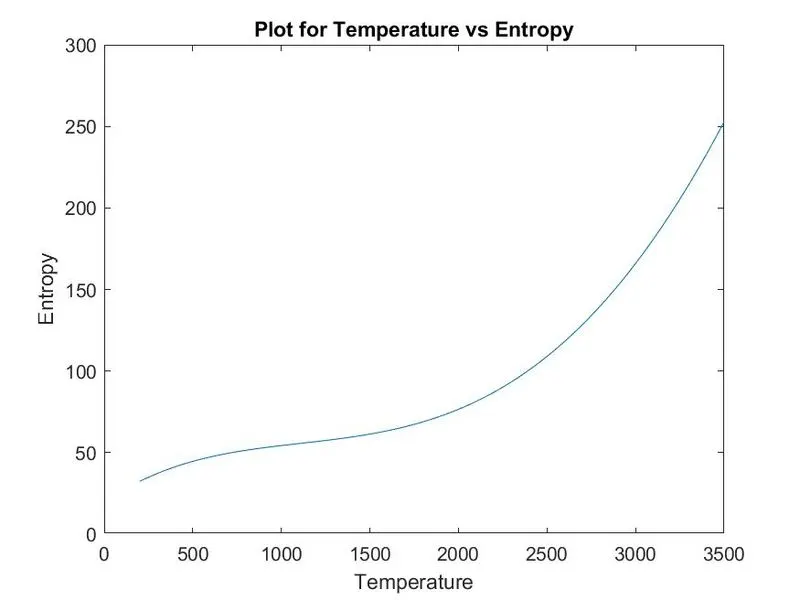
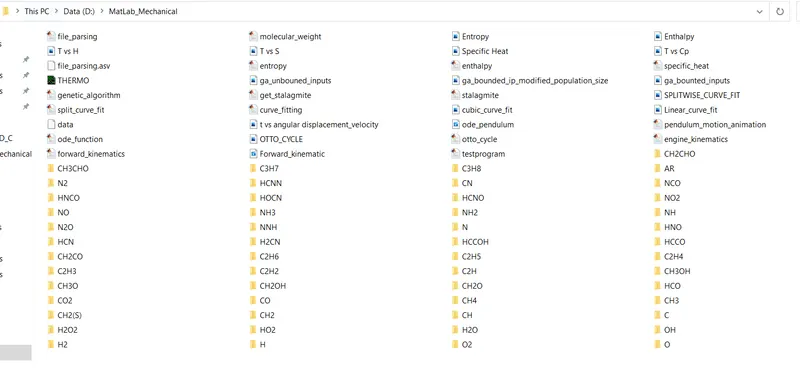
- All the plots are saved as images with appropriate names and are dumped them in separate folders for each species with suitable name which are generated automatically.
- Screenshot of the window where all the folders are saved.
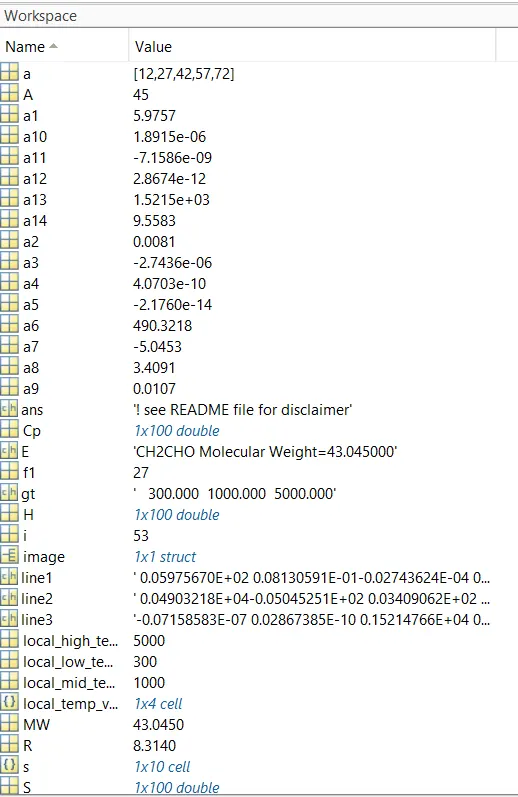
Workspace variable window:

EXPLANATION:
- The given data file 'THERMO.dat' is given as input to the main program using fopen command in read mode.
- The fgetl command is used to read the file line by line, which are frequently used in the program to read the header, comment and species block.
- In this case, the local temperature ranges are considered for each and every species to calculate the thermodynamic properties of the given species such as specific heat(Cp),enthalpy(H) and entropy(S).
- To calculate the Cp,H and S, specific equation is given in the question to determine the 14 coefficients, among which the 1st 7 coefficients are considered as high temperature coefficients i.e. from a1 to a7 and the next 7 coefficients are considered as low temperature coefficients i.e. from a8 to a14.
- The function specific_heat.m is used to calculate the Cp of all the species.
- Similarly functions enthalpy.m and entropy.m are used to evaluate the H and S of all the species respectively.
- The molecular weight for each of the species have been calculated using the function molecular_weight.m.
- The above functions have been called in the main program to evaluate the output for the required number of time.
- Separate file for each of the elements have been saved in the same directory as of the main program and function files. The description is given in the main program code.
- The molecular weights for every element is displayed in the command window.
- The plots for temperature vs specific heat, temperature vs enthalpy and temperature vs entropy for N2,O2 and CO2 have been attached as per the requirement in the given challenge.
- The matlab files along with the plots have been shared in the attachment for the review.