Project 1 - Parsing NASA thermodynamic data
AIM:-Write a function that extracts the 14 co-efficients and calculates the enthalpy, entropy and specific heats for all the species in the data file.
OBJECTIVE:-
. Calculate the molecular weight of each species
.Plot the Cp, Enthalpy and Entropy for the local temperature range (low temperature : high temperature) specific for each species.
CONCEPT:-
File Parsing:
It is the method of splitting the file or other input into a piece of data that can be easily stored or manipulated. By doing this we are going to split a string into parts then recognizing the parts to convert it into something simpler than a string
Here in this project we are going to split the NASA thermodynamic data which is having 53 gas species values in 213 lines. To perform the calculation for thermodynamic properties, de need some sort of co-efficient values and temperature ranges which is available in the NASA file. So, we are going to parse the values which are all needed for our calculation from that file.
Specific Heat:
Specific heat is the amount of heat energy required to raise the temperature of body per unit of mass. Specific heat is also known as specific heat capacity or mass specific heat. In SI units, specific heat is the amount of heat in joules required to raise 1 gram of a substance 1 Kelvin
Specific Heat:
Specific heat is the amount of heat energy required to raise the temperature of body per unit of mass. Specific heat is also known as specific heat capacity or mass specific heat. In Sl units, specific heat is the amount of heat in joules required to raise 1 gram of a substance 1 Kelvin.
Enthalpy:
When a substance changes at constant pressure, enthalpy tells how much heat and work was added or removed from the substance. Enthalpy is similar to energy but not the same. When a substance grows or shrinks, energy is used up or released.
Entropy:
The entropy of an object is a measure of the amount of energy which is unavailable to do work. Entropy is also a measure of the number of possible arrangements of atoms a system can have. In this sense, entropy is the measure of uncertainty or randomness.
Gas Constant:
The gas constant is a physical constant denoted by R and is expressed in terms of units of energy per temperature increment per mole. The gas constant value is equivalent to Boltzmann constant but expressed as the pressure-volume product instead of nergy per increment of temperature per particle.
Molecular Weight:
Molecular weight is a measure of the sum of the atomic weight values of the atoms in a molecule. Molecular weight is used in chemistry to determine stoichiometry in chemical reactions and equations.
NASA thermodynamics file which is THERMO.dat file in which there are temperature range and 53 species are given in these data and each species contains 14 coefficients and temperature ranges and we have to parse these 14 coefficients to find Specific heat. Entropy and Enthalpy using formula as:
where,
R- Universal Gas constant
T = Temperature
Cp - Specific heat (K})
S = Entropy(KJ/mol-K)
H-Enthalpy(KJ/mo!)
a(i) = Coefficients where, i 1 to 14

MAIN CODE
close all
clc

%Input

R=8.314; % Gas Constant

% Reading data file

% open file and reading THERMO.dat file
f1= fopen('THERMO.dat', 'r');
get=fgetl(f1);
% Now Reading Temperature from this file

temp = fgetl(f1);

%spliting

s=strsplit(temp);

% converting strings cells into numbers

templow=str2double(s{2});

tempmid = str2double(s{3});
temphigh = str2double(s{4});

% Temperature Range

T = linspace (templow, temphigh, 1000);
%Skipping comment lines

for i=1:3
    get=fgetl(f1);
end

% Reading the Species

for j=1:53

tline=fgetl (f1);

A=strsplit(tline,' '); % spliting into cell

species = (A{1});

% To read the n.

% Converting string to number

lowtemp = str2double (A{end-3});

midtemp = str2double (A{end-2});
hightemp = str2double(A{end-1});

tlinel = fgetl (f1);
% getting next line
a = strfind(tlinel, 'E');

% Finding First 7 higher and second 7 lower
% Finding Higher coefficients

a1 = tlinel (1:a(1)+3);

a1 = str2double(a1);

a2 = tlinel(a(1)+4:a(2)+3);

a2 = str2double(a2);

a3 = tlinel(a(2)+4:a(3)+3);

a3 = str2double(a3);
a4 = tlinel(a(3)+4:a(4)+3);

a4 = str2double(a4);
a5 = tlinel(a (4)+4:a(5)+3);

a5 = str2double(a5);

tline2 = fgetl(f1);
b = strfind(tline2, 'E');

a6 = tline2(1:b(1)+3);

a6 = str2double(a6);

a7 = tline2(b (1)+4:b(2)+3);

a7 = str2double(a7);

% Finding Lower coefficients

a8 = tline2(b (2)+4:b(3)+3);

a8 = str2double (a8);

a9 = tline2(b (3)+4:b(4)+3);

a9 = str2double(a9);

a10 = tline2(b (4) +4:b(5)+3);

a10 = str2double(a10);

tline3 = fgetl(f1);
c = strfind(tline3, 'E');
a11 = tline3 (1:c(1)+3);

a11 = str2double(a11);
a12 = tline3 (c(1)+4:c(2)+3);

a12 = str2double (a12);

a13 = tline3 (c(2)+4:c(3)+3); a13 = str2double(a13);

a14 = tline3 (c(3) +4:c(4)+3); a14 = str2double (a14);

% calculate specific heat

Cp= Specific_heat (a1, a2, a3, a4, a5, a8, a9, a10, a11, a12, T, R, tempmid);

S = Entropy (a1, a2, a3, a4, a5, a7, a8, a9, a10, a11, a12, a14, T, R, tempmid);

% claculate Enthalpy

H = Enthalpy (a1, a2, a3, a4, a5, a6, a8, a9, a10, a11, a12, a13, T, R, tempmid);

% Calculate Molecular weight of the Species
W = Molecular_weight(species);

% writing molecular weight file
MW_file = fopen('Molecular weight.txt', 'w');
fprintf(MW_file, 'Molecular weight of %s is %d',species,W);
fclose(MW_file); % Closing the file

% Plotting Cp, H and S with Temperature

% Saving in a folder
cd('C:\Users\RAHUL RAJ\Desktop\species'); %changing directory
mkdir(species);  %creating directory
cd (species);

% Plot Cp vs T

figure (1)

plot (T,Cp, 'linewidth',2, 'color', 'b');
xlabel('Temperature (K)');

ylabel('Specific Heat (KJ)');
title(sprintf('Specific heat vs Temperature range of %s', species));

grid on

saveas (figure (1), 'Specific Heat.jpg');

% Plot2 S vs T

figure (2)

plot (T,S,'linewidth',2, 'color','r');

xlabel('Temperature');

ylabel('Entropy (KJ/mol-K)');

title(sprintf('Entropy vs Temperature range of %s',species));

grid on

saveas (figure(2), 'Entropy.jpg');
% Plot3 Cp vs T

figure (3)

plot (T,H, 'linewidth', 2, 'color','g');

xlabel('Temperature'); ylabel('Enthalpy (KJ/mol)');

title (sprintf('Enthalpy vs Temperature range of %s',species))

grid on

saveas (figure(3), 'Enthalpy.jpg');

cd('C:\Users\RAHUL RAJ\Desktop\species') % Chaning directory to original path


end
STEPS:-
CLOSE all
clc
then after use Input the parameter R and we will open a file THERMO.dat file and reading this file using fopen command.
• Then, we will read first THERMO using fgetl command and then we read temperature file and we will split the temperatures using strsplit command to convert it into cell array and then we will convert this string to number using str2double (str2num) command to find low, high and mid temperatures,
• Then we will assign temperature range using linspace command Then we run loop to skip command lines the data file using fgetl command inside the loop.
• Now, we will run the loop to find 53 element in the data file by assigning fgetl command and then spliting into the cell array to find the
species line and then find the species name and then find the number of the temperatures in the species line.
• Then we read the new line. In order to read the coefficient in the data file we will first find the 'E string using strfind command to find before and after numbers of the coefficients then we will find remaining 14 coefficients and convert them to numbers from strings. Out of which we will find first 7 Coefficients which are for Higher temperature and then Second 7 Coefficients which are for Lower
temperature.
• Now we will specify Specific heat Cp, Entropy S. Enthalpy H functions to find these parameters using these 14 coefficients for Lower and higher Temperature, then we will specify molecular weight W function to find the Molecular weight of the different species.
. Now we will write the Molecular weight.txt file and fprintf all the molecular weights of the species, and then close the txt file using fclose command.
• Now we change the directory using cd command and then creating directory folder where we have to save our files using mkdir command and then we will change the directory to this created folder. • Now, we will plot Specific heat. Entropy and Enthalpy with the Temperature for different species.
• Then we will use saveas command to save the plots of different species in the directory folder. Now we will change the directory to which our main code file runs in the MATLAB.
specific heat function code
function Cp = Specific_heat(a1, a2, a3, a4, a5, a8, a9, a10, a11, a12, T, R, tempmid)

% calculating specific heat

% calculating specific heat for higher and lower temperature repectively.

if (T <= tempmid)


Cp = R*(a1 + (a2*T) + (a3* (T).^2)+ (a4* (T).^3) + (a5* (T).^4));

else

Cp = R*(a8 + (a9*T) + (a10* (T).^2) + (a11* (T).^3) + (a12* (T).^4));


end
Now we will find the Specific heat by creating Specific heat function and assigning its relted formula coefficent from 14 coefficients, Gas constant, Temperature and mid temperature.
• Now we will creatre an condition using if loop and make the temperature less than and equal to mid temperature to specify lower
temperature coefficent in the formula. • Then we will use else condition to specify coefficient of Higher temperature coefficent in the formula.
. Then end the loop and function to calculate Specific Heat
entropy
function S = Entropy (a1, a2, a3, a4, a5, a7, a8, a9, a10, a11, a12, a14, T, R, tempmid)

% calculating entropy

% calculating entropy for higher and lower temperature repectively.

if (T <= tempmid)


S = R.*(a1.*log (T) + (a2.*T) + ((a3*(T).^2)/2) + ((a4*(T).^3)/3) +((a5.* (T).^4)/4) + a7);

else


S = R.*(a8.*log (T) +(a9.*T) +((a10*(T).^2)/2) +((a11*(T).^3)/3)+((a12.* (T).^4)/4)+ a14);


end
Now we will find the Entropy by creating Entropy function and assigning its relted formula coefficent from 14 coefficients, Gas constant,
Temperature and mid temperature.
• Now we will creatre an condition using if loop and make the temperature less than and equal to mid temperature to specify lower temperature coefficent in the formula.
• Then we will use else condition to specify coefficient of Higher temperature coefficent in the formula.
• Then end the loop and function to calculate Entropy.
enthapy
function H = Enthalpy (a1, a2, a3, a4, a5, a6, a8, a9, a10, a11, a12, a13, T, R, tempmid)

% calculating enthalpy

% calculating enthalpy for higher and lower temperature repectively.

if (T<= tempmid)

H = R*T.* (a8 + ((a9*T)/2) + ((a10* (T).^2)/3) + ((a11*(T).^3)/4) + ((a12* (T).^4)/5)+ ((a13./T)));
else
H = R*T.* (a1 + ((a2*T)/2) + ((a3* (T).^2)/3) + ((a4* (T).^3)/4) + ((a5* (T).^4)/5) +((a6./T)));


end

end
Now we will find the Enthalpy by creating Enthalpy function and assigning its relted formula coefficent from 14 coefficients, Gas constant, Temperature and mid temperature.
• Now we will creatre an condition using if loop and make the temperature less than and equal to mid temperature to specify lower temperature coefficent in the formula.
• Then we will use else condition to specify coefficient of Higher temperature coefficent in the formula.
• Then end the loop and function to calculate Enthalpy.
molecular weight
function W = Molecular_weight(species)

% Defining Atomic name of the species

atomic_name = ['H', 'C', 'O', 'N', 'Ar'];

% Defining Atomic masses of main species
atomic_weight = [1.008 12.011 15.999 14.007 39.948];


W=0; % Molecular weight starting range

 for i = 1:length(species)  % Loop runs to the length of the species
   for j = 1:length(atomic_name) % Loop runs to the length of the atomic names
     if strcmp(species(i), atomic_name(j)) %function to compare 2 strings
         W = W+ atomic_weight(j);
      position =j;

     end

   end
n = str2double(species); % Now we will find if there is more element in the species then incrementing atomic weight of the spcies

if n>1

       W = W + atomic_weight(position)*(n-1);
end
end
fprintf('molecular_Weight of %s:-',species);
fprintf('%f',W);

disp('');

end
Firstly we create an Molecular_weight function W and assigning species input to that.
• Then define the main element of all 53 species in an array atomic_name that are:- 'HCO N Ar
• Then by taking above main elements we will create there atomic_wieght array from any source like internet that are:- 1.008 12.011 15.999 14.007 39.948.
• Then we will assign molecular starting range W To zero and then create an for loop condition which runs to the length of the species and an another nested for loop is created which runs to the length of the string atomic_name.
• Then we will create an condition using if condition and use strcmp command to compare the species and atomic_name strings to calculate molecular masses if by comparison both string found same then we will assign its molecular weight.
• Now, we will string to the number using str2double command assign to n. Then we run an condition of if loop to find weather the species contains more than one element if there are more then 1 elements that is n>1 then we will increment the atomic weight by the multiplication of position and n-1 to the atomic_weight array.
• Then we will print the Molecular weight using fprintf command and display it using disp command.
output:-
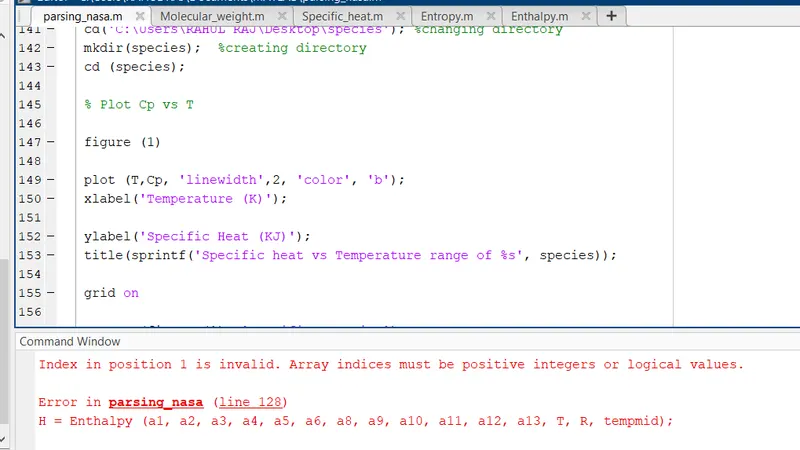
erros
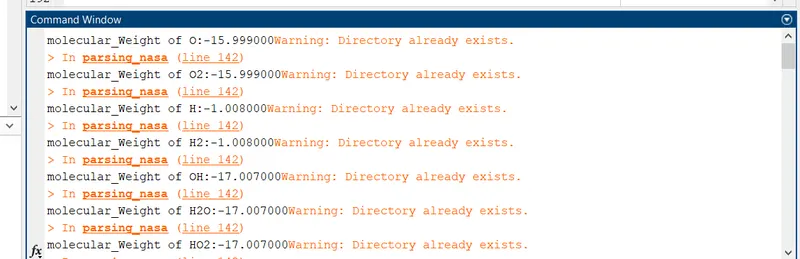
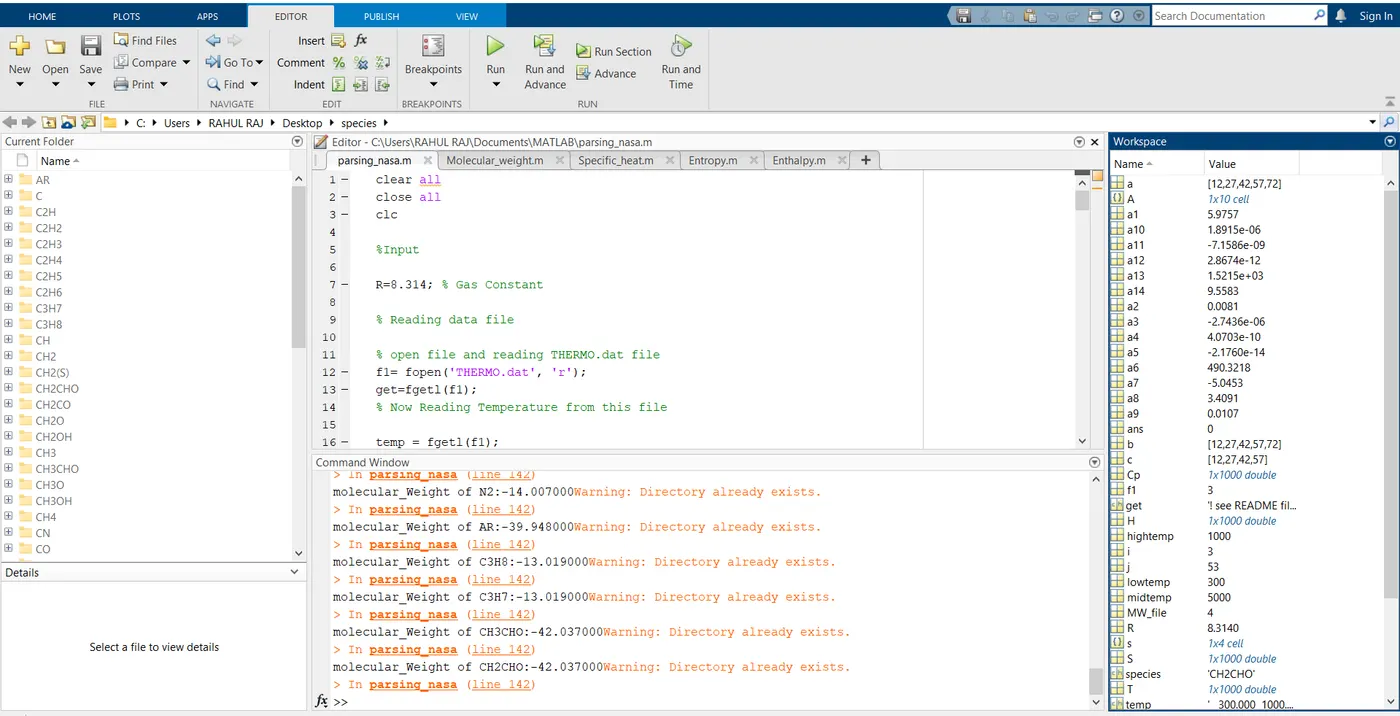
results as all species molecular weight & its graph specific heat ,entropy ,enthapy
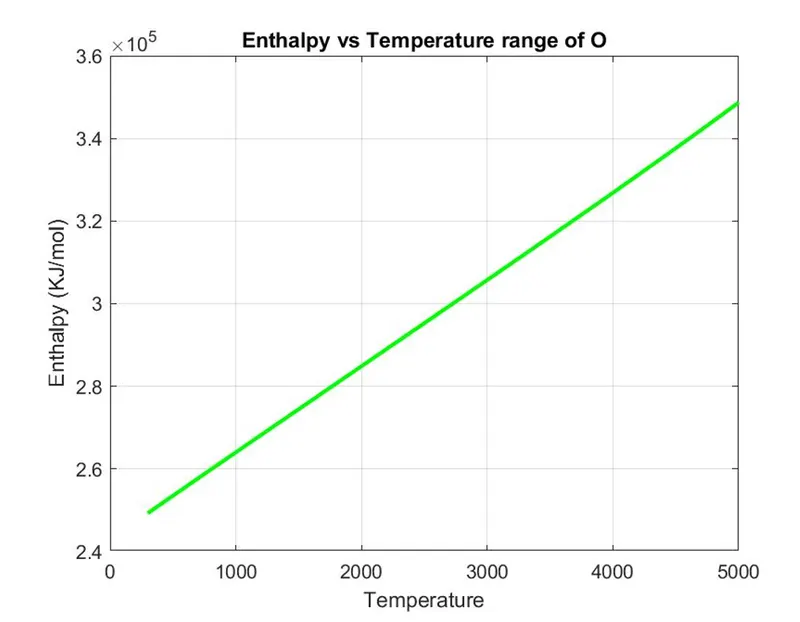
plots of some speciess:-
SPECIES O2 PLOTS ENTHALPY VS TEMP
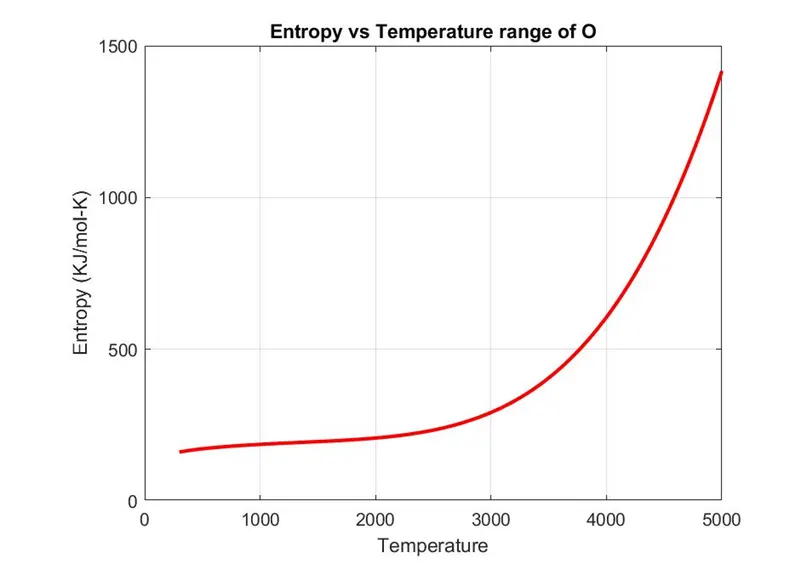
PLOTS O2 ENTROPY VS TEMP
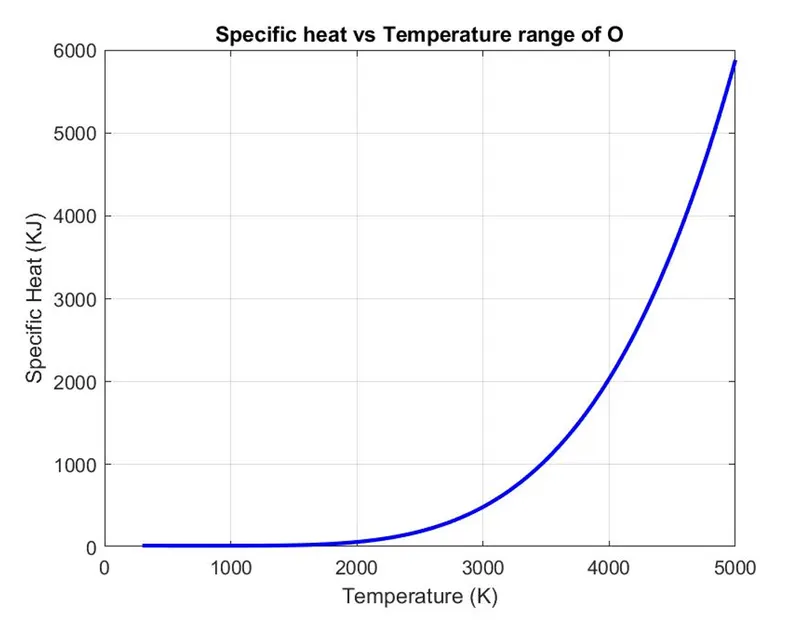
PLOTS SPECIES O2 SPECFIC HEAT VS TEMP
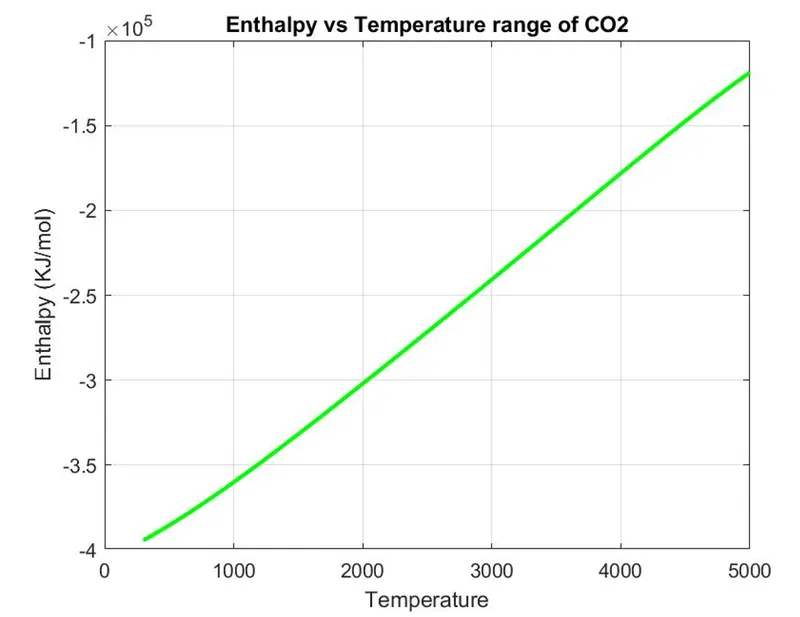
SPECIES CO2 PLOT ENTHALPY VS TEMP
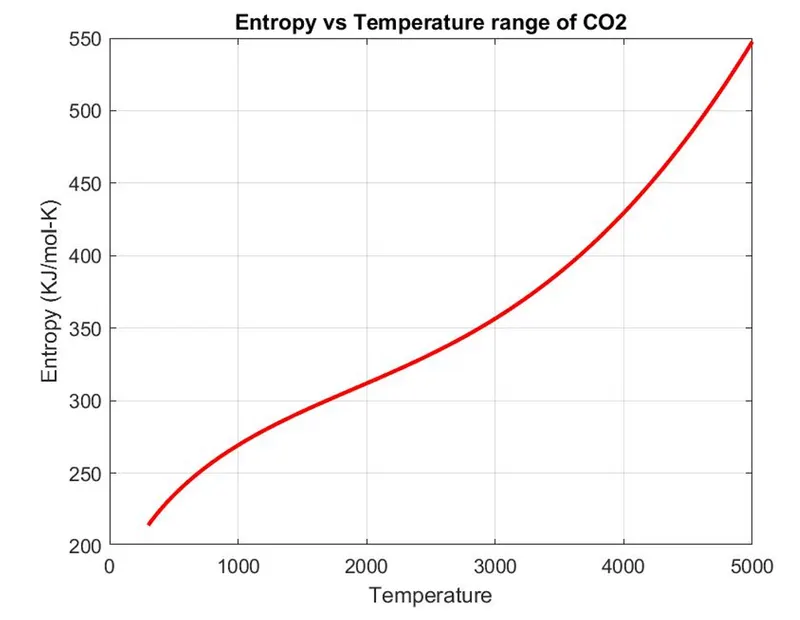
SPECIES CO2 PLOT ENTROPY VS TEMP
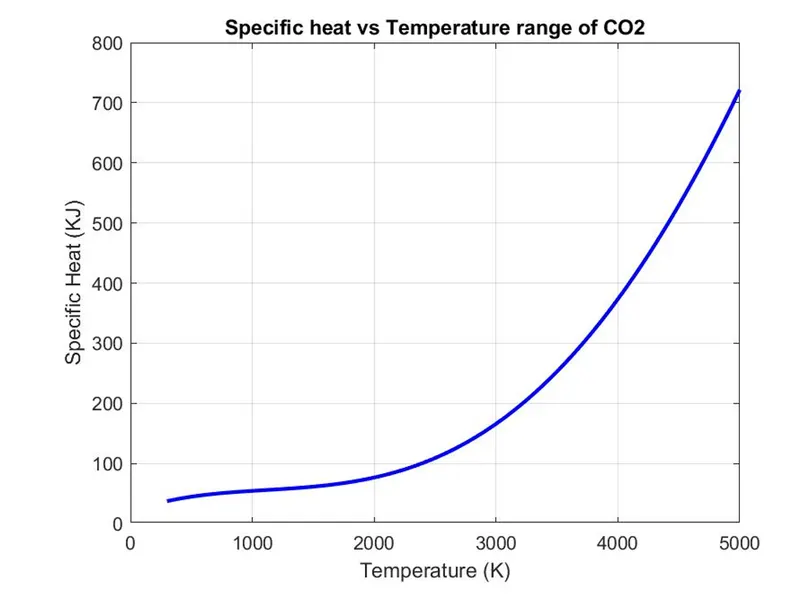
SPECIES CO2 PLOT SPECIFIC HEAT VS TEMP
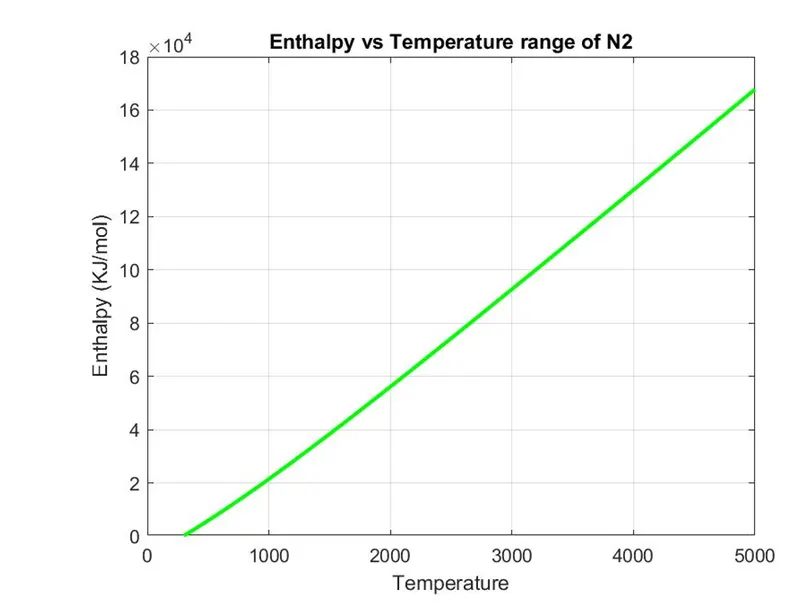
SPECIES N2 PLOT ENTALPY VS TEMP
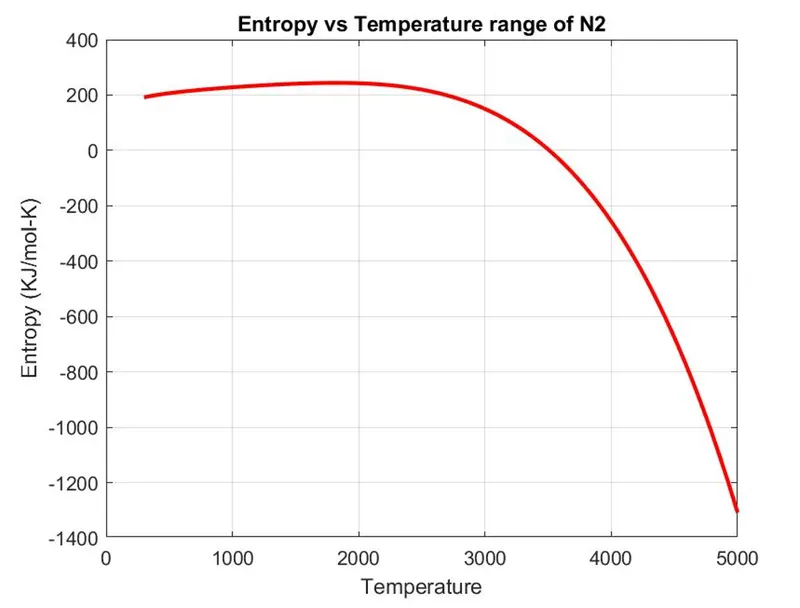
SPECIES N2 PLOT ENTROPY VS TEMP
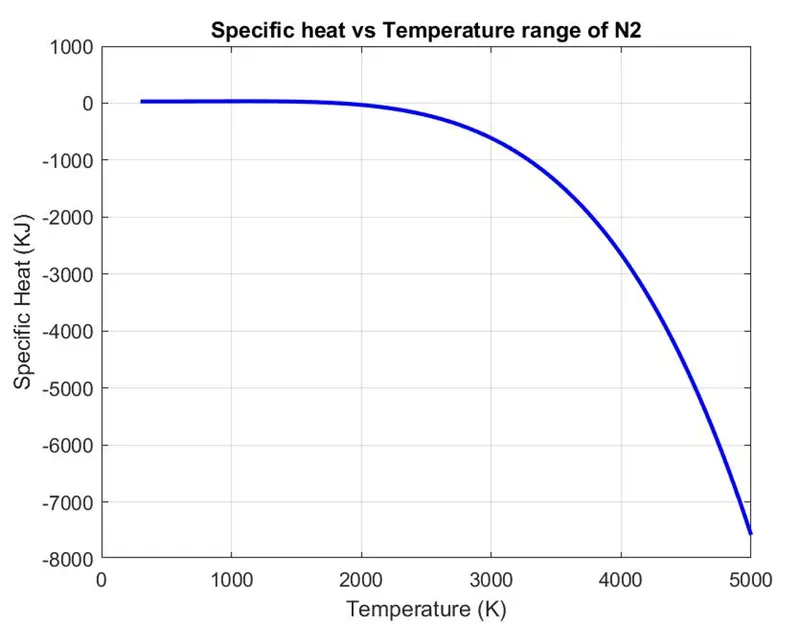
SPECIES N2 PLOT SPECIFIC HEAT VS TEMP
GRAPH FILE OF ALL SPECIES

REFRENCE
https://en.wikipedia.org/wiki/Parsing
https://in.mathworks.com/help/matlab/ref/mkdir.html