Project 1 - Parsing NASA thermodynamic data
AIM:1) to extracts 14 cofficents and to calucate enthaphy,entropy,and specific heat from nasa thermodynamic data.
2)To Calculate the molecular weight of each species.
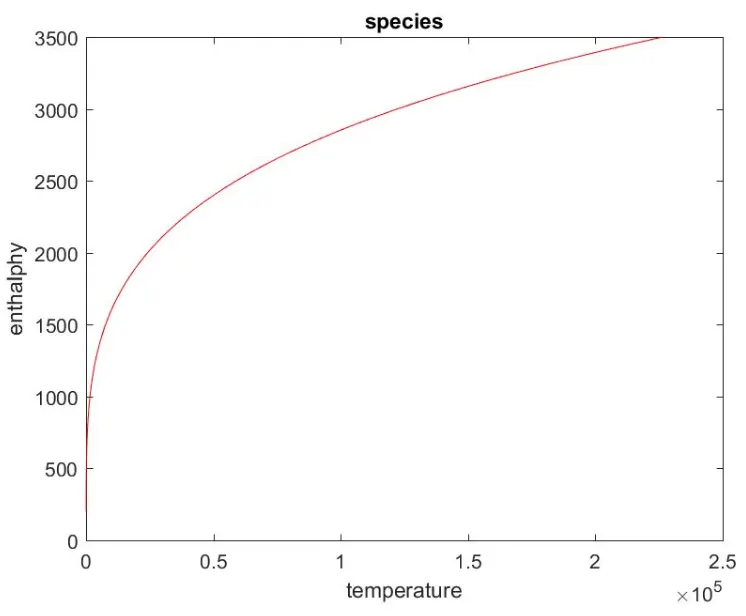
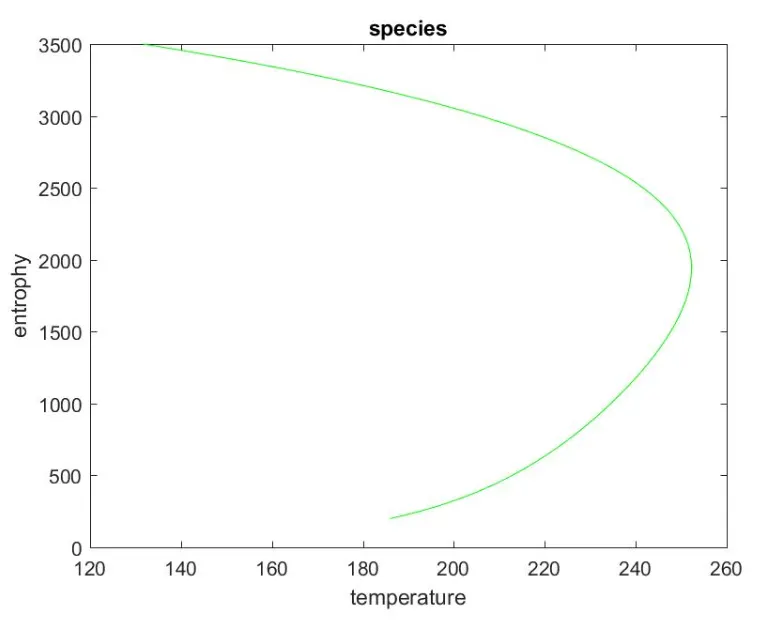
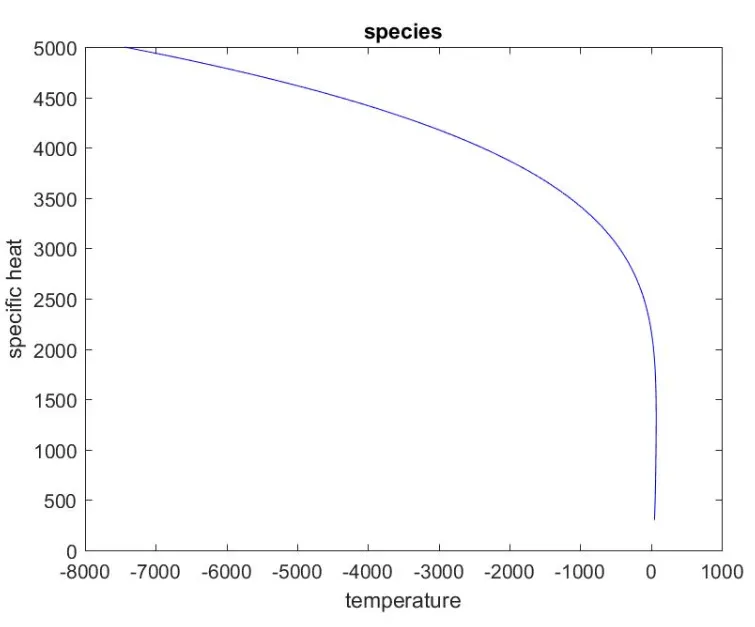
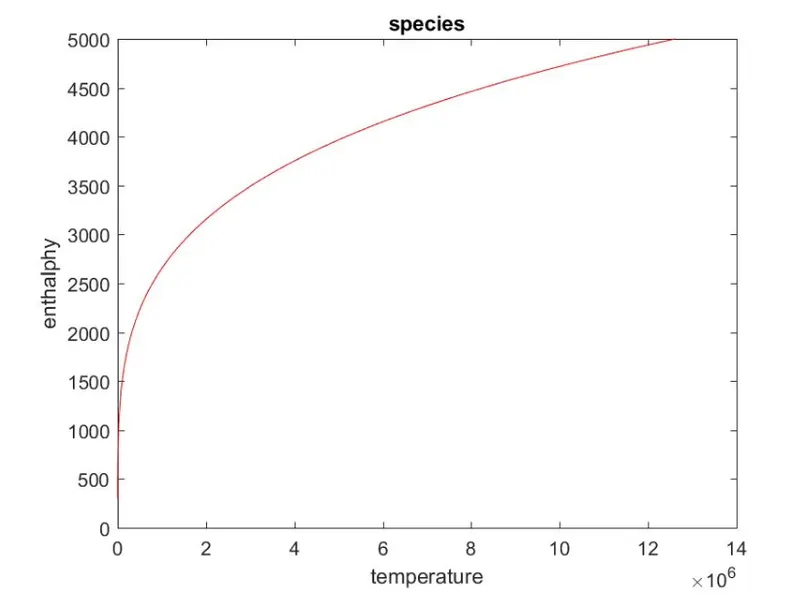
3. To Plot the Cp, Enthalpy and Entropy for the local temperature range.
4. Save the plots as images with appropriate names and dump them in separate folders for each species with suitable name.
theory:Specific heat, the quantity of heat required to raise the temperature of one gram of a substance by one degree celcius. The units of specific heat are usually joules per gram per Celsius degree.
Enthalpy (H) is the sum of the internal energy (U) and the product of pressure and volume (PV) given by the equation: H=U+PV.
When a substance changes at constant pressure, enthalpy tells how much heat and work was added or removed from the substance. Enthalpy is similar to energy, but not the same.
entropy, the measure of a system's thermal energy per unit temperature that is unavailable for doing useful work. Because work is obtained from ordered molecular motion, the amount of entropy is also a measure of the molecular disorder, or randomness, of a system.
MAIN PROGRAM
f1 = fopen('THERMO.dat','r')
% for header
fgetl(f1);
%universal gas constant (j/k mol)
R = 8.314;
tline = fgetl(f1);
A = strsplit(tline,' ');
%defining global temperatures
global_low_temp = str2num(A{2});
global_mid_temp = str2num(A{3});
global_high_temp = str2num(A{4});

%skipping next 3 lines

%for loops for skipping 3 lines

for i = 1:3
    fgetl(f1);

end

%reading all lines of species
for i =1:53
   tline1 = fgetl(f1);
   %defining species
   species_split = strsplit(tline1,' ');
   species_cell = species_split(1);
   species = char(species_cell);

   %for determing locaal temperatures
   A = findstr(tline1,'.');
  A1 = tline1(A(1)-4:A(1)+3);
  A2 = tline1(A(2)-4:A(2)+3);
  A3 = tline1(A(3)-4:A(3)+3);

local_low_temp = str2num(A1);
local_med_temp = str2num(A3);
local_high_temp = str2num(A2);

%finding the cofficents
tline2 = fgetl(f1);
B = findstr(tline2,'E');
a1 = str2num(tline2(1:B(1)+3));
a2 = str2num(tline2(B(1)+4:B(2)+3));
a3 = str2num(tline2(B(2)+4:B(3)+3));
a4 = str2num(tline2(B(3)+4:B(4)+3));
a5 = str2num(tline2(B(4)+4:B(5)+3));

%cofficents from line second
tline3 = fgetl(f1);
a6 = str2num(tline3(1:B(1)+3));
a7 = str2num(tline3(B(1)+4:B(2)+3));
a8 = str2num(tline3(B(2)+4:B(3)+3));
a9 = str2num(tline3(B(3)+4:B(4)+3));
a10 = str2num(tline3(B(4)+4:B(5)+3));

%cofficents from 3rd line
tline4 = fgetl(f1);
a11 = str2num(tline4(1:B(1)+3));
a12 = str2num(tline4(B(1)+4:B(2)+3));
a13 = str2num(tline4(B(2)+4:B(3)+3));
a14 = str2num(tline4(B(3)+4:B(4)+3));
%a1-a7 are high temp cofficents and a8-a14 are low temp cofficents

%finding the molecular weight of species
[m_weight] = mol_wt(species);
 sprintf('molecular weight is %s = %f',species,m_weight)

% finding cp, enthalpy ,entropy, for local temp

T = local_low_temp:local_high_temp;
if (T > local_med_temp)
    %specific heat
    cp = R*(a1+(a2*T)+(a3*(T.^2))+(a4*(T.^3))+(a5*(T.^4)));

    %enthalphy
    H = R*(a1+(a2*T/2)+(a3*(T.^2)/3)+(a4*(T.^3)/4)+(a5*(T.^4)/5)+(a6*T));

    %entropy
    S = R*((a1*log(T))+(a2*T)+(a3*(T.^2)/2)+(a4*(T.^3)/3)+(a5*(T.^4)/4)+a7);

else
    %specific heat
     cp = R*(a8+(a9*T)+(a10*(T.^2))+(a11*(T.^3))+(a12*(T.^4)));

     %enthalphy
    H = R*(a8+(a9*T/2)+(a10*(T.^2)/3)+(a11*(T.^3)/4)+(a11*(T.^4)/5)+(a12*T));

     %entropy
    S = R*((a8*log(T))+(a9*T)+(a10*(T.^2)/2)+(a11*(T.^3)/3)+(a12*(T.^4)/4)+a14);
end
%creating folder for the species
t = sprintf('%s',species)
mkdir(t);
cd(t)

%plotting
figure(1)
plot(cp,T,'b');
xlabel('temperature')
ylabel('specific heat')
title('species')
saveas(gcf,'cp.jpg')

figure(2)
plot(H,T,'r');
xlabel('temperature')
ylabel('enthalphy')
title('species')
saveas(gcf,'H.jpg')

figure(3)
plot(S,T,'g');
xlabel('temperature')
ylabel('entrophy')
title('species')
saveas(gcf,'S.jpg')


end
FUNCTION OF MOLECULAR WEIGHT
function [m_weight] = mol_wt(species)

%definig the elements
elements = ['H','C','N','O','R'];

%Atomic weight of elments
atomic_weight = [1 12 14 16 40];

m_weight = 0;

for i = 1:length(species)
    for j = 1:length(elements)
       if strcmp(species(i),elements(j))
           m_weight = m_weight+atomic_weight(j);
           a = j;
       end
    end


    n = str2double(species(i));
   if n>1

    m_weight = m_weight+(atomic_weight(a))*(n-1);
   end
end
end
Explanation:
use fopen command to open and read thermo file.
using fgetl command to go to next step to get global temp by use of strsplit command to convert string to cell by use of str2num command convert it cell to number.
by use of for loop 1 =1:3 to skip next 3 line
tline = fgetl(f1) to go next line
by use of strsplit toconvert into and use species = char command to difine species
tline2 = fgetl(f1) to go to next line
by use of findstrt command to at line2 by use findstr(tline1,'.') to get local temps
tline2 (A(1)-4:A(1)+3) to get low local temp same for medium and high temp
tilne2 = fgetl(f1) to get into next line
for finding cofficents a1-a14
use findstr(tline,'E')
and str2num get a1-a14
by use of molecular function to get the molecular weight of all the species
after that by use of plot command i ploted graph against specific heat and temp,and enthalphy and temp and entrophy and temp.
PLOTTING
O2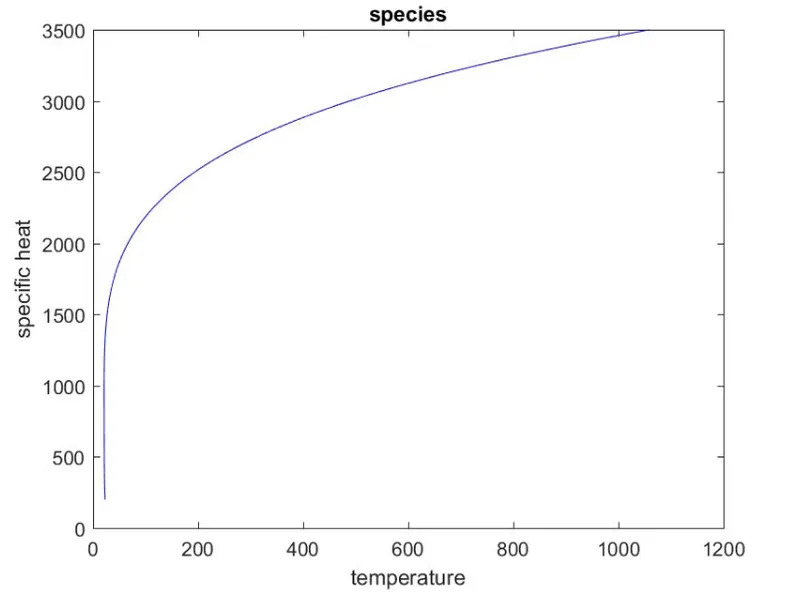
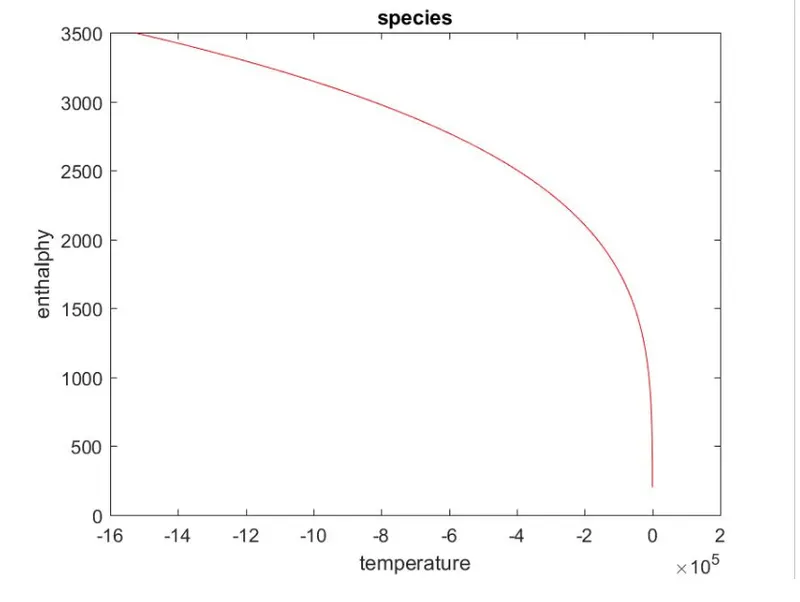
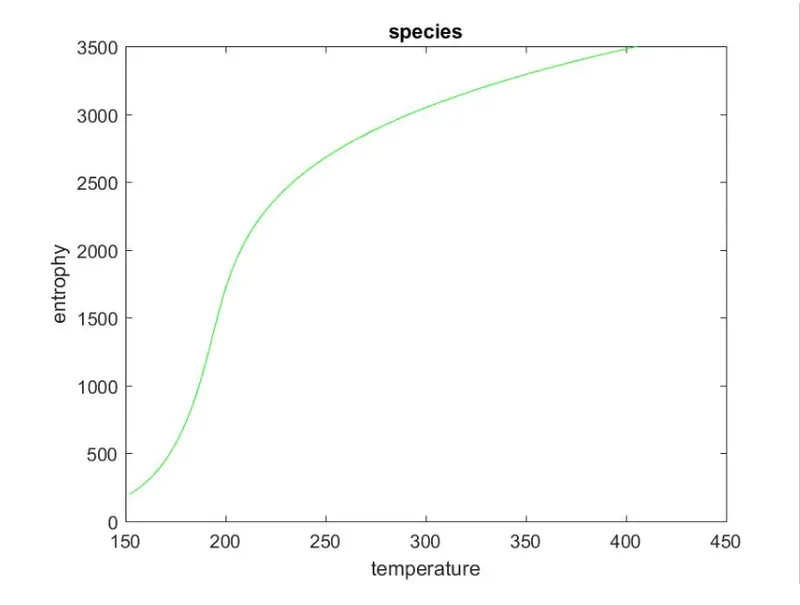
2)CO2
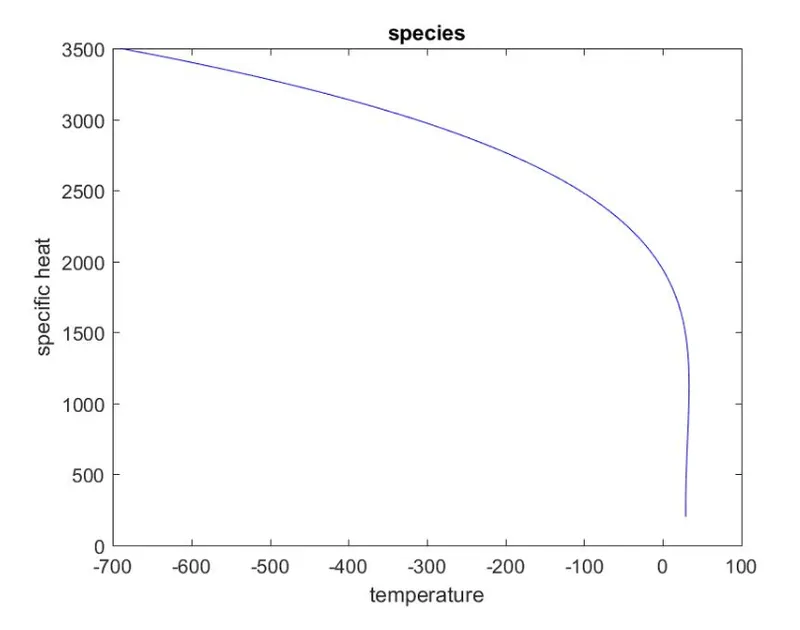
3)N2
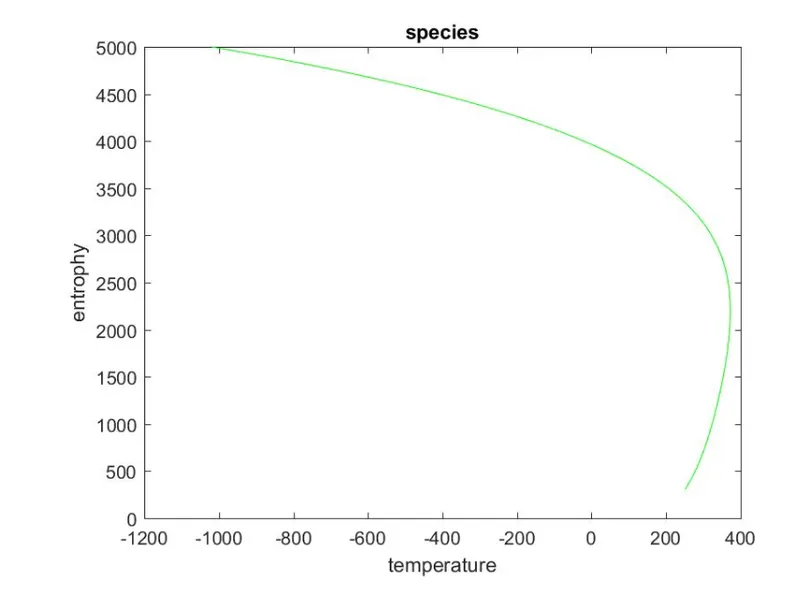
CONSULSION : all the graph are exicuted well and got molecular weight of all species.