Project 1 - Parsing NASA thermodynamic data
To plot the graph of entropy, enthalpy, and specific heat.
and this is done using extracting 14 co-efficents and coefficents are further are divided into hight temperaturea and low temperature coefficents.
steps wise explanation of code-
1)the file is opened using fopen command.
2)each line is read by using 'fgetl' command.
3)then 'strsplit' command is used for spliiting the array, then global temperature's are found out.
3)next three lines are not used for program, so they are skipped using for loop.
4) Next line is information about species, and there are 53 species and the program remains same for all the species so for loop is used here, and the main program is typed inside the main for loop.
5)The first line of any species contains species name and the local temperatures and next three line contain co-efficents
6)So first strsplit is done and then species name and local temperatures are found out.
7) local tmeperatures are found out for each species, and according to this temperature graph are plotted for each species.
8) In order to get the coefficents first strfind command is used to find E and according to placemnt of E coefficents are defined.
9)Then temperature differentiated according to local mid temperature, if temperature are greater then local mid temperature a1-a7 coefficents are used, otherwise a8 -a14 are used.
10)then folder is made using mkdir command and to enter the folder and cd command are used.
11)using formulae of enthalpy entropy and specific heat, plots are plottedd using plot command and plots are saved using save as command and then cd .. is used to exist from the the folder.
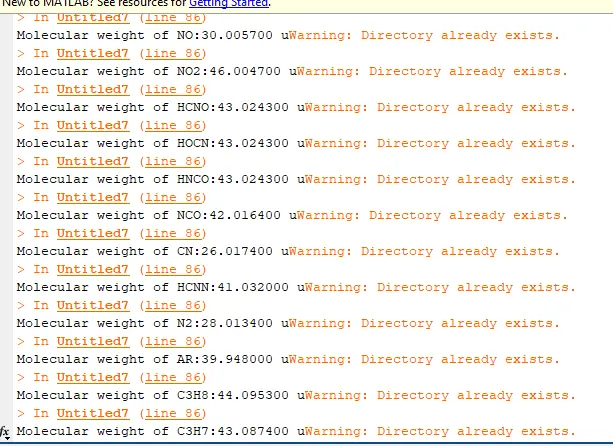
12)species name and elements are compared using strcmp and then molecular weight is found using two for loops and if any elements are repeated then using if condition atomic weight is added to molecular weight.
clear all
close all
clc

R= 8.314;

f1= fopen('THERMO.dat','r');
line_1 = fgetl(f1);
%header information
a = fgetl(f1);
a= strsplit(a,' ');

global_low_temp = str2num(a{2});
global_mid_temp = str2num(a{3});
global_high_temp = str2num(a{4});


for i= 1:3
    fgetl(f1);
end

for i = 1:53
    b= fgetl(f1);
   c = strsplit(b,' ');
     species_name = (c{1});
    d = length(c);

  local_low_temp = str2num(c{d-3});
  local_mid_temp = str2num(c{d-1});
  local_high_temp = str2num(c{d-2});

  line_1 = fgetl(f1);

  a = findstr(line_1,'E');

  a1 =str2num(line_1(1:a(1)+3));
  a2= str2num(line_1(a(1)+4:a(2)+3));
  a3= str2num(line_1(a(2)+4:a(3)+3));
  a4 =str2num(line_1(a(3)+4:a(4)+3));
  a5 =str2num(line_1(a(4)+4:a(5)+3));

  line_2 =fgetl(f1);
  b= findstr(line_2,'E');

  a6  = str2num(line_2(1:b(1)+3));
  a7  = str2num(line_2(b(1)+4:b(2)+3));
  a8  = str2num(line_2(b(2)+4:b(3)+3));
  a9  = str2num(line_2(b(3)+4:b(4)+3));
  a10 = str2num(line_2(b(4)+4:b(5)+3));

  line_3 = fgetl(f1);
  c = findstr(line_3,'E');

  a11 =str2num(line_3(1:c(1)+3));
  a12 =str2num(line_3(c(1)+4:c(2)+3));
  a13 = str2num(line_3(c(2)+4:c(3)+3));
  a14 = str2num(line_3(c(3)+4:c(4)+3));

   T = linspace(local_low_temp,local_high_temp,500);

for i = 1:length(T)
%     to compare the species  temperature to assign the coeffeceints
%     a1-a7 (high temperature coeffeceints), a8-a14(low temperature coeffecients)
    if T(i)>local_mid_temp

%         high temperature coeffeceints.

        cp(i)=(a1+a2*T(i)+a3*T(i)^2 + a4*T(i)^3 + a5*T(i)^4)*R;

        H(i)=(a1+(a2*T(i))/2+(a3*T(i)^2)/3 + (a4*T(i)^3)/4 + (a5*T(i)^4)/5 + (a6/T(i)))*R*T(i);

        S(i)=(a1*log(T(i)) + a2*T(i) + (a3*T(i)^2)/2 + (a4*T(i)^3)/3 + (a5*T(i)^4)/4+a7)*R;

    else
%         low temperature coeffecients

        cp(i)=(a8+a9*T(i)+a10*T(i)^2 + a11*T(i)^3 + a12*T(i)^4)*R;

        H(i)=(a8 + (a9*T(i))/2 + (a10*T(i)^2)/3 + (a11*T(i)^3)/4 + (a12*T(i)^4)/5 + (a13/T(i)))*R*T(i);

        S(i)=(a8*log(T(i)) + a9*T(i) + (a10*T(i)^2)/2 + (a11*T(i)^3)/3 + (a12*T(i)^4)/4 + a14)*R;
    end
end


    mkdir(species_name)
     cd(species_name)


figure(1)
plot(T,S,'linewidth',4,'color','b')
title('species_name')
xlabel('temperature')
ylabel('entropy')
saveas(1,'entropy','jpg')

figure(2)
plot(T,H,'linewidth',4,'color','r')
title('species_name')
xlabel('temperature')
ylabel('enthalpy')
  saveas(2,'enthalpy','jpg')

figure(3)

plot(T,cp,'linewidth',4,'color','g')
title('species_name')
xlabel('temperature')
ylabel('specific heat')
saveas(3,'specific heat','jpg')


cd ..


 elements = ['H', 'C','O','N','A'];
atomic_weight =[1.0079 12.0107 15.999 14.0067 39.948];
mol_mass = 0;

for i = 1:length(species_name);
    for m= 1:length(atomic_weight);
        if strcmp(species_name(i),elements(m));
            mol_mass = mol_mass+atomic_weight(m);
            position = m;
        end
    end
    n= str2num(species_name(i));
    if n>1
        mol_mass = mol_mass+atomic_weight(position)*(n-1);

    end
end
fprintf('Molecular weight of %s:%f u',species_name,mol_mass);

end

fclose(f1)
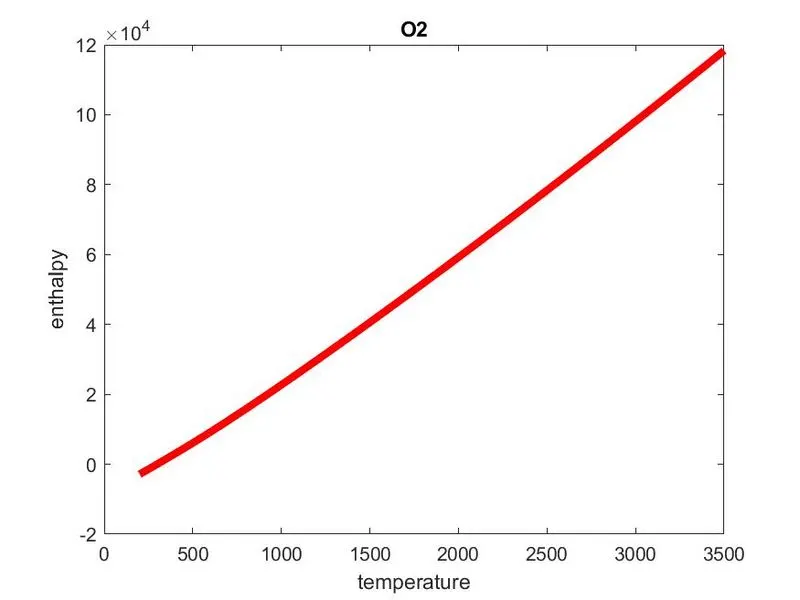
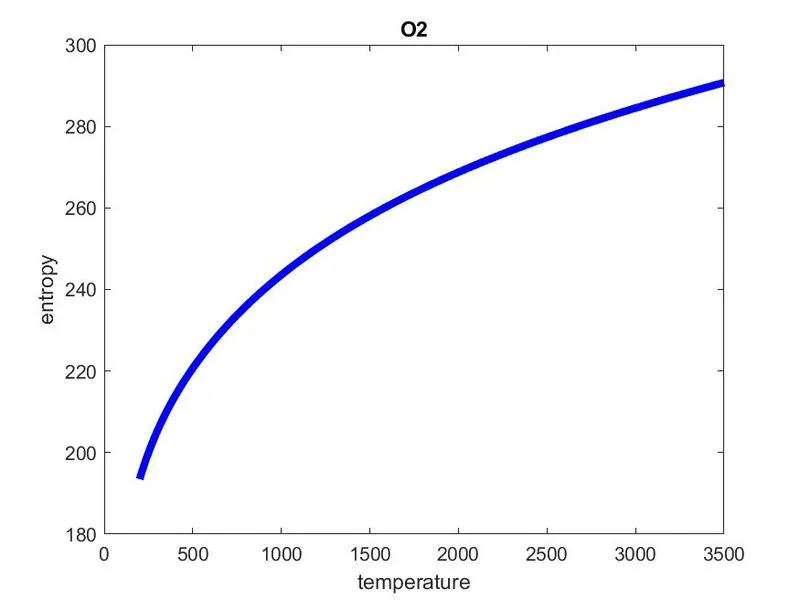
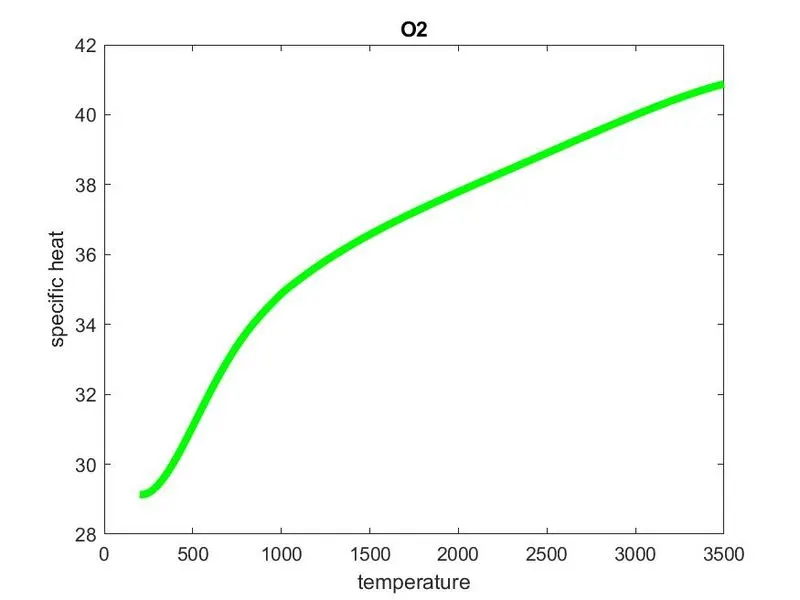
PLots of O2
1)enthalpy
2)entropy -
3)specific heat-
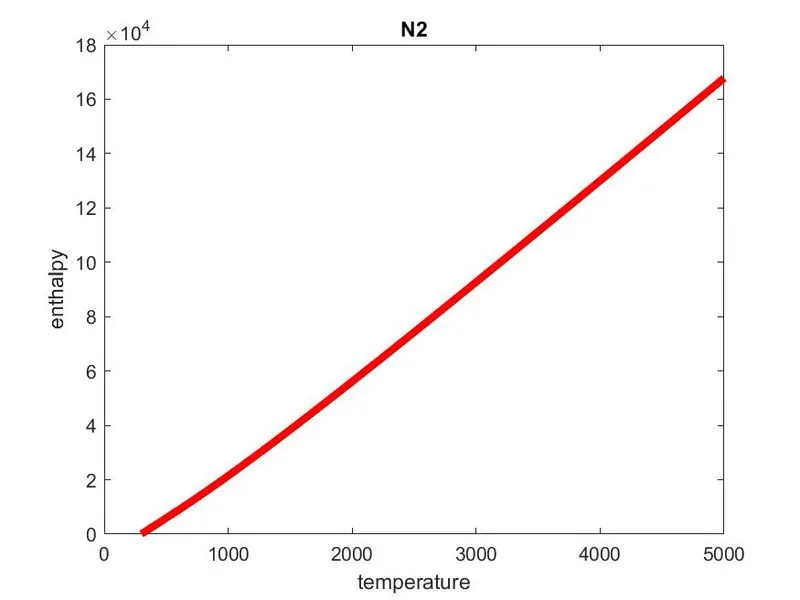
plots opf N2-
1)enthalpy
2)entropy-
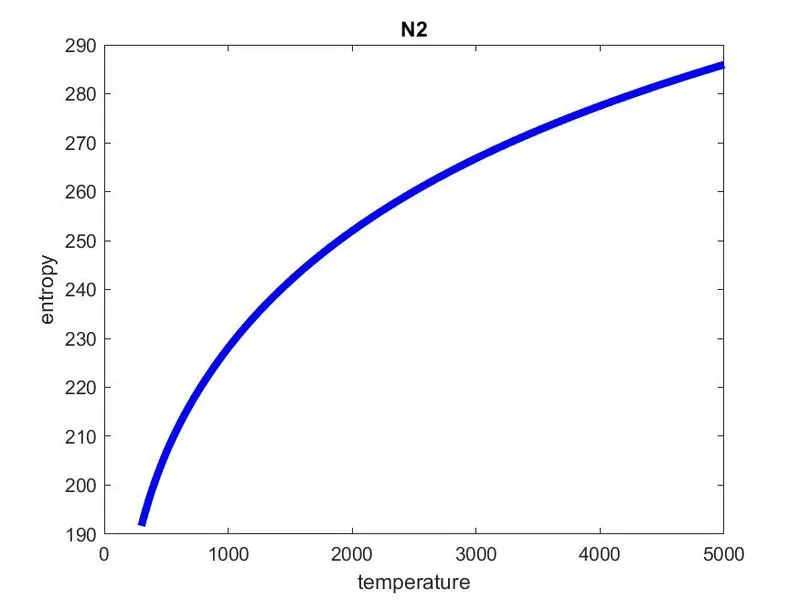
3)specific heat-
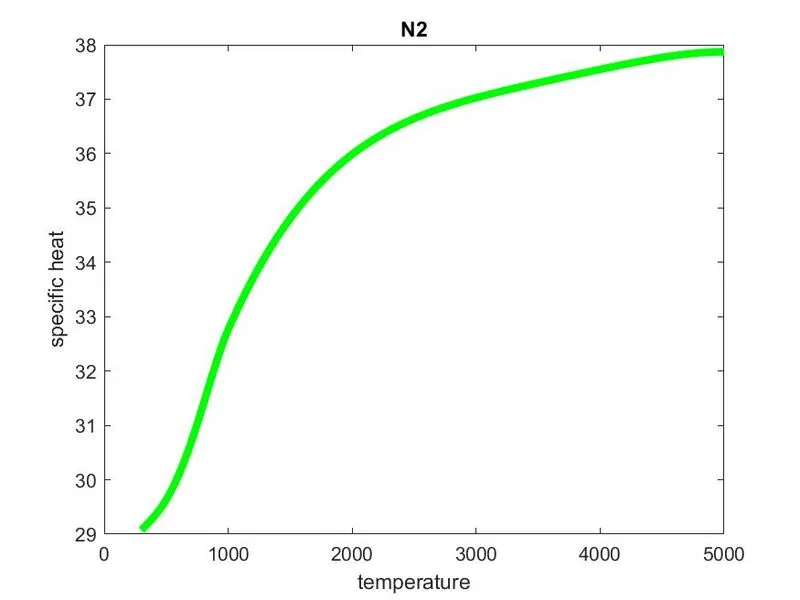
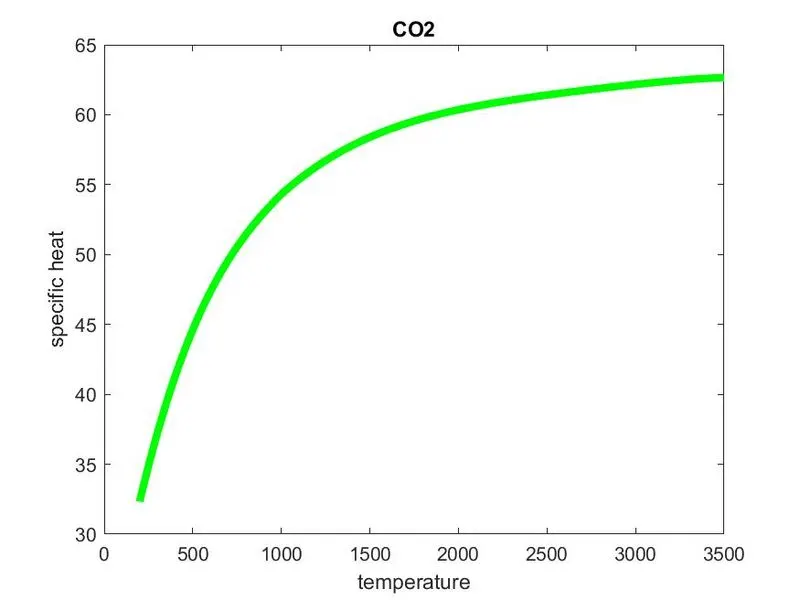
plots of co2-
1)enthalpy-
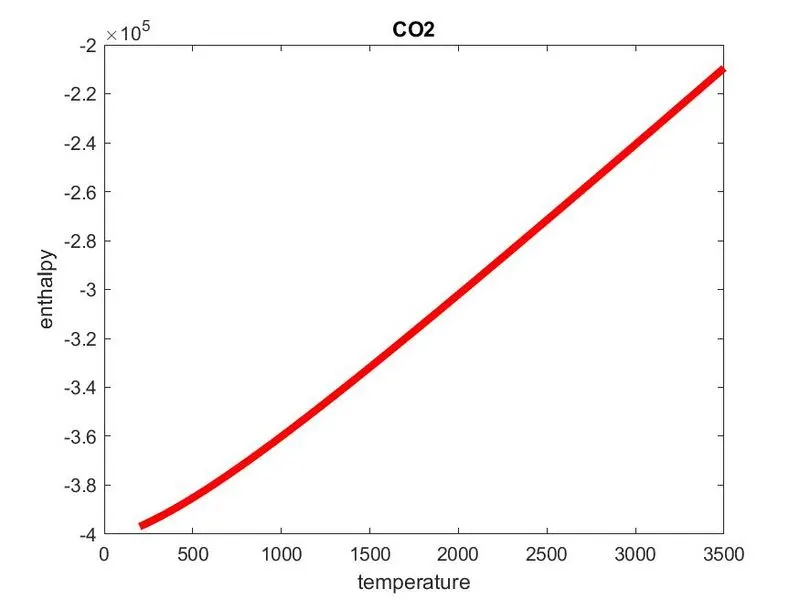
2)entropy-
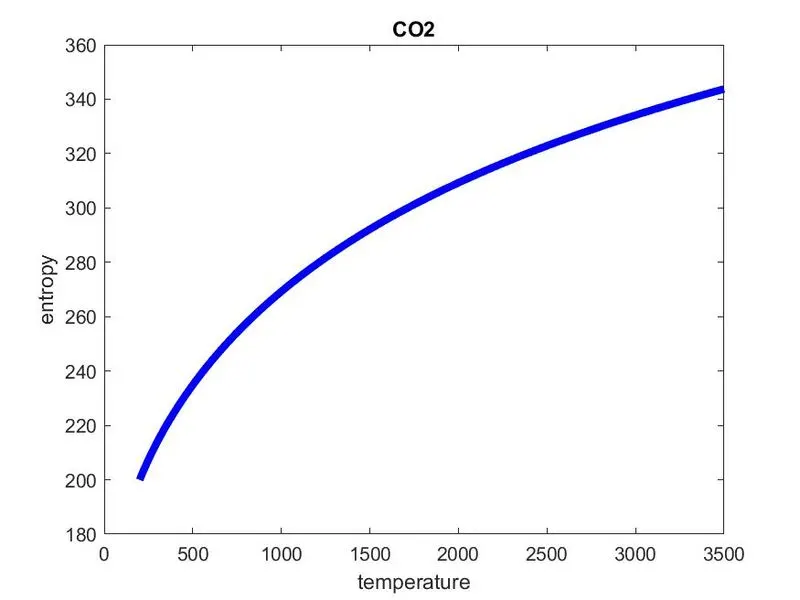
3)specific heat-
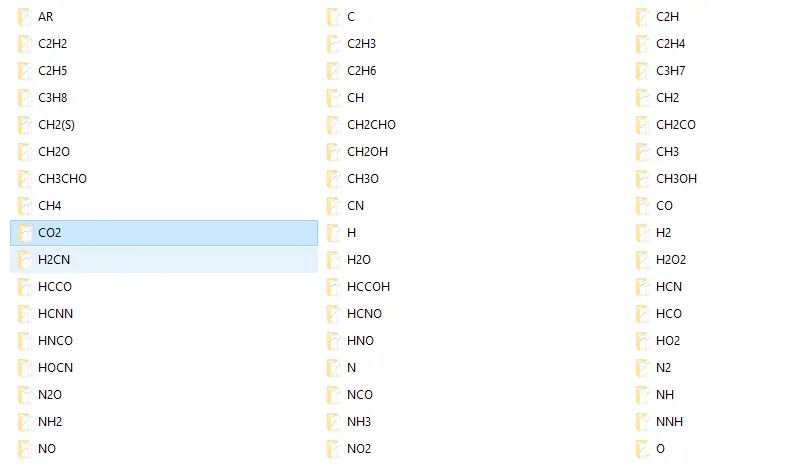
screenshot of saved file-
molecular weight calculation-
errors faced while program-
Not defining co-efficents properly which led to error in plots.
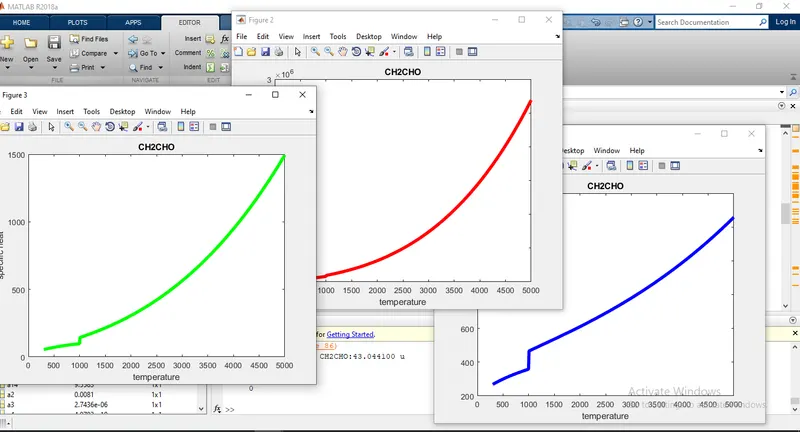
how did i solve the errors-
By giving proper value to the whole coefficents.
online material used for help
- matlab search bar