Project 1 - Parsing NASA thermodynamic data
AIM :
Write a code in MATLAB parse NASA Thermodyanmic data file and thermodyanmic properties of various gas propreties
OBJECTIVES :
1. Write a function that extracts the 14 co-efficients and calculates the enthalpy, entropy and specific heats for all the species in the data file. You will be reading this file NASA thermodynamic data(Tip: use fopen and fgetl). The formulae are shown below.
Here R is the universal gas constant, T is the temeprature
The FIRST 7 coefficients are HIGH-temperature coefficients and the SECOND 7 coefficients are LOW-temperature coefficients.
Also use the LOCAL TEMPERATURE RANGES which is unique for each individual species, not the GLOBAL TEMPERATURE RANGE.
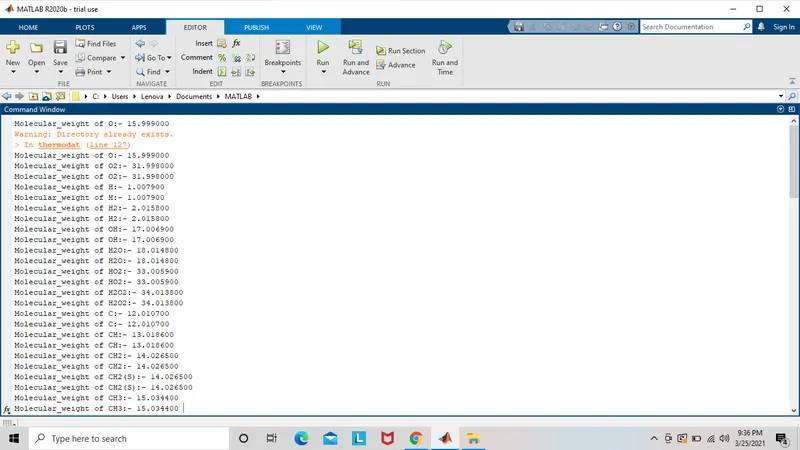
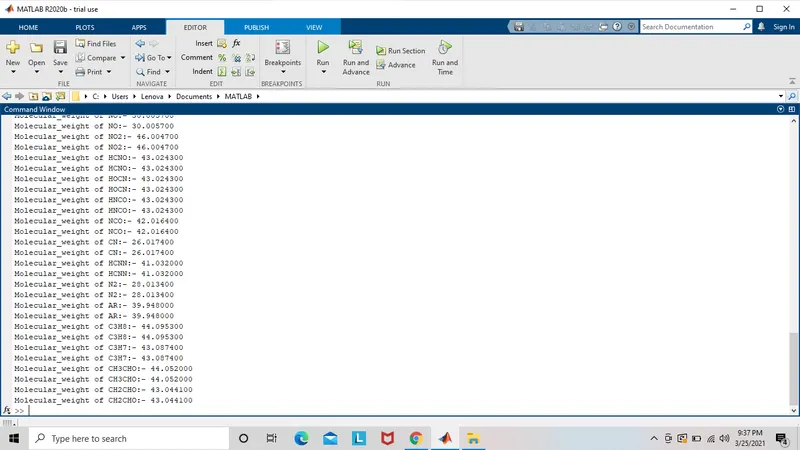
2. Calculate the molecular weight of each species and display it in the command window.
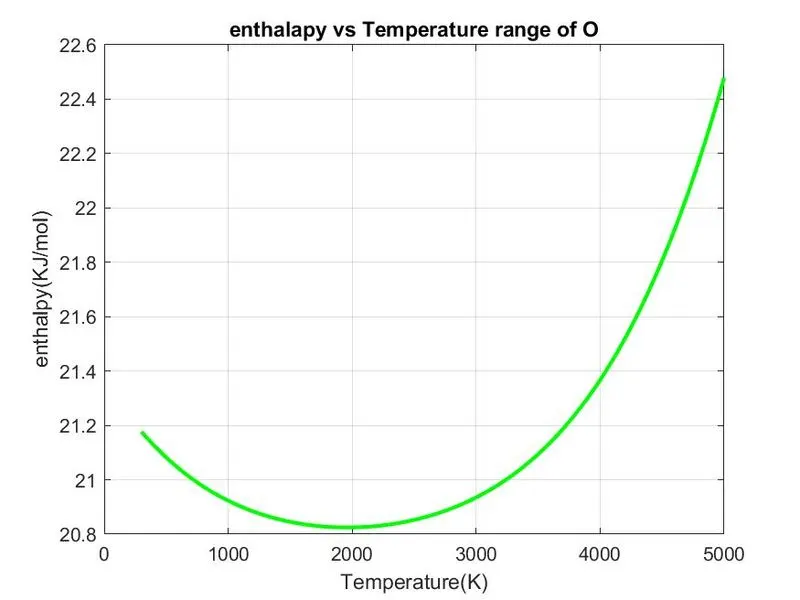
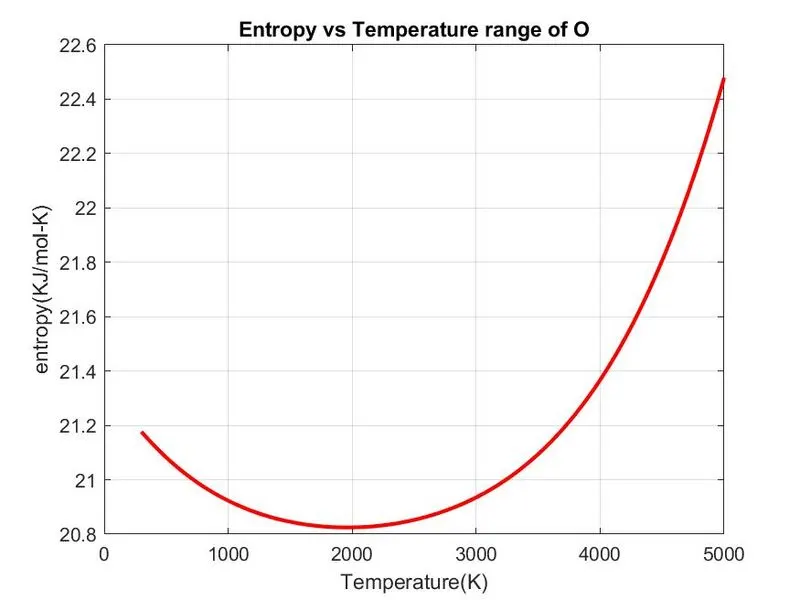
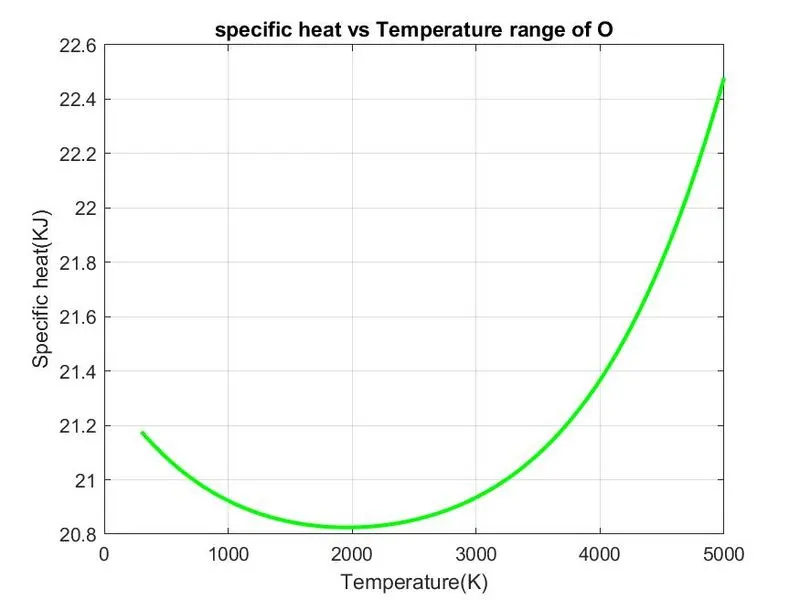
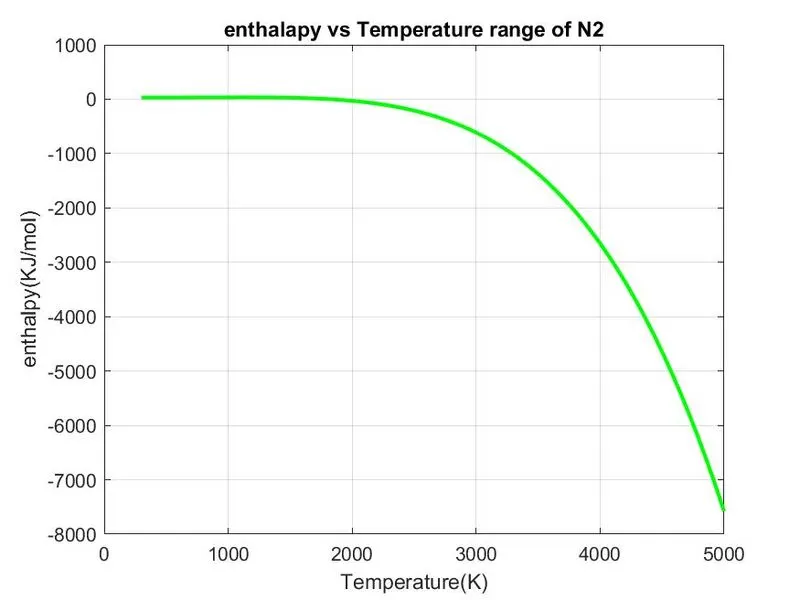
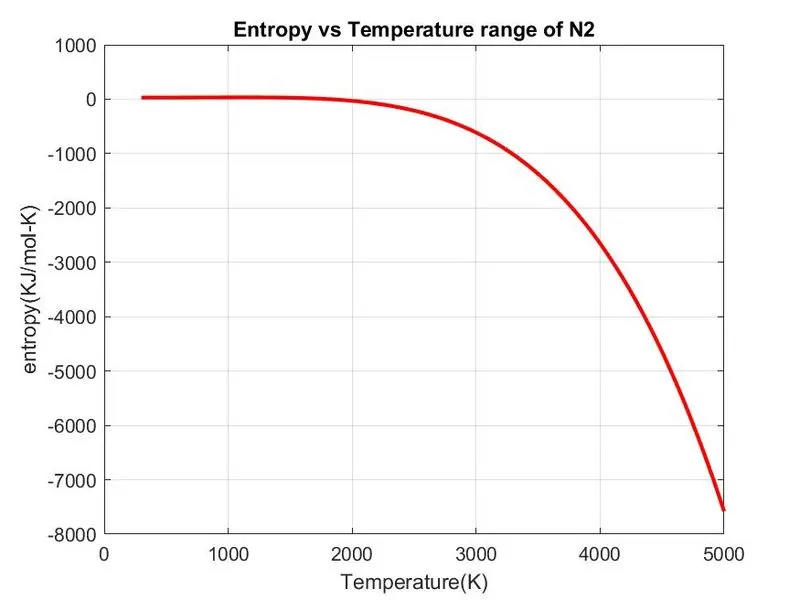
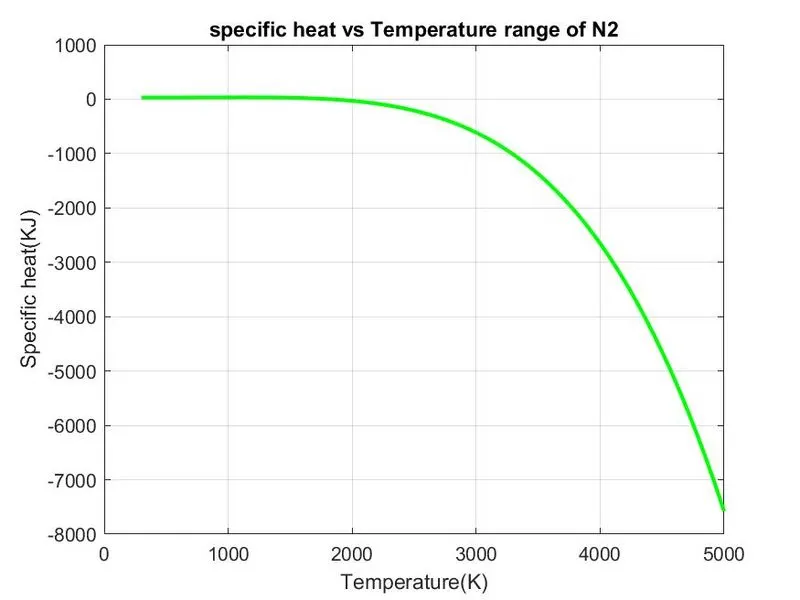
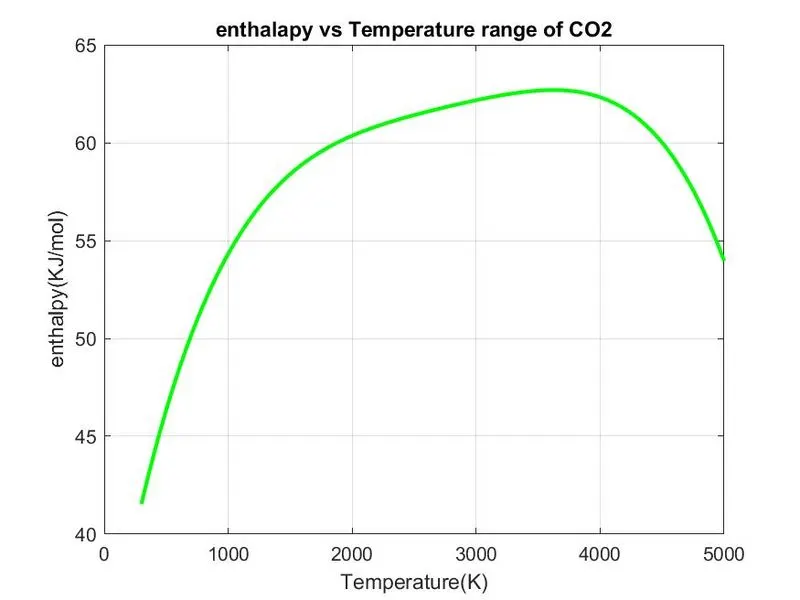
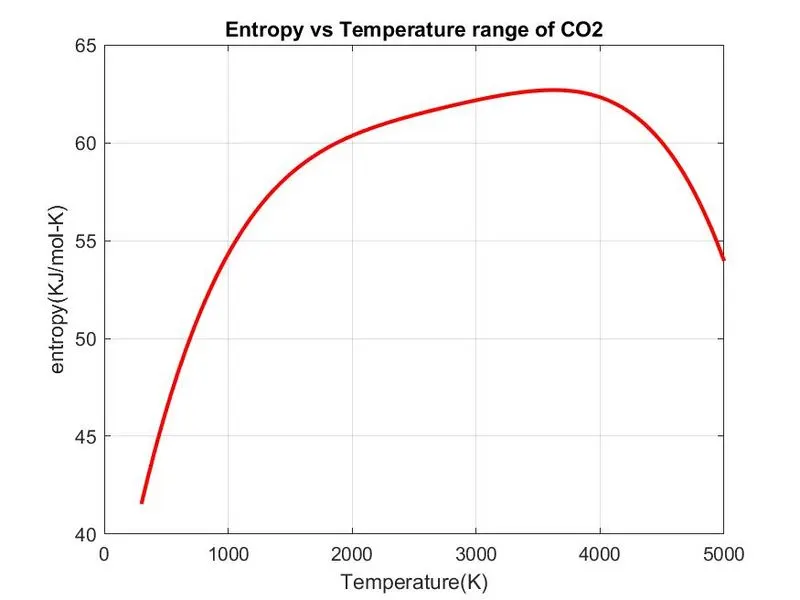
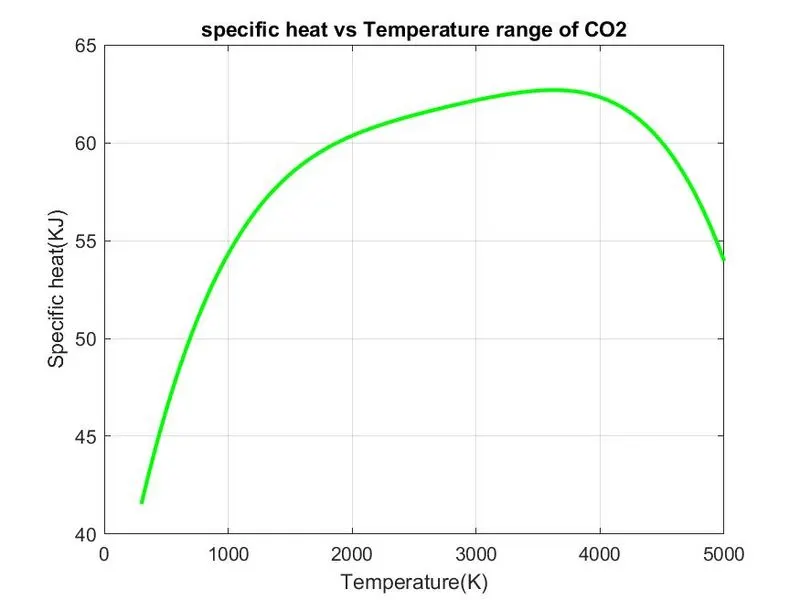
3. Plot the Cp, Enthalpy and Entropy for the local temperature range (low temperature : high temperature) specific for each species.
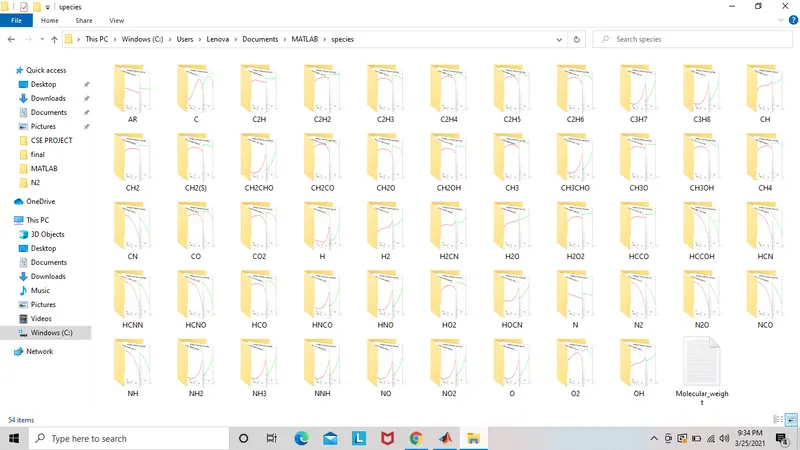
4. Save the plots as images with appropriate names and dump them in separate folders for each species with suitable name. All these should be generated automatically.
5. The main program that you will submit will just take the "THERMO.dat" file as an input and generate Cp, H and S plots.
6. Please write a detailed report to describe your logic.
Attachments needed:
- Screenshot of the window where all the folders are saved.
- Plots for o2, N2 and Co2 species (your program should be case insensitive, if it is going to take the species name as an input).
FILE PRASING :
Parsing, syntax analysis, or syntactic analysis is the process of analyzing a String and symbols either in netural languages , computer languages and traditonal languages
NASA THERODYAMIC FILE :
dat file is a data file containing 14 coefficients for 53 different elements given by NASA. These coefficients are utilized to calculate the specific heat, enthalpy & entropy for a particular element. Each element has its own range of local temperature
R is the universal gas constant, T is the temeprature
CP = specific heat
S = entropy
H = Enthalpy
clear all
close all
clc

%input
R = 8.314;

%OPEN data file and reading THERMO.dat file

f1 = fopen('THERMO.dat','r');

get = fgetl(f1);

% Temp reading

temp =fgetl(f1);

%spiltting

s = strsplit(temp);

% covert strings cells into numbers

templow = str2num(s{2});
tempmid = str2num(s{3});
temphigh = str2num(s{4});


%Temp range

T = linspace(templow,temphigh,1000);

%Skipping comment lines

for i = 1:3
    get = fgetl(f1);
end

% Reading species

for j = 1 :53
    tline=fgetl(f1);


    % spiltting into cell array
    A = strsplit(tline, ' ');
    species = (A{1});
     % CONVERTING  string into number

templow = str2num(A{end-3});
tempmid = str2num(A{end-2});
temphigh = str2num(A{end-1});

% next line and find E

tline1 = fgetl(f1);
a = strfind(tline1,'E');

% Finding  higer co efficient

a1 = tline1(1:a(1)+3);
a1 = str2num(a1);

a2 = tline1(a(1)+4:a(2)+3);
a2 = str2num(a2);
a3 = tline1(a(2)+4:a(3)+3);
a3 = str2num(a3);
a4 = tline1(a(3)+4:a(4)+3);
a4 = str2num(a4);
a5 = tline1(a(4)+4:a(5)+3);
a5 = str2num(a5);

tline2 = fgetl(f1);
b = strfind(tline2,'E');
a6 = tline2(1:b(1)+3);
a6 = str2num(a6);
a7 = tline2(b(1)+4:b(2)+3);
a7 = str2num(a7);


%  finding lower co efficient

a8 = tline2(b(2)+4:b(3)+3);
a8 = str2num(a8);
a9 = tline2(b(3)+4:b(4)+3);
a9 = str2num(a9);
a10 = tline2(b(4)+4:b(5)+3);
a10 = str2num(a10);

tline3 = fgetl(f1);
c = strfind(tline3,'E');
a11 = tline3(1:c(1)+3);
a11 = str2num(a11);
a12 = tline3(c(1)+4:c(2)+3);
a12 = str2num(a12);
a13 = tline3(c(2)+4:c(3)+3);
a13 = str2num(a13);
a14 = tline3(c(3)+4:c(4)+3);
a14 = str2num(a14);


% calculate specific heat

cp = specific_heat(a1,a2,a3,a4,a5,a8,a9,a10,a11,a12,T,R,tempmid);

% calculate entropy

S = entropy(a1,a2,a3,a4,a5,a7,a8,a9,a10,a11,a12,a14,T,R,tempmid);

% calculate enthalpy
H = enthalpy(a1,a2,a3,a4,a5,a7,a8,a9,a10,a11,a12,a14,T,R,tempmid);

% caLCULATE molecular weight of species

W = molecular_weight(species);


% writting molecular weight file
MW_file = fopen('Molecular_weight.txt','w');
fprintf(MW_file,'Molecular_weight of %s is %d ',species,W);
fclose(MW_file);

%saving in folder
 %changing directory
 cd('C:\Users\Lenova\Documents\MATLAB\Species')
 mkdir(species);
 cd(species);

 %plot 1 cp vs T
 figure(1)
 plot(T,cp,'linewidth',2,'color','g');
 xlabel('Temperature(K)');
 ylabel('Specific heat(KJ)');
 title(sprintf('specific heat vs Temperature range of %s',species));
 grid on
 saveas(figure(1),'specific heat.jpg');

  %plot 2 S vs T
 figure(1)
 plot(T,cp,'linewidth',2,'color','r');
 xlabel('Temperature(K)');
 ylabel('entropy(KJ/mol-K)');
 title(sprintf('Entropy vs Temperature range of %s',species));
 grid on
 saveas(figure(1),'Entropy.jpg');


  %plot 3 ENTHALPY vs T
 figure(1)
 plot(T,cp,'linewidth',2,'color','G');
 xlabel('Temperature(K)');
 ylabel('enthalpy(KJ/mol)');
 title(sprintf('enthalapy vs Temperature range of %s',species));
 grid on
 saveas(figure(1),'enthalapy.jpg');

 cd('C:\Users\Lenova\Documents\MATLAB')

 %Molecular weight

 W = molecular_weight(species);

end


% specific heat function
function cp = specific_heat (a1,a2,a3,a4,a5,a8,a9,a10,a11,a12,T,R,tempmid);

%calculating specific heat for  higer and lower temperatures

if (T <=tempmid)
    cp = R*(a8 + (a9*T) +(a10*(T).^2)+(a11*(T).^3)+ (a12*(T).^4));
else

    cp = R*(a1 + (a2*T) +(a3*(T).^2)+(a4*(T).^3)+ (a5*(T).^4));
end
end


% entropy

function S = entropy(a1,a2,a3,a4,a5,a7,a8,a9,a10,a11,a12,a14,T,R,tempmid);


if(T <=tempmid)

    S = R*(a8.*log(T) + (a9*T) +(a10*(T).^2/2)+(a11*(T).^3/3)+ (a12*(T).^4/4)+ a14);
else
    S = R*(a1.*log(T) + (a2*T) +(a3*(T).^2/2)+(a4*(T).^3/3)+ (a5*(T).^4/4)+ a7);
end
end


% enthalpy function
function H = enthalpy(a1,a2,a3,a4,a5,a6,a8,a9,a10,a11,a12,a13,T,R,tempmid);

if (T <=tempmid)

    H = R*T.*(a8+ ((a9*T)/2) +((a10*(T).^2)/3)+((a11*(T).^3)/4)+ ((a12*(T).^4)/5)+ ((a13./T)));
else
 H = R*T.*(a1+ ((a2*T)/2) +((a3*(T).^2)/3)+((a4*(T).^3)/4)+ ((a5*(T).^4)/5)+ ((a6./T)));

    end
end

% function molecular weight


function W = molecular_weight(species);

atomic_name = ['H','C','O','N','Ar'];

atomic_weight = [1.0079 12.0107 15.999 14.0067 39.948];
 W= 0;
for i = 1:length(species)
    for j = 1:length(atomic_name)
        if strcmp(species(i),atomic_name(j))
            W = W + atomic_weight(j);
            position = j;
        end
    end

    n = str2double(species(i));
    if n >1
        W = W + atomic_weight(position)*(n-1);
    end
end

fprintf('Molecular_weight of %s:- ',species);
fprintf('%f', W);
disp(' ')
end
Steps wise explanation :
- First we should enter the parameter R and open THERMO.dat file and reading fopen command
- while reading THERMO using fget command and temperature was split was strspilt command, then convert into cell array it looks numbers so we use str2num to find low , mid and hig temperatures.
- then assing the temperature using linespace command and to skip the command lines using fget command inside the loop
- Now we run 53 element in data by assinging in the fget command ,then spilt cell array in the species line and find the species name and convert the string into the number str2num command.
- then start the line , in oder find new line "E" we using strfind command to find the before and after the co efficients total of 14 co efficcients convert number from string
- Out are 7 co efficient are higher and 7 co efficient of lower temperature
- Now we will specify the functions of specific heat , entropy ,enthalpy functions to find 14 co effecient of lower and higher temperature, now we will specify the molecular weight
- no write the Molecular weight .txt file and fprintf to all molecular weight species and then close fclose command
- Now we will plot specific heat, enthalpy and entropy with different species of temperatureand save them in sacnf commands.
Function of cp, s ,h and W
% specific heat function
function cp = specific_heat (a1,a2,a3,a4,a5,a8,a9,a10,a11,a12,T,R,tempmid);

%calculating specific heat for  higer and lower temperatures

if (T <=tempmid)
    cp = R*(a8 + (a9*T) +(a10*(T).^2)+(a11*(T).^3)+ (a12*(T).^4));
else

    cp = R*(a1 + (a2*T) +(a3*(T).^2)+(a4*(T).^3)+ (a5*(T).^4));
end
end


% entropy

function S = entropy(a1,a2,a3,a4,a5,a7,a8,a9,a10,a11,a12,a14,T,R,tempmid);


if(T <=tempmid)

    S = R*(a8.*log(T) + (a9*T) +(a10*(T).^2/2)+(a11*(T).^3/3)+ (a12*(T).^4/4)+ a14);
else
    S = R*(a1.*log(T) + (a2*T) +(a3*(T).^2/2)+(a4*(T).^3/3)+ (a5*(T).^4/4)+ a7);
end
end


% enthalpy function
function H = enthalpy(a1,a2,a3,a4,a5,a6,a8,a9,a10,a11,a12,a13,T,R,tempmid);

if (T <=tempmid)

    H = R*T.*(a8+ ((a9*T)/2) +((a10*(T).^2)/3)+((a11*(T).^3)/4)+ ((a12*(T).^4)/5)+ ((a13./T)));
else
 H = R*T.*(a1+ ((a2*T)/2) +((a3*(T).^2)/3)+((a4*(T).^3)/4)+ ((a5*(T).^4)/5)+ ((a6./T)));

    end
end

% function molecular weight


function W = molecular_weight(species);

atomic_name = ['H','C','O','N','Ar'];

atomic_weight = [1.0079 12.0107 15.999 14.0067 39.948];
 W= 0;
for i = 1:length(species)
    for j = 1:length(atomic_name)
        if strcmp(species(i),atomic_name(j))
            W = W + atomic_weight(j);
            position = j;
        end
    end

    n = str2double(species(i));
    if n >1
        W = W + atomic_weight(position)*(n-1);
    end
end

fprintf('Molecular_weight of %s:- ',species);
fprintf('%f', W);
disp(' ')
end
Final Plots :
O2
PLOT OF N2 :
PLOT OF C02:
SCREENSHOT WHERE ALL SPECIES ARE SAVED :
OUTPUT OF MOELCULAR WEIGHT OF DIFFERENT SPECIES
here am maxmize the command window in MATLAB