Project 1 - Parsing NASA thermodynamic data
Aim:
(i) To write function that extracts the 14 co-efficients and calculates the enthalpy, entropy and specific heats for all the species in the data file.
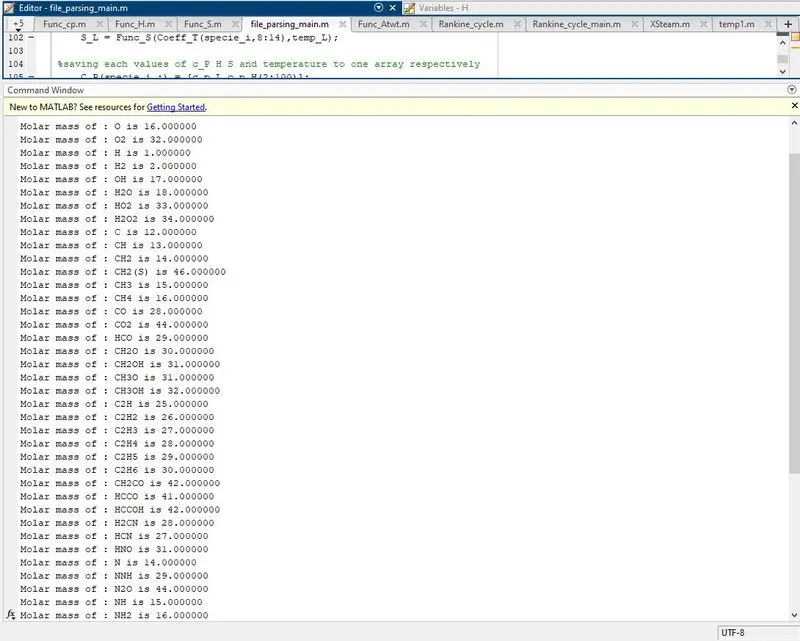
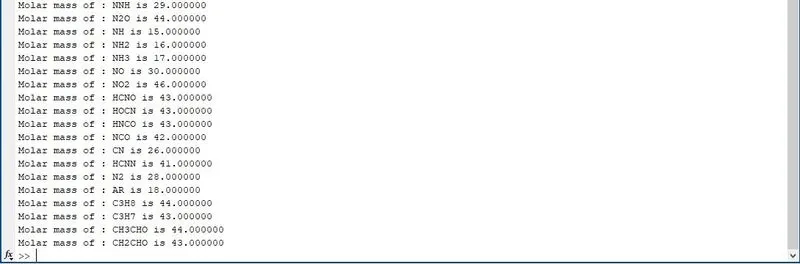
(ii) To calculate the molecular weight of each species and display it in the command window.
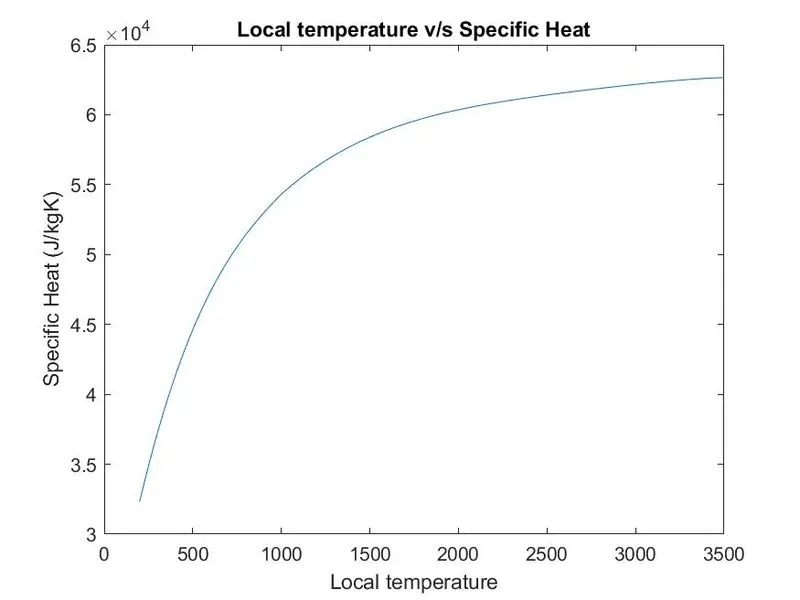
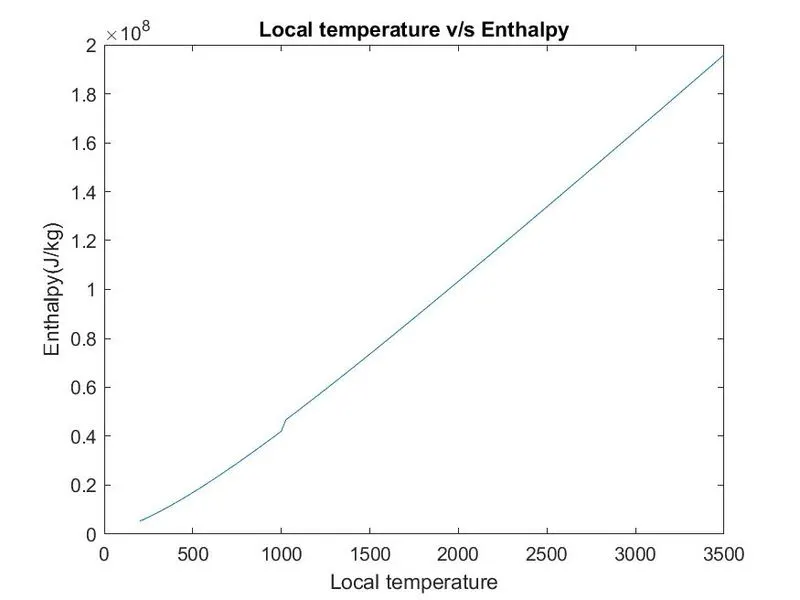
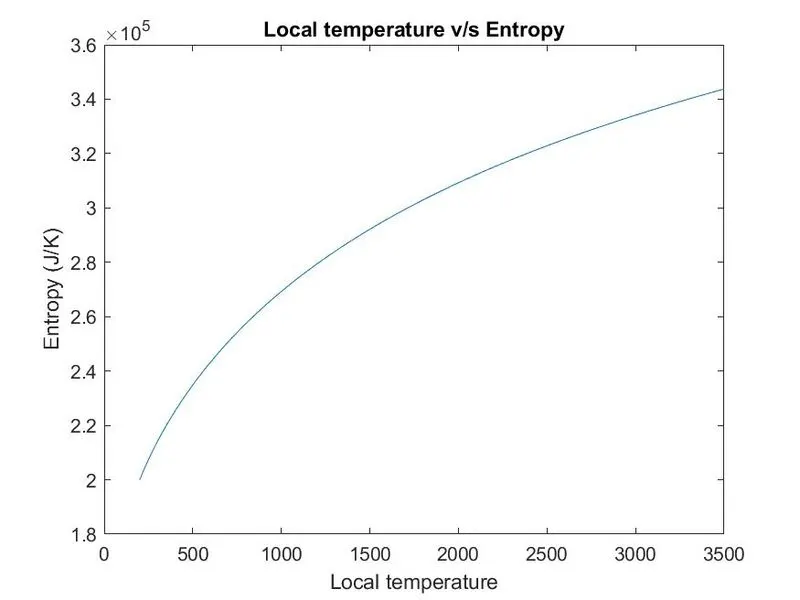
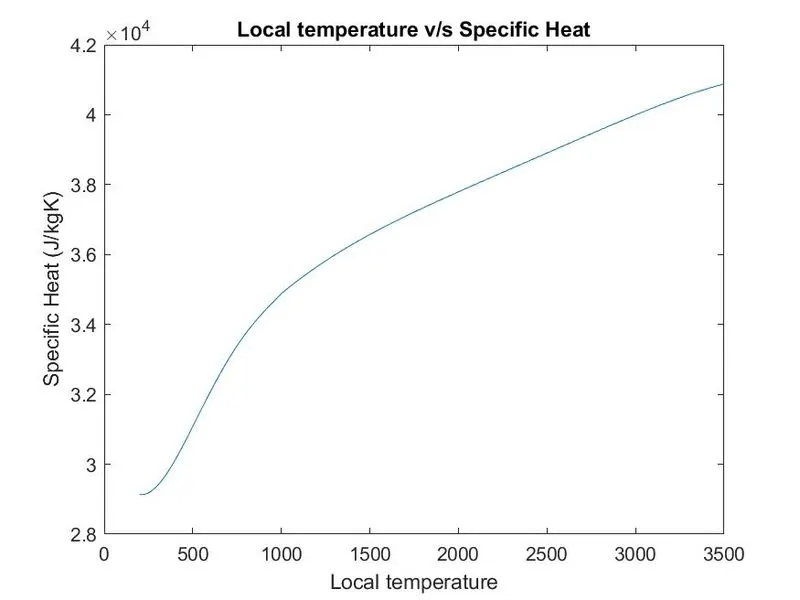
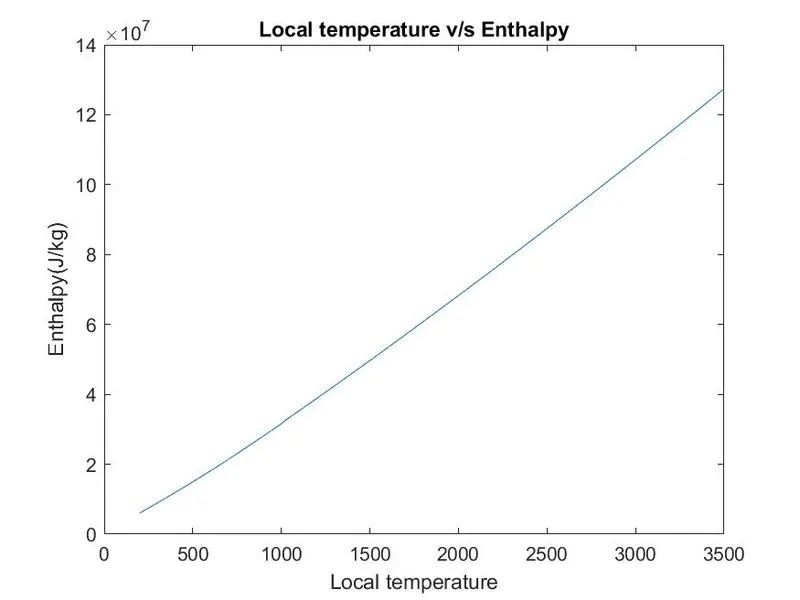
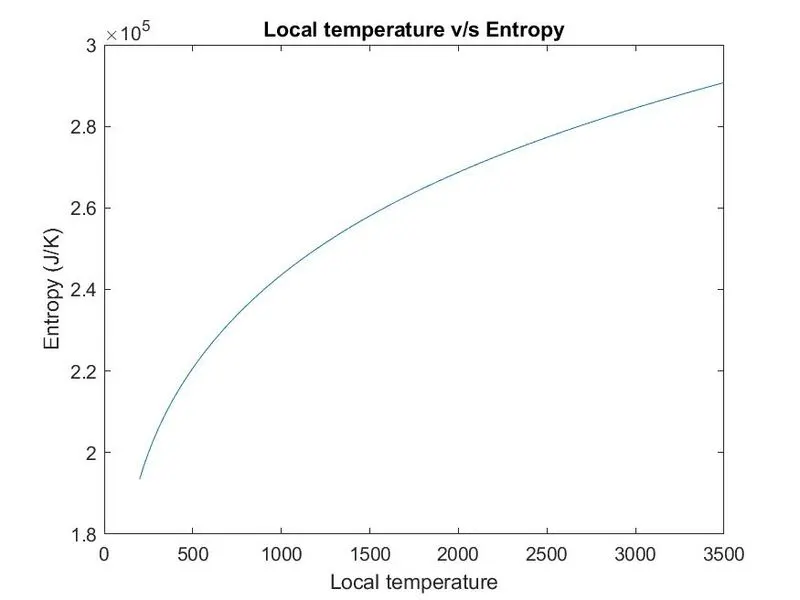
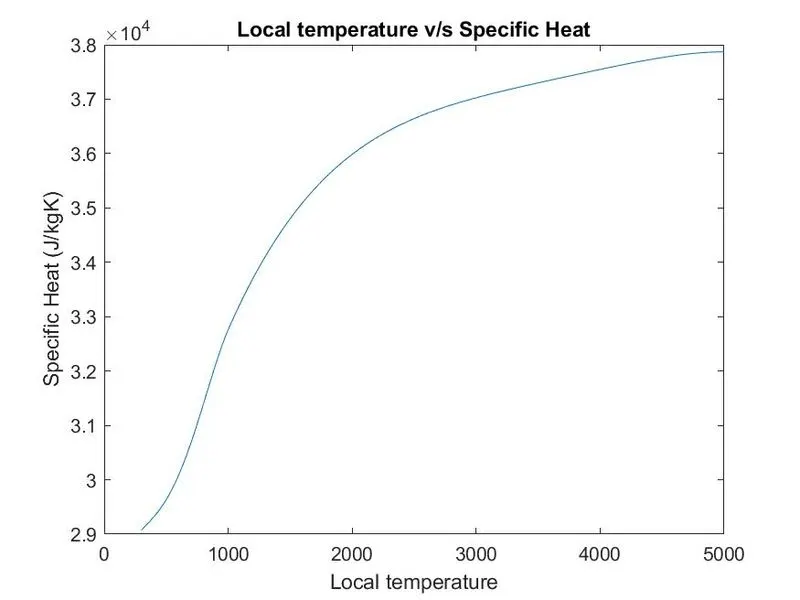
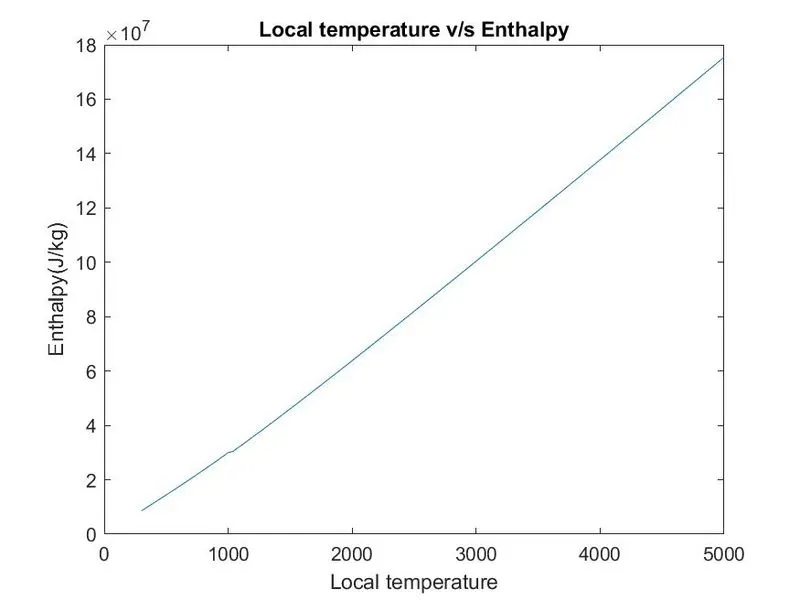
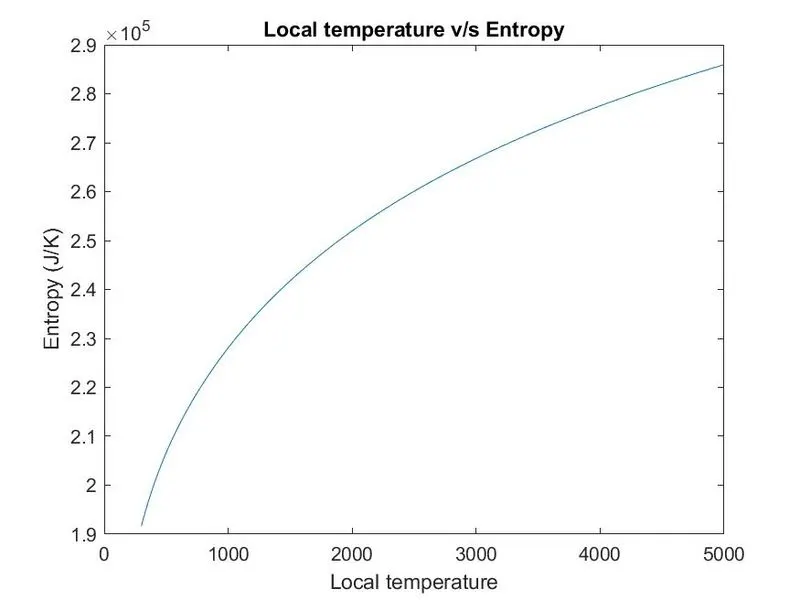
(iii) To plot the Cp, Enthalpy and Entropy for the local temperature range specific for each species.
Governing equations:
`c_p/R = a_1+a_2*T+a_3*T^2+a_4*T^3+a_5*T^4`
`H/(RT) = a_1+a_2*T/2+a_3*T^2/3+a_4*T^3/4+a_5*T^4/5+a_6/T`
`S/(R) = a_1*lnT+a_2*T+a_3*T^2/2+a_4*T^3/4+a_5*T^4+a_7`
Where,
T - Temperature
c_p - Specific heat of the compound
H - Enthalpy
S - Entropy
R - Universal gas constant
Main Code:
clear all
close all
clc

fid = fopen('THERMO.dat');
%To read the data file
Header_1 = fgetl(fid);
%Saving the global temperature to an array
temp_global_charach = fgetl(fid);
global_temperature = str2num(temp_global_charach);
%To read the header lines
Header_2 = fgetl(fid);
Header_3 = fgetl(fid);
Header_4 = fgetl(fid);

end_line = ('END');
n = 1;
a =1;
k_1 = ('1');
loc_temp = [];

for i = 1:inf
   t_line = fgetl(fid);
   %defining the end of the document
   k = strcmp(t_line,end_line);
   if k == 1
    break
   end
   %To define an array to save the first line of each species
   j = strsplit(t_line);

   if strcmp(j(length(j)),k_1) == 1
   coeff(a,1:length(j)) = strsplit(t_line);

   %To save the specie name to an array
   coeff_wt(a,1) = coeff(a,1);

   %To save the local temperature to an array
   local_temper_1 = str2double(j(length(j)-1));
   local_temper_2 = str2double(j(length(j)-2));
   local_temper_3 = str2double(j(length(j)-3));
   loc_temper_temp = [local_temper_1 local_temper_2 local_temper_3];
   loc_temp(a,:) = loc_temper_temp;
   a=a+1;

   else
       %Saving Coefficients
       d = strfind(t_line,'E');
       if length(d)==5
       %To save the line with five number of coefficients
       a_1 = str2num(t_line(1:d(1)+3));
       a_2 = str2num(t_line(d(1)+4:d(2)+3));
       a_3 = str2num(t_line(d(2)+4:d(3)+3));
       a_4 = str2num(t_line(d(3)+4:d(4)+3));
       a_5 = str2num(t_line(d(4)+4:d(5)+3));
       coeff_t(n,1:length(d)) = [a_1 a_2 a_3 a_4 a_5];
       else
        %To save the line with four number of coefficients
       a_1 = str2num(t_line(1:d(1)+3));
       a_2 = str2num(t_line(d(1)+4:d(2)+3));
       a_3 = str2num(t_line(d(2)+4:d(3)+3));
       a_4 = str2num(t_line(d(3)+4:d(4)+3));
       coeff_t(n,1:length(d)) = [a_1 a_2 a_3 a_4];

       end
        n = n+1;

   end

end

%transposing the coefficient matrix to save each coeff into single arrray
coeff_temp = coeff_t';
coeff_temp = coeff_temp(:)';


c=1;
n=1;
for coeff_value = 1:53
    for coeff_each_temp = 1:15
           Coeff_T(c,coeff_each_temp) = coeff_temp(1,n) ;
            n = n+1;
    end

    c = c+1;
end
%Calculation of each values c_p, Enthalpy and Entropy
y=1;
for specie_i = 1:53

    M_m = Func_Atwt(coeff_wt(specie_i)) ;
    Molar_mass = coeff(specie_i);

    temp_H = linspace(loc_temp(specie_i,1),loc_temp(specie_i,2),100);
    c_p_H = Func_cp(Coeff_T(specie_i,1:5),temp_H);
    H_H = Func_H(Coeff_T(specie_i,1:6),temp_H);
    S_H = Func_S(Coeff_T(specie_i,1:7),temp_H);

    temp_L = linspace(loc_temp(specie_i,3),loc_temp(specie_i,1),100);
    c_p_L = Func_cp(Coeff_T(specie_i,8:12),temp_L);
    H_L = Func_H(Coeff_T(specie_i,8:13),temp_L);
    S_L = Func_S(Coeff_T(specie_i,8:14),temp_L);

%saving each values of c_P H S and temperature to one array respectively
    C_P(specie_i,:) = [c_p_L c_p_H(2:100)];
    H(specie_i,:) = [H_L H_H(2:100)];
    S(specie_i,:) = [S_L S_H(2:100)];
    LOC_TEMP(specie_i,:) = [temp_L temp_H(2:100)];

figure(1)
plot(LOC_TEMP(specie_i,:),C_P(specie_i,:))
xlabel('Local temperature')
ylabel('Specific Heat (J/kgK)')
title('Local temperature v/s Specific Heat')
figure(2)
plot(LOC_TEMP(specie_i,:),H(specie_i,:))
xlabel('Local temperature')
ylabel('Enthalpy(J/kg)')
title('Local temperature v/s Enthalpy')
figure(3)
plot(LOC_TEMP(specie_i,:),S(specie_i,:))
xlabel('Local temperature')
ylabel('Entropy (J/K)')
title('Local temperature v/s Entropy')

mkdir (char(coeff(specie_i)))
cd (char(coeff(specie_i)));
saveas(figure(1),'Cp_vs_temp.jpg');
saveas(figure(2),'H_vs_temp.jpg');
saveas(figure(3),'S_vs_temp.jpg');
cd  ../
fprintf('Molar mass of : %s is %f \n',char(coeff(specie_i)),M_m)


end
Function to find specific heat:
function [c_p] = Func_cp(Coeff_T,temp);

R = 8314;
c_p =R*(Coeff_T(1,1)+ Coeff_T(1,2).*temp+...
    Coeff_T(1,3).*temp.^2+Coeff_T(1,4).*temp.^3+Coeff_T(1,5).*temp.^4);
end
Function enthalpy:
function [H] = Func_H(Coeff_T,temp);

R = 8314;
H = temp.*R.*((Coeff_T(1,1)+ Coeff_T(1,2).*temp/2+...
    Coeff_T(1,3).*(temp.^2)/3+Coeff_T(1,4).*(temp.^3)/4+Coeff_T(1,5).*(temp.^4)/5+Coeff_T(1,1)./temp));
end
Function to find entropy:
function [S] = Func_S(Coeff_T,temp);

R = 8314;
S =R*(Coeff_T(1,1).*log(temp)+ Coeff_T(1,2).*temp+...
    Coeff_T(1,3).*(temp.^2)/2+Coeff_T(1,4).*(temp.^3)/3+Coeff_T(1,5).*(temp.^4)/4+Coeff_T(1,7));
end
Function to find Atomic mass:
function [s] = Func_Atwt(coeff_wt)
str = coeff_wt;
d = char(str');
k = double(d);

m_wt_1 = 0;

for i = 1:length(k)

    switch k(i)
        case 67
            m_wt = 12;
        case 72
            m_wt = 1;
        case 78
            m_wt = 14;
        case 79
            m_wt = 16;
        case 83
             m_wt = 32;
        case 65
             m_wt = 9;
        case 82
            m_wt = 9;
    end

    if str2num(d(i))>1

    m_wt = m_wt_1(i)*(str2num(d(i))-1);

    end
       m_wt_1 = [m_wt_1,m_wt];


       m_wt = 0;

end
 s = sum(m_wt_1);
end- Initially the data file containing the coefficients is opened using 'fopen'
- Now the header files are saved as arrays and subsequently the global temperature is saved to another array.
- To stop the for loop a charachter array is defined with 'end_line'
- Loop compares each line with the end_line and runs till it encounters the line which contain 'END' this is enabled by the use of 'strcmpi'
- No if the line does not contain END then the loop runs and the line is split into cells and check the last cell if it is '1' then that whole of the array is saved to 'coeff' matrix
- and the first array containing the specie name is saved to a single row matrix also the local temperatures are saved to another matrix with each array containing the local temperature of each specie.
- If the last cell is other than '1' then also the string is split with a specified delimiter of a space and an if loop is defined to check if the array contain five or four coeff and the coefficients are saved to a matrix named 'coeff_t' as it is.
- Now this matrix is converted to another matrix with coefficients of each specie saved as single array in that matrix named 'Coeff_T'.
- Now we have mainly three matrix one coloumn matrix containing name of each specie, one matrix with local temperatures of all specie and one with coefficients of all species.
- The local temperature is divided into two parts the low temperature range and high temperature range and the coefficients are slected appropriately for all species and saved on to three different matrix
- Now, each variables to be calculated are defined as functions which return the values of the variables from the formula given for each temperatures.
- Function for calculation of atomic mass:
- Here, we visually observe for all of the component of species which are present in the data file and find the molar mass of each component.
- The numeric charachter for each componenet present in the data file is calculated is calculated and is found
- Now as we input the first array containing the name of the specie, as it is inputted it is converted to charachter string and is transposed to a coloumn matrix.
- The function double converts the symbolic charachters to numeric charachters and compares with the earlier defined value. This is facilitated by use of switch function for which each case is defined.
- if the comparison is true then it returns the atomic mass of that somponent
- This loop is run till it reach the end of the matrix containing the name of specie.
- If this loop encounters a numeric value such as 'H_2' then the atomic mass of the component to which the numeric components belong is multiplied with the numeric value.
- The values are all saved to an array and the sum is calculated to find the molar mass of each species.
- Thus this returns all the values of the molar mass of each species.
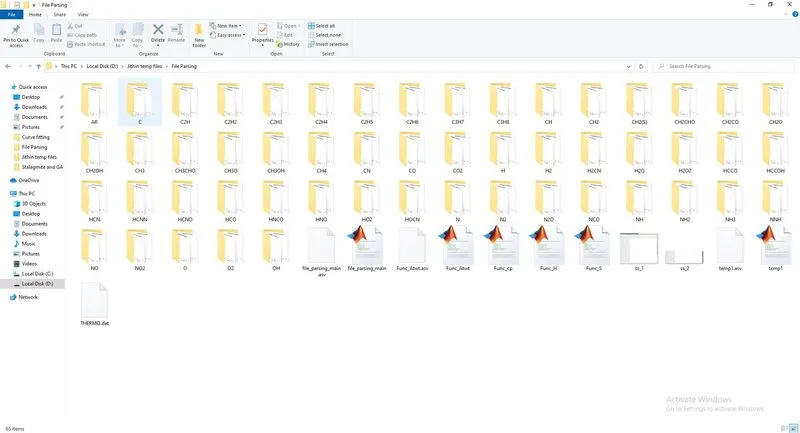
- To save the figure here we use 'mkdir' is used to create a folder with the specified name of the specie now each graph is plotted in different figures and saveas function is used to save that particular figure to the opened directory.
- fprintf used to display the molar mass of each species
Results:
Screen shot of the command window with molecular mass:
Screen shot of the subfolders with plots:
Plots of `O_2`
Plots of `N_2`:
Plots of `CO_2`: