Project 1 - Parsing NASA thermodynamic data
AIM:
To develop a code to parse the NASA thermodynamic data file to calculate thermodynamic properties of various gas species and obtain thermodynamic property plots along with molecular mass of the desired species.
INTRODUCTION:
Parsing: Parsing a file means reading in a data stream and building a memory model of the content of that data. This aims at facilitating perfoming some kind of transformation on the data. Parsing splits a file or other input into pieces of data that can be easily stored or manipulated.
DATA SOURCE:
NASA Thermodynamic data file
https://drive.google.com/file/d/1AikCHDlz9s_fu8whE81qee_GD4AyYpCP/view
The file contains co-efficients required to evaluate polynomials that can be used to evaluate thermodynamic properties such as Specific Heat(Cp), Enthalpy (h) and Entropy (S).
OBJECTIVES:
- To write a function that extracts the 14 coefficients and to calculate the enthalpy,entropy and specific heat for all the species in the data file.
- To calculate the molecular weight of each species.
- To plot the Cp,Enthalpy and Entropy for the local temperature range.
FORMULA USED:
Formula used to calculate the thermodynamic properties:

Main program:
clear all
close all
clc

thermo=fopen('THERMO.dat','r')


%global temperature range

fgetl(thermo);
gtr=fgetl(thermo)
gtr=strsplit(gtr,' ')
global_low_temperature=str2num(gtr{2})
global_mid_temperature=str2num(gtr{3})
global_high_temperature=str2num(gtr{4})
global_temperature_range=[global_low_temperature,global_mid_temperature,global_high_temperature]

for i=1:3
fgetl(thermo);
end


%taking species individually and finding the coefficient

ct=1;
while ~feof(thermo)

s1=fgetl(thermo)

if strcmpi(s1,'END')~=1
s1=strsplit(s1,' ');

species_name=s1{1}


%finding molecular weight

mw=molecular_weight(species_name)
fprintf('The molecular weight of %s is %d.\n',species_name,mw)


%local temperature range

l1=str2double(s1{end-3});
l2=str2double(s1{end-1});
l3=str2double(s1{end-2});


%extracting coefficient

coeff_1=fgetl(thermo);
e=findstr(coeff_1,'E');
a1=str2double(coeff_1(1:e(1)+3));
a2=str2double(coeff_1(e(1)+4:e(2)+3));
a3=str2double(coeff_1(e(2)+4:e(3)+3));
a4=str2double(coeff_1(e(3)+4:e(4)+3));
a5=str2double(coeff_1(e(4)+4:e(5)+3));

coeff_1=fgetl(thermo);
e=findstr(coeff_1,'E');
a6=str2double(coeff_1(1:e(1)+3));
a7=str2double(coeff_1(e(1)+4:e(2)+3));
a8=str2double(coeff_1(e(2)+4:e(3)+3));
a9=str2double(coeff_1(e(3)+4:e(4)+3));
a10=str2double(coeff_1(e(4)+4:e(5)+3));

coeff_1=fgetl(thermo);
e=findstr(coeff_1,'E');
a11=str2double(coeff_1(1:e(1)+3));
a12=str2double(coeff_1(e(1)+4:e(2)+3));
a13=str2double(coeff_1(e(2)+4:e(3)+3));
a14=str2double(coeff_1(e(3)+4:e(4)+3));


%calculating the values for cp, s, and h

t=linspace(l1,l3,100);
[cp,h,s]=thermos3(a1,a2,a3,a4,a5,a6,a7,a8,a9,a10,a11,a12,a13,a14,l1,l2,l3);


%creating a new directory to save the plots

status=mkdir('D:\specific heat, enthalpy, entropy plots')
cd ('D:\specific heat, enthalpy, entropy plots')


%plotting and saving it as a jpeg file in the new directory

figure(1)
plot(t,cp)
xlabel('Temperature')
ylabel('Specific heat')
title(species_name)
filename=sprintf('specific heat of %s.jpg',species_name);
saveas(1,filename,'jpeg')

figure(2)
plot(t,h)
xlabel('Temperature')
ylabel('Enthalpy')
title(species_name)
filename=sprintf('enthalpy of %s.jpg',species_name);
saveas(2,filename,'jpeg')

figure(3)
plot(t,s)
xlabel('Temperature')
ylabel('Entropy')
title(species_name)
filename=sprintf('entropy of %s.jpg',species_name);
saveas(3,filename,'jpeg')


ct=ct+1;
else
    break
end

end
FUNCTION FOR MOLECULAR WEIGHT:
%function to calculate the molecular weight

function mw=molecular_weight(species_name)
atom=['H','C','N','O','A','S']
weight=[1,12,14,16,40,32]
mw=0;

for i=1:length(species_name)
    for j=1:length(atom)
        if strcmpi(species_name(i),atom(j))
        mw=mw+weight(j)
        pos=j
        end
    end
n=str2num(species_name(i))
if n>1
mw=mw+weight(pos)*(n-1)

end

end

end
FUNCTION FOR ENTHALPY,ENTROPY AND SPECIFIC HEAT:
%function to calculate enthalpy, entropy and specific heat

function [cp,h,s]=thermos3(a1,a2,a3,a4,a5,a6,a7,a8,a9,a10,a11,a12,a13,a14,t1,t2,t3)
r=8.3145;
t=linspace(t1,t3,100);

     for i=1:length(t)

         if t(i)>t2
             %for the first 7 coefficient with high temperature
         cp(i)=(a1+(a2.*t(i))+(a3.*t(i).^2)+(a4.*t(i).^3)+(a5.*t(i).^4))*r;
         h(i)=(a1+(a2.*t(i)./2)+(a3.*(t(i).^2)./3)+(a4.*(t(i).^3)./4)+(a5.*(t(i).^4)./5)+(a6./t(i)))*r;
         s(i)=(a1.*log(t(i))+(a2.*t(i))+(a3.*(t(i)^2)./2)+(a4.*(t(i)^3)./3)+(a5.*(t(i)^4)./4)+a7)*r;
         else
             %for the second 7 coefficient with low temperature
         cp(i)=(a8+(a9.*t(i))+(a10.*t(i)^2)+(a11.*t(i).^3)+(a12.*t(i).^4))*r;
         h(i)=(a8+(a9.*t(i)./2)+(a10.*(t(i).^2)./3)+(a11.*(t(i).^3)./4)+(a12.*(t(i).^4)./5)+(a13./t(i)))*r;
         s(i)=(a8.*log(t(i))+(a9.*t(i))+(a10.*(t(i)^2)./2)+(a11.*(t(i)^3)./3)+(a12.*(t(i)^4)./4)+a14)*r;
         end
     end
end
OUTPUT:
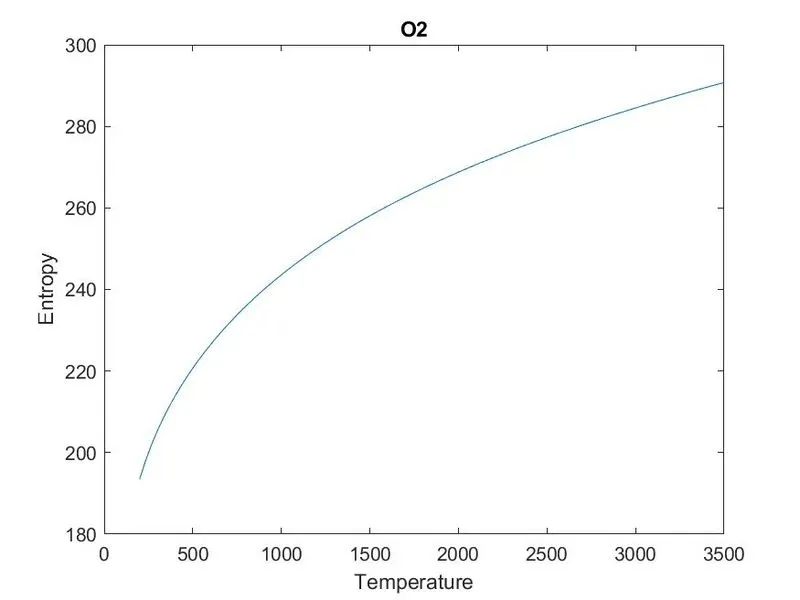
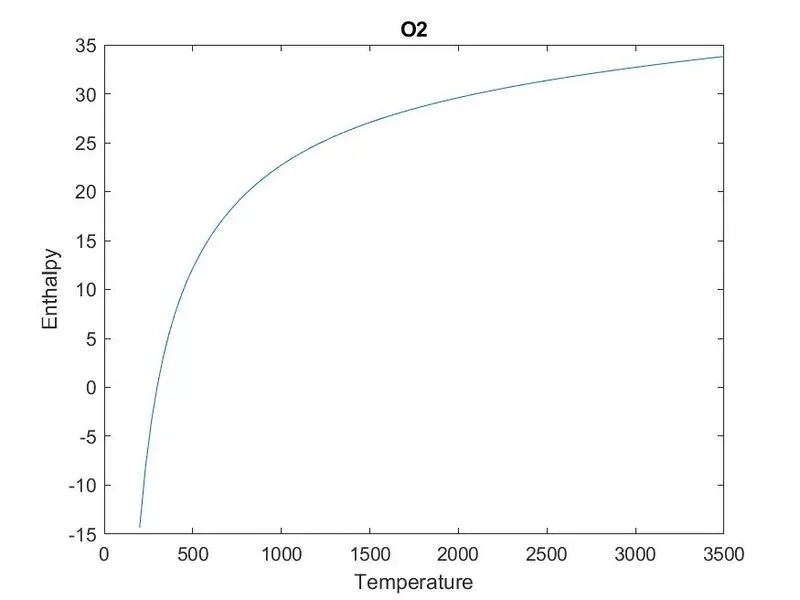
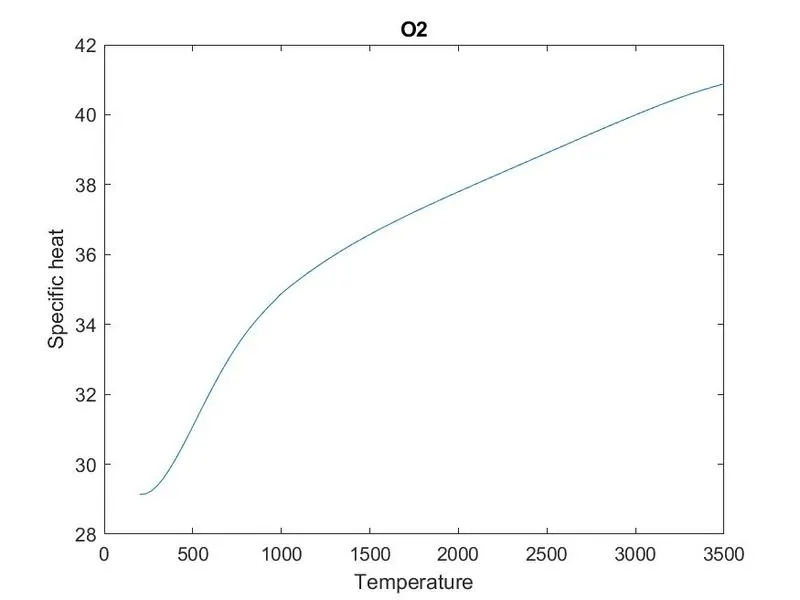
PLOT O2:
ENTROPY OF O2:
ENTHALPY OF O2:
SPECIFIC HEAT OF O2:
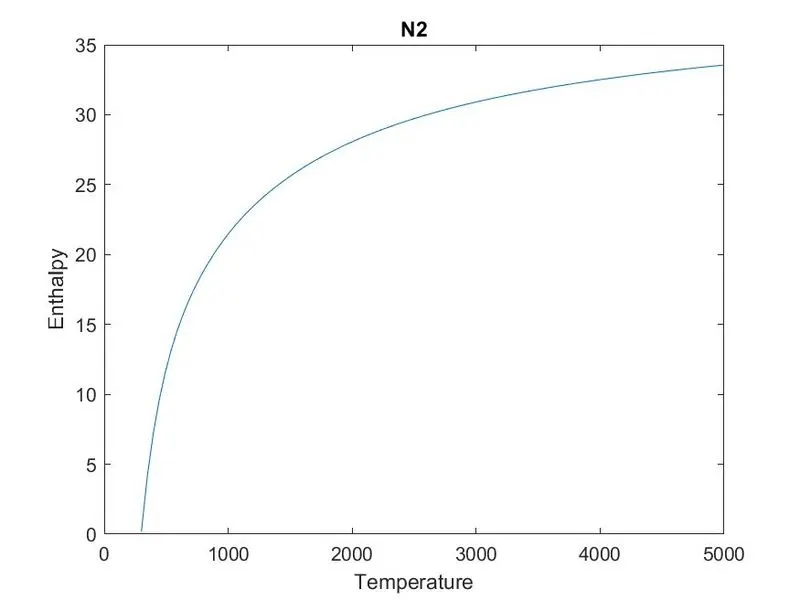
PLOT N2:
ENTHALPY OF O2:
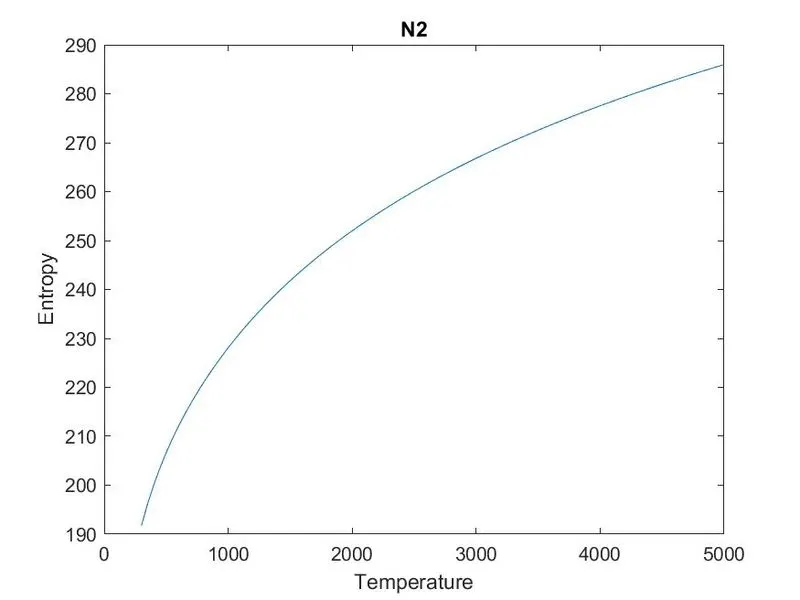
ENTROPY OF O2:
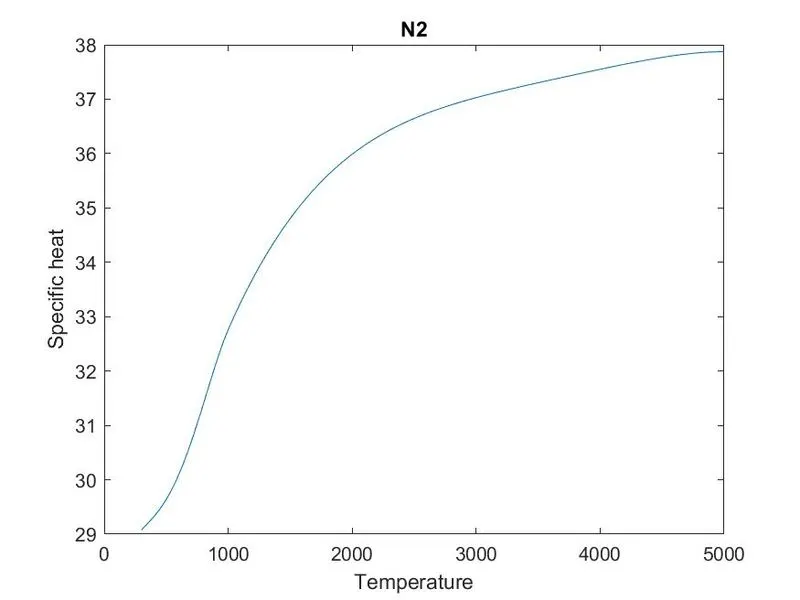
SPECIFIC HEAT OF N2:
PLOT CO2:
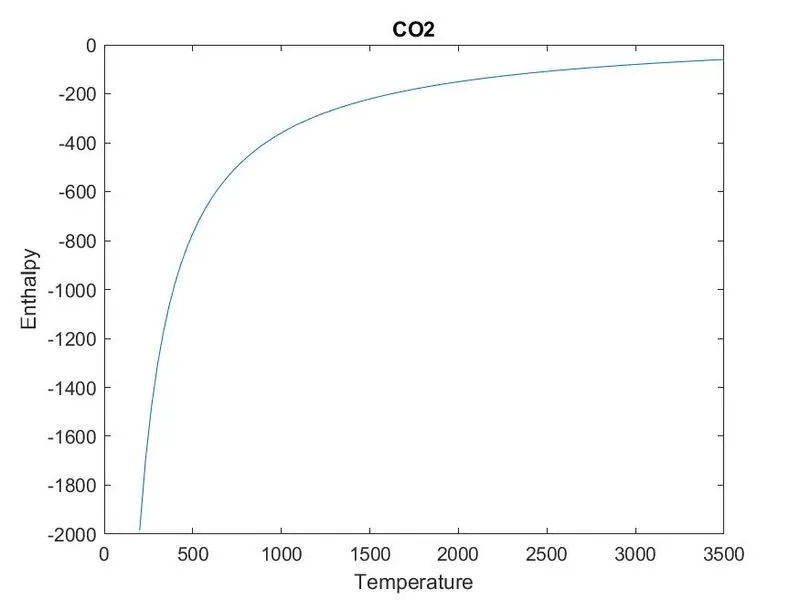
ENTHALPY OF CO2:
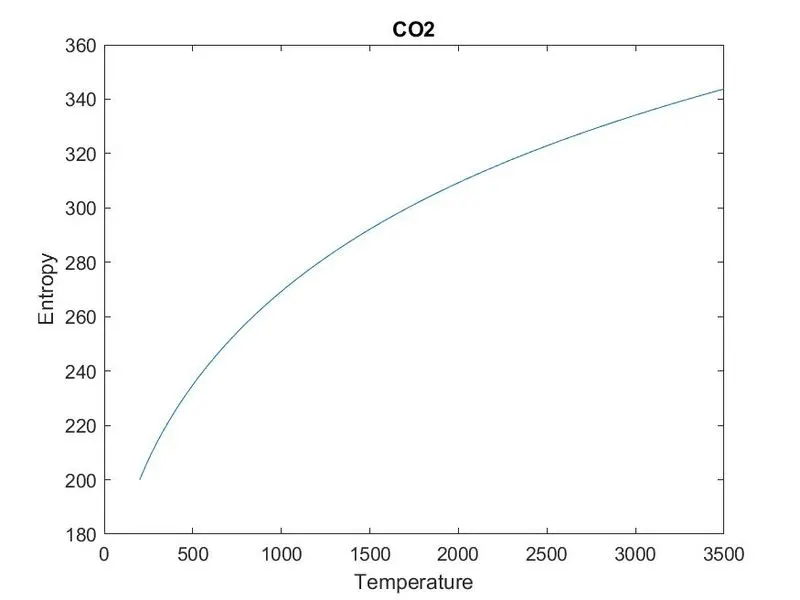
ENTROPY OF CO2:
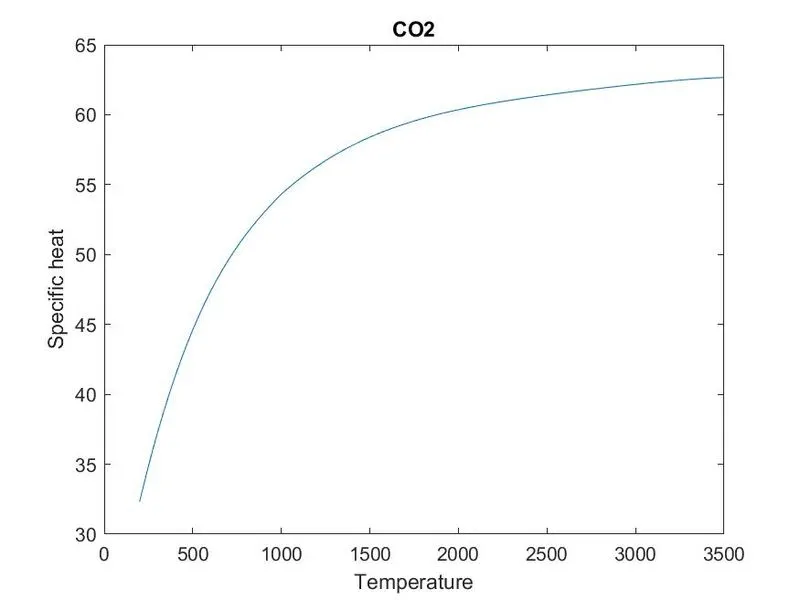
SPECIFIC HEAT OF CO2:
PROGRAM EXPLANATION:
- Initially the given data file is read with help of fopen command with reading function. Then successive lines in the data file is extracted for global temperature range using fgetl command.
- The desired input from the user is stored as a string.
- The input string is then compared with the molecule available in data file using strcmp. If a match is obtained, respective coefficients are extracted from the data file usinf fgetl command. Different co-efficients in a particular line is sorted out by specifyinng the place in that line. Similarly the local temperature range for the input molecule is also extracted from the data file.
- inorder to get the molecular weight, the function for calculating the molecular weight is called and stored to a variable and is displayed.
- Now, for the thermodynamic propety values ( Cp, S, h) , the associated functions are called.
- mkdir command is then used inorder to create a directory to store the ouput figures.
- Now from the different thermodynamic property values, associated Cp v T, S v T and h v T plots are created.
- Current folder is defined where the figure should be stored and saveas command is used to store the figure to that particular folder created.
- current folder is again defined to make the directory back to parent folder and all the open files are closed with fclose command.
Understanding the Functions
1) Molecular Weight
- A character array is defined for the atoms and array of atomic weights respective to character array is defined.
- The input string is compared with character array, when a match occurs, associated atomic weight is taken.
- For molecules having numbers defining the number of atoms, that number is first extracted, and calculation is made to account for multiple atomic weights.
- a variable is assigned to store the output value of the function.
2)Enthalpy, Entropy and Specific Heat
- Since the coefficients available in data file is having a temperature constraint, an if condition is used
- First 7 coefficients are high temperature coefficients and last 7 are low temperature coefficients, to calculate the thermodynamic property values, coefficents are selected with reference to temperature range.
CONCLUSION:
On successful parsing of data from NASA's Thermodynamic Data file, variation of thermodynamic properties with temperature of certain species of molecules are observed with the help of plots obtained.
REFERENCES: