Project 1 - Parsing NASA thermodynamic data
function [cp, h, s]=coeff(a1,a2,a3,a4,a5,a6,a7,a8,a9,a10,a11,a12,a13,a14,T)
R=8.314;
for j=1:length(T)
if T(j)< 300
cp=(a1+a2.*T+a3.*T.^2+a4.*T.^3+a5.*T.^4).*R;
h=(a1+(a2.*T)./2+(a3.*T.^2)./3+(a4.*T.^3)./4+(a5.*T.^4)./5+(a6./T)).*R.*T;
s=(a1.*log(T)+a2.*T+(a3.*T.^2)./2+(a4.*T.^3)./3+(a5.*T.^4)./4+a7).*R;
else
cp=(a8+a9.*T+a10.*T.^2+a11.*T.^3+a12.*T.^4).*R;
h=(a8+(a9.*T)./2+(a10.*T.^2)./3+(a11.*T.^3)./4+(a12.*T.^4)./5+(a13./T)).*R.*T;
s=(a8.*log(T)+a9.*T+(a10.*T.^2)./2+(a11.*T.^3)./3+(a12.*T.^4)./4+a14).*R;
end
end
matlab main code:
clear all
close all
clc


%to determind the thermodynamic data file
f1=fopen('THERMO.dat','r');
for i=1:5
fgetl(f1);

end

for i=1:53
file_name=fgetl(f1)

t=strsplit(file_name,' ')


%to determind species
species_name=t{1};

q=length(t)
% to determind temp
low_temp=str2double(t{q-3})
high_temp=str2double(t{q-2})
mid_temp=str2double(t{q-4})


line_2=fgetl(f1)
l2=strfind(line_2,'E');
a1=str2double(line_2(1:(l2(1)+3)));
a2=str2double(line_2((l2(1)+4):(l2(2)+3)));
a3=str2double(line_2((l2(2)+4):(l2(3)+3)));
a4=str2double(line_2((l2(3)+4):(l2(4)+3)));
a5=str2double(line_2((l2(4)+4):(l2(5)+3)));

% extratig coefficiet from second line
line_3=fgetl(f1);
l3=strfind(line_3,'E');
a6=str2double(line_3(1:(l3(1)+3)));
a7=str2double(line_3((l3(1)+4):(l3(2)+3)));
a8=str2double(line_3((l3(2)+4):(l3(3)+3)));
a9=str2double(line_3((l3(3)+4):(l3(4)+3)));
a10=str2double(line_3((l3(4)+4):(l3(5)+3)));


% extratig coefficiet from third line

line_4=fgetl(f1);
l4=strfind(line_4,'E');
a11=str2double(line_4(1:(l4(1)+3)));
a12=str2double(line_4((l4(1)+4):(l4(2)+3)));
a13=str2double(line_4((l4(2)+4):(l4(3)+3)));
a14=str2double(line_4((l4(3)+4):(l4(4)+3)));

% create a folder 'species' to save thrmo plot of species
mkdir(['C:\Users\sarath\Desktop\New folder (2)\',species_name]);
cd(['C:\Users\sarath\Desktop\New folder (2)\',species_name]);


T=linspace(low_temp,high_temp,500);

% calling func

[cp,h,s]=coeff(a1,a2,a3,a4,a5,a6,a7,a8,a9,a10,a11,a12,a13,a14,T);
%plottig

% plot bt temp and specific heat
figure(1)
plot(T,cp,'linewidth',3,'color','b')
title(species_name)
xlabel('temperature')
ylabel('specific heat')

%plot bt temp & enthalpy
figure(2)
plot(T,h,'linewidth',3,'color','b')
title(species_name)
xlabel('temperature')
ylabel('enthalpy')

%plot bt temp & entropy

figure(3)
plot(T,s,'linewidth',3,'color','b')
title(species_name)
xlabel('temperature')
ylabel('entropy')


%saving plots

saveas(1,'specific heat.png')
saveas(2,'enthalpy.png')
saveas(3,'entropyn.png')


end
calculating molecular weight of species code :
%molecular_mass
species = species_name;
elements = ['H','C','O','N','A'];
atomic_weight = [1 12 14 16 40];

%Calculating Molecular Mass for the different species.
mol_mass = 0;
for i = 1:length(species);
  for m = 1:length(elements);
     if strcmpi(species(i),elements(m)); %Here it check if both charcter string has same value
       mol_mass = mol_mass + atomic_weight(m);
       position = m;
     end
  end
end
 n = str2num(species(i));
 if n > 1
  mol_mass = mol_mass + (atomic_weight(position)*(n-1));
 end

fprintf('Molecular Weight of %s:%f\n',species,mol_mass)
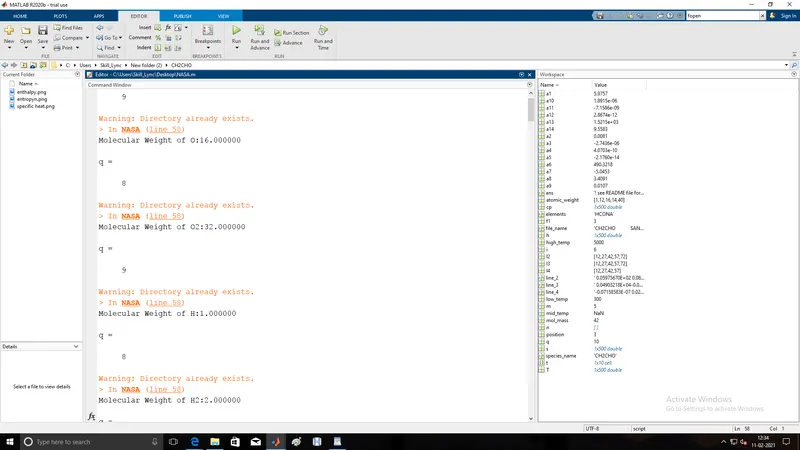
output: species location

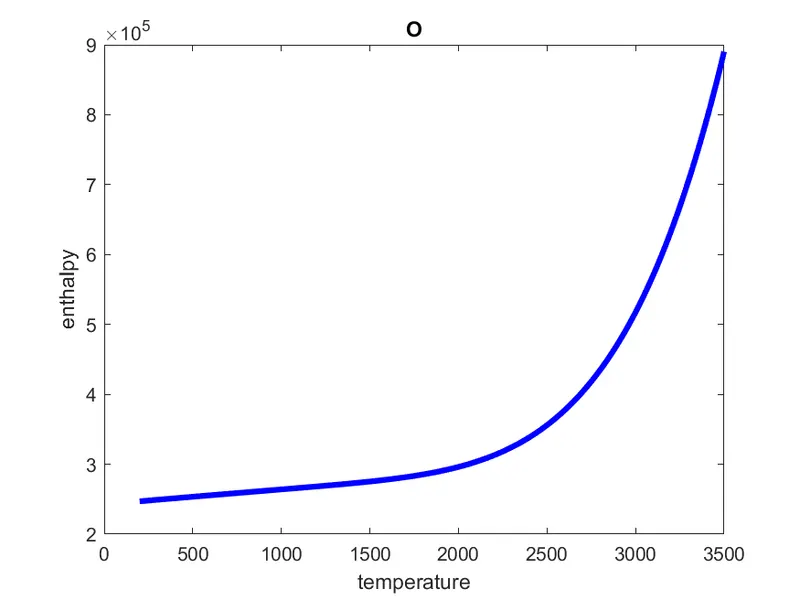
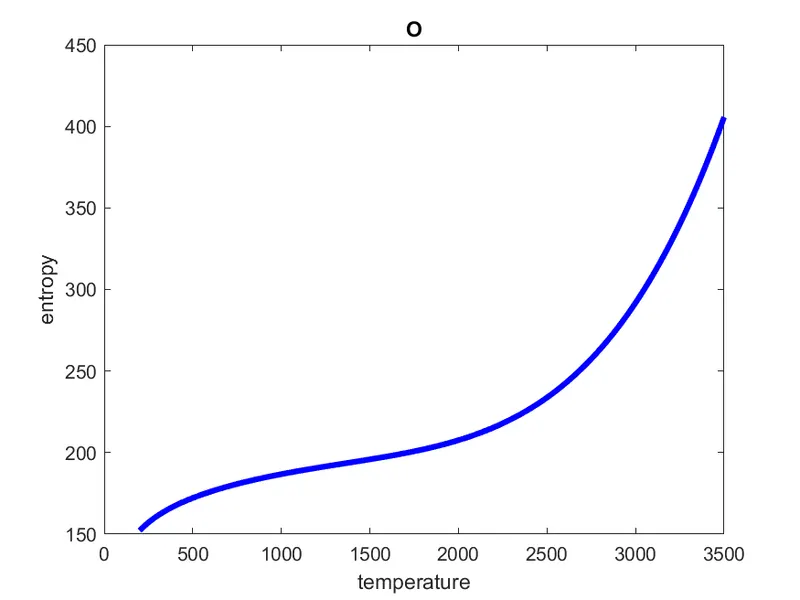
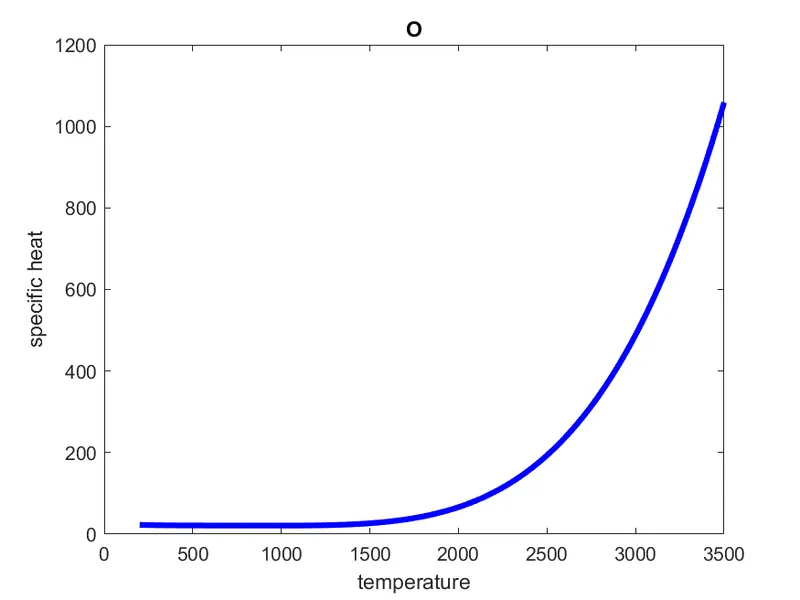
plots:
for:o
for:N
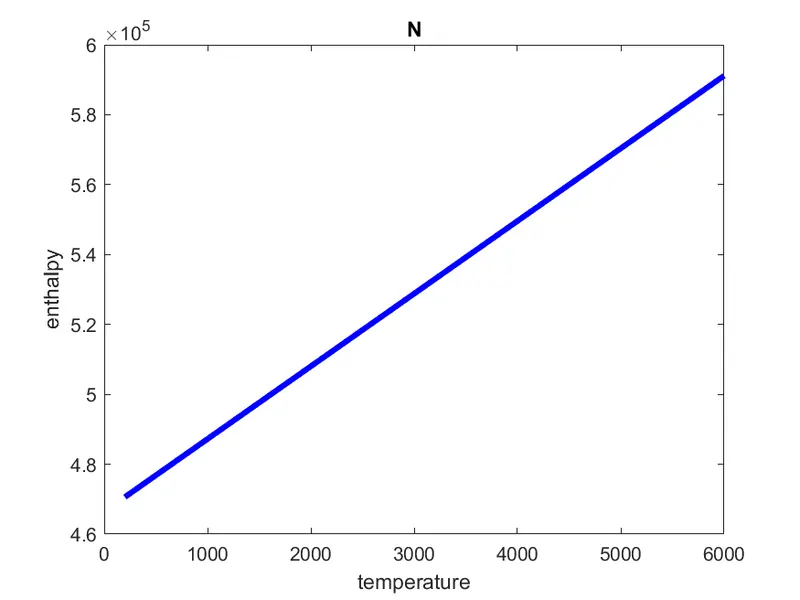
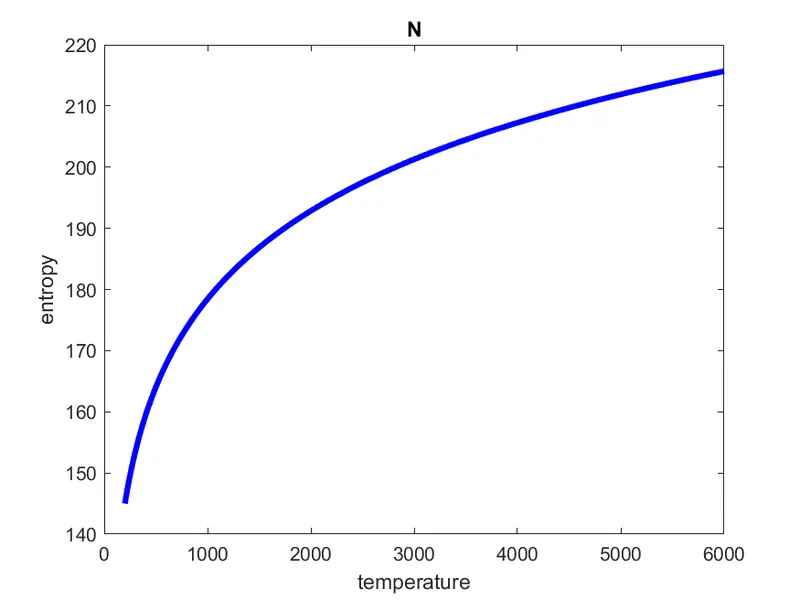
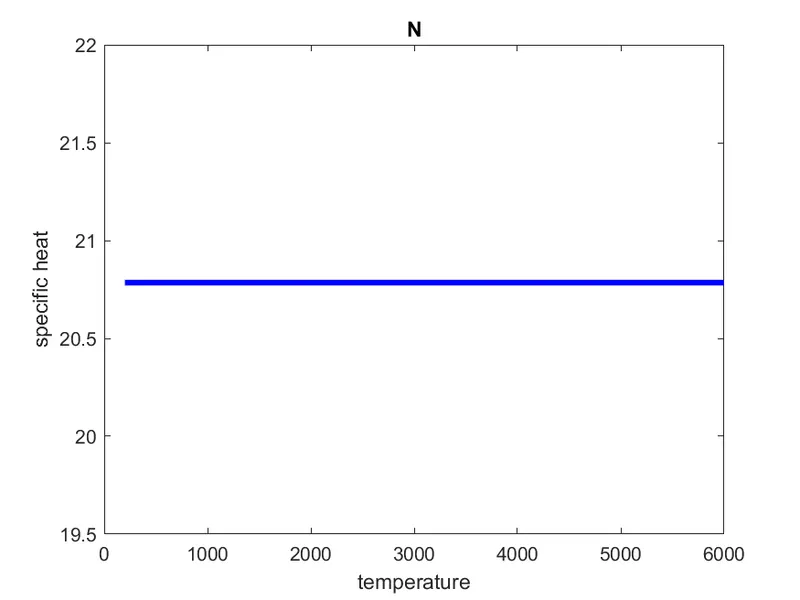
for:CH2CHO
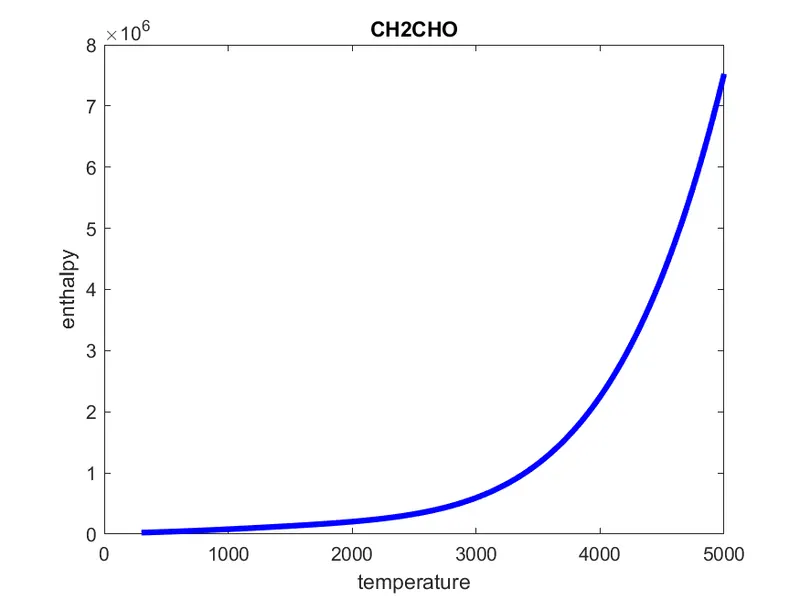
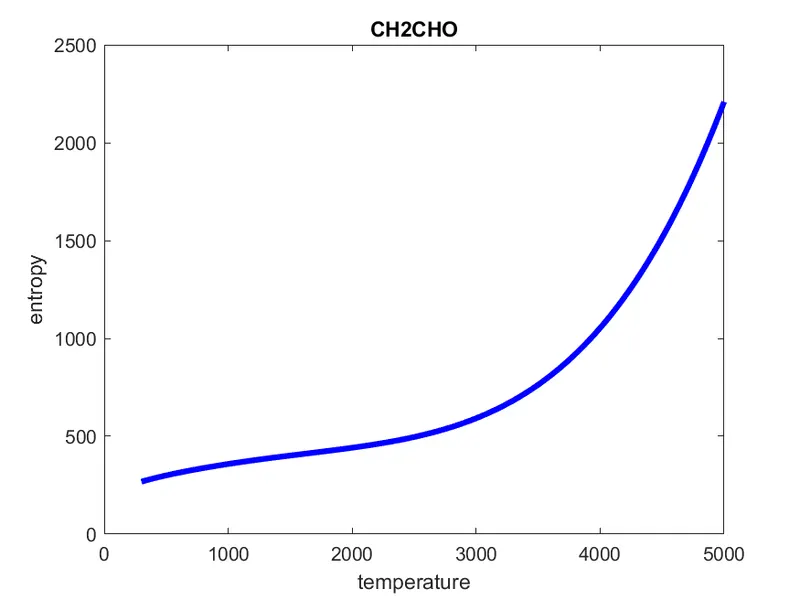
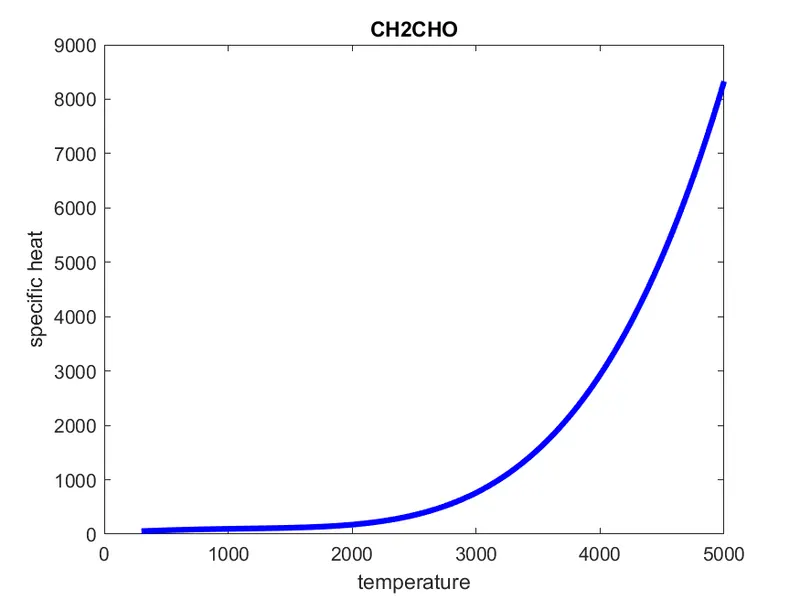
conclusion: the parsing of thermodynamic data file by nasa is done using certain command in MATLAB.function that extracts the 14 co-efficients and calculates the enthalpy, entropy and specific heats for all the species in the data file are ploted and saved in seperate folder screen shot has been attached and some of the plot also attracted as a photo form abow.Calculate the molecular weight of each species and display it in the command window.