Project 1 - Parsing NASA thermodynamic data
Project 1 - Parsing NASA thermodynamic data
Aim:- Parsing NASA thermodynamic data, to calculates the enthalpy, entropy and specific heats for all the species in the given data file.
Objective:-
1) Write a code to calculate the Cp,S and H of all the species in the in the given data file by using the 14 co-efficents, like for first 7 coefficients are high-temperature coefficients and the second 7 coefficients are low-temperature coefficients.Use local temperature for every species.
2) Calculate the species molecular weight and should display it in the command window.
3) Make a code to save the plots of every species in different folders automatically.
Theory:-
Parsing, syntax analysis, or syntactic analysis is the process of analyzing a string of symbols, either in natural language, computer languages or data structures, conforming to the rules of a formal grammer. Within computer science, the term is used in the analysis of computer language, referring to the syntactic analysis of the input code into its component parts in order to facilitate the writing of compilers and interpreters.
Here with the given data we are finding out enthalpy, entropy and specific heat.
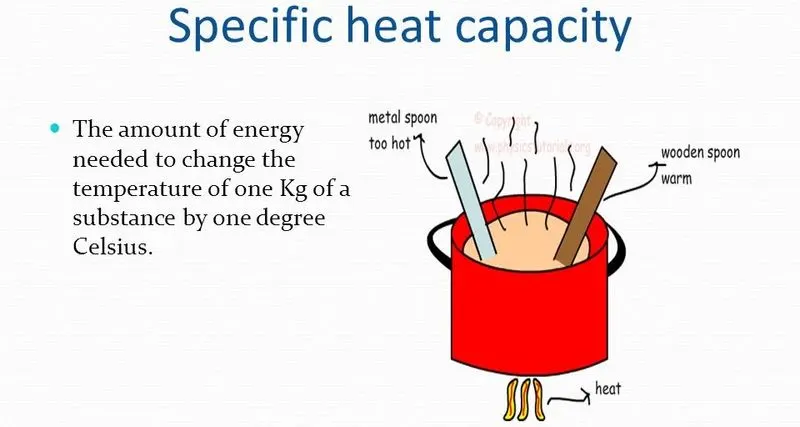
Specific Heat Capacity:-The specific heat capacity (symbol cp) of a substance is the heat capacity of a sample of the substance divided by the mass of the sample. Informally, it is the amount of energy that must be added, in the form of heat, to one unit of mass of the substance in order to cause an increase of one unit in temperature. The SI unit of specific heat is joule per kelvin and kilogram, J/(K kg).
The below given is the formula that we use to calculate Cp in this project.

where, R is the universal gas constant
T is the temeprature
a1 , a2 , a3 , a4 , a5 are co.efficents of temperature.
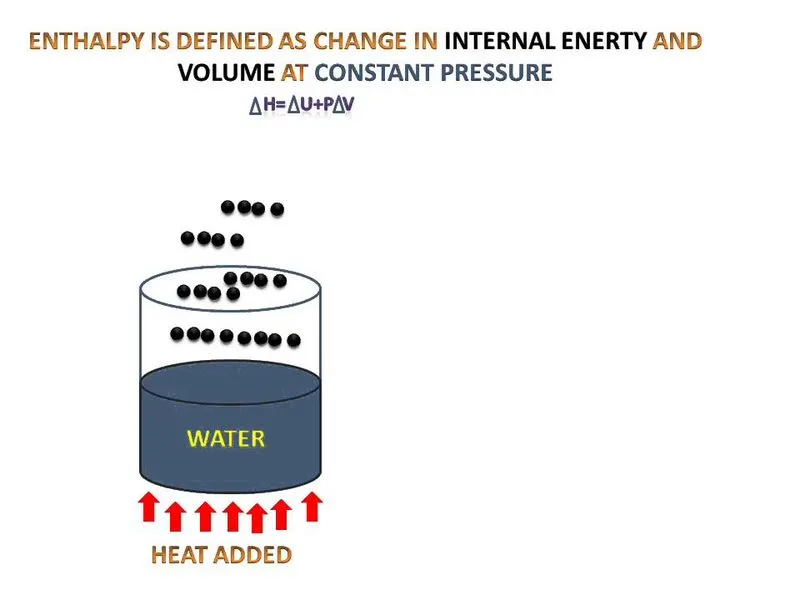
Enthalpy:- Enthalpy is a property of a thermodynamic system, defined as the sum of the system's internal energy and the product of its pressure and volume. The enthalpy of an ideal gas is independent of its pressure, and depends only on its temperature, which correlates to its internal energy. Real gases at common temperatures and pressures often closely approximate this behavior, which simplifies practical thermodynamic design and analysis.
The below given is the formula that we use to calculate Enthalpy in this project.

where, R is the universal gas constant
T is the temeprature
a1 , a2 , a3 , a4 , a5 , a6 are co.efficents of temperature.
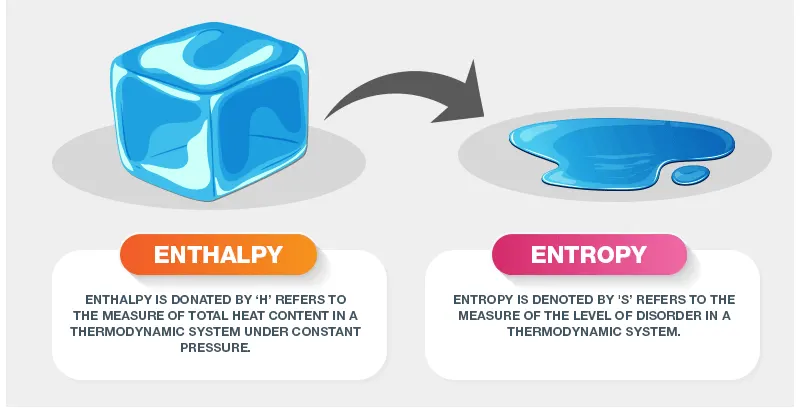
Entropy:- Entropy, the measure of a system’s thermal energy per unit temperature that is unavailable for doing useful work. Because work is obtained from ordered molecular motion, the amount of entropy is also a measure of the molecular disorder, or randomness, of a system.
The below given is the formula that we use to calculate Entropy in this project.

where, R is the universal gas constant
T is the temeprature
a1 , a2 , a3 , a4 , a5 , a7 are co.efficents of temperature.

Program and Explanation :-
clear all
close all
clc

%Opening the Data file
data = fopen('THERMO.dat','r');

for i=1:5
fgetl(data);

end

for k=1:53
% Extracting the name and Temperature
Cp=0;
H=0;
S=0;
tline = fgetl(data);
Species=strsplit(tline,' ');
species_name= Species{1};
Tlow = str2num(Species{end-3});
Tmid= str2num(Species{end-1});
Thigh= str2num(Species{end-2});
Temperature=(Tlow:Thigh);

% R in  J⋅K−1⋅mol−1
R = 8.31446261815324 ;

%Extracting the Co.Efficents
tline1 = fgetl(data);
a_coeff=findstr(tline1,'E') ;
a1=tline1(1:a_coeff(1)+3);
a1=str2num(a1);
a2=tline1(a_coeff(1)+4:a_coeff(2)+3);
a2=str2num(a2);
a3=tline1(a_coeff(2)+4:a_coeff(3)+3);
a3=str2num(a3);
a4=tline1(a_coeff(3)+4:a_coeff(4)+3);
a4=str2num(a4);
a5=tline1(a_coeff(4)+4:a_coeff(5)+3);
a5=str2num(a5);

tline2 = fgetl(data);
a2_coeff=findstr(tline2,'E');
a6=tline2(1:a2_coeff(1)+3);
a6=str2num(a6);
a7=tline2(a2_coeff(1)+4:a2_coeff(2)+3);
a7=str2num(a7);
a8=tline2(a2_coeff(2)+4:a2_coeff(3)+3);
a8=str2num(a8);
a9=tline2(a2_coeff(3)+4:a2_coeff(4)+3);
a9=str2num(a9);
a10=tline2(a2_coeff(4)+4:a2_coeff(5)+3);
a10=str2num(a10);

tline3 = fgetl(data);
a3_coeff=findstr(tline3,'E');
a11=tline3(1:a3_coeff(1)+3);
a11=str2num(a11);
a12=tline3(a3_coeff(1)+4:a3_coeff(2)+3);
a12=str2num(a12);
a13=tline3(a3_coeff(2)+4:a3_coeff(3)+3);
a13=str2num(a13);
a14=tline3(a3_coeff(3)+4:a3_coeff(4)+3);
a14=str2num(a14);

%Calculating the Cp, H and S values
a =[a1 a2 a3 a4 a5 a6 a7 a8 a9 a10 a11 a12 a13 a14];
i =1;
for T =(Tlow:Thigh)

 if T<=Tmid
     a1=a(8);
     a2=a(9);
     a3=a(10);
     a4=a(11);
     a5=a(12);
     a6=a(13);
     a7=a(14);
 else
     a1=a(1);
     a2=a(2);
     a3=a(3);
     a4=a(4);
     a5=a(5);
     a6=a(6);
     a7=a(7);
 end


Cp(i) = (a1+(a2*T)+(a3*T^2)+(a4*T^3)+(a5*T^4))*R;
H(i)  = (a1+(a2*(T/2))+(a3*((T^2)/3))+(a4*((T^3)/4))+(a5*((T^4)/5))+(a6/T))*(R*T);
S(i)  = ((a1*log(T))+(a2*T)+(a3*(T^2)/2)+(a4*(T^3)/3)+(a5*(T^4)/4)+a7)*R;
i = i+1;
end


%Finding molecular mass
elems = ["H", "C", "N", "O", "S", "A"];
atomic_masses = [1.00797,12.011,14.0067,15.9994,32.06,39.948];
molecular_weight=0;
for i =1:length(species_name)

[num, status] = str2num(species_name(i));

if (status)
    molecular_weight=molecular_weight+(atomic_masses(n)*(num-1));

else

    for k=1:length(elems)

       if species_name(i)== elems(k)
           molecular_weight=molecular_weight+atomic_masses(k);
           n=k;
       end

    end
end
end
M_weight=molecular_weight;

fprintf('molecular weight of %s  : %f \n',species_name,M_weight)


%Saving and ploting
mkdir (char(species_name))

figure()
plot(Temperature,Cp,'linewidth',4)
title('Temperature Vs Cp')
xlabel('Temperature')
ylabel('Cp')
url1 = sprintf('C:/Users/Skill_Lync/Documents/MATLAB/Project1.1/%s/Temperature Vs Cp.jpg',species_name);
saveas(gcf,url1)

figure()
plot(Temperature,H,'linewidth',4)
title('Temperature Vs Enthalpy')
xlabel('Temperature')
ylabel('Enthalpy')
url2 = sprintf('C:/Users/Skill_Lync/Documents/MATLAB/Project1.1/%s/Temperature Vs Enthalpy.jpg',species_name);
saveas(gcf,url2)

figure()
plot(Temperature,S,'linewidth',4)
title('Temperature Vs Entropy')
xlabel('Temperature')
ylabel('Entropy')

url3 = sprintf('C:/Users/Skill_Lync/Documents/MATLAB/Project1.1/%s/Temperature Vs Entropy.jpg',species_name);
saveas(gcf,url3)


k=k+4;

end
1) "clear all, close all, clc " they are used to clear all the previous programs data and to begin as fresh.
2) Things that comes after "%" symbol are just comments , they dont have any influnce on the program.
3)data = fopen('THERMO.dat','r'); = fopen will open the file THERMO, we are going to use the data in it for the calculation.
4)
for i=1:5
fgetl(data);
end = This is used to skip the first 5 lines which is not necessary for us
5) The steps below is for getting the local temperature and name of the species
for k=1:53 = start the for loop to calculate every species values
6) Reseting the values of Cp, H, and S after calculating for each species
Cp=0;
H=0;
S=0;
7) fgetl will take the 6th line as we skipped till 5th line in the beganing.
tline = fgetl(data);
8)strsplit will split the line with the character that we give, here we used a space ' '.
Species=strsplit(tline,' ');
9) the species name is in the first cell of species so the next line will save the species name in species_name
species_name= Species{1};
10) Last three cells of Species will give the local temperature of species.
Tlow = str2num(Species{end-3});
Tmid= str2num(Species{end-1});
Thigh= str2num(Species{end-2});
11) the temperature range is assigned below this is used to polt graphs at the end.
Temperature=(Tlow:Thigh);
12) We saved the value of Gas constant in R
R = 8.31446261815324 ;
13) Now we will extract the coefficent from the THERMO file
14) from the 7th line the coefficents value is comming so the next fgetl will give that line
tline1 = fgetl(data);
a_coeff=findstr(tline1,'E') ; = This will seperate the numbers with letter E.
a1=tline1(1:a_coeff(1)+3); = After E we need 3 more places so the +3 is used
a1=str2num(a1); = Then we convert the srting to number and save the co.efficent as a number
a2=tline1(a_coeff(1)+4:a_coeff(2)+3); = Now start the next number after the position E+3 so we need to add 4 to get the position after 3. Likewise do it for the rest 4 co.efficents in that line
a2=str2num(a2);
a3=tline1(a_coeff(2)+4:a_coeff(3)+3);
a3=str2num(a3);
a4=tline1(a_coeff(3)+4:a_coeff(4)+3);
a4=str2num(a4);
a5=tline1(a_coeff(4)+4:a_coeff(5)+3);
a5=str2num(a5);
15) Now we take the 8th line and take the next 5 co.efficent values
tline2 = fgetl(data);
a2_coeff=findstr(tline2,'E');
a6=tline2(1:a2_coeff(1)+3);
a6=str2num(a6);
a7=tline2(a2_coeff(1)+4:a2_coeff(2)+3);
a7=str2num(a7);
a8=tline2(a2_coeff(2)+4:a2_coeff(3)+3);
a8=str2num(a8);
a9=tline2(a2_coeff(3)+4:a2_coeff(4)+3);
a9=str2num(a9);
a10=tline2(a2_coeff(4)+4:a2_coeff(5)+3);
a10=str2num(a10);
16)Then take the 9th line and take the next 4 co.efficent values
tline3 = fgetl(data);
a3_coeff=findstr(tline3,'E');
a11=tline3(1:a3_coeff(1)+3);
a11=str2num(a11);
a12=tline3(a3_coeff(1)+4:a3_coeff(2)+3);
a12=str2num(a12);
a13=tline3(a3_coeff(2)+4:a3_coeff(3)+3);
a13=str2num(a13);
a14=tline3(a3_coeff(3)+4:a3_coeff(4)+3);
a14=str2num(a14);
17) Assign the all coefficents into a as an array
a =[a1 a2 a3 a4 a5 a6 a7 a8 a9 a10 a11 a12 a13 a14];
18) now for each value of T from low to high we will calculate a corresponding Cp,H and S.
i =1;
for T =(Tlow:Thigh) = Used to give the local temperature range.
In question it was given that the first 7 co.efficent are for high temperature range and 2nd 7 co.efficents are for low temperature range. So we used the next if condition
if T<=Tmid
a1=a(8);
a2=a(9);
a3=a(10);
a4=a(11);
a5=a(12);
a6=a(13);
a7=a(14);
else
a1=a(1);
a2=a(2);
a3=a(3);
a4=a(4);
a5=a(5);
a6=a(6);
a7=a(7);
end
The codes below are the formula to find out the Cp, H and S .
Cp(i) = (a1+(a2*T)+(a3*T^2)+(a4*T^3)+(a5*T^4))*R;
H(i) = (a1+(a2*(T/2))+(a3*((T^2)/3))+(a4*((T^3)/4))+(a5*((T^4)/5))+(a6/T))*(R*T);
S(i) = ((a1*log(T))+(a2*T)+(a3*(T^2)/2)+(a4*(T^3)/3)+(a5*(T^4)/4)+a7)*R;
i = i+1;
end
19) Now we can find the molecular mass of each molecule.
elems = ["H", "C", "N", "O", "S", "A"]; = here in elems we give the names of each elements that we use
atomic_masses = [1.00797,12.011,14.0067,15.9994,32.06,39.948]; = for the corresponding place of elements we give there corresponding atomic masses
molecular_weight=0; = we give this step to reset the value of molecular weight after each species value is found out
Now we need to find out is there a number between the names of the species name .
for i =1:length(species_name) = This for loop is used to check each letter of the species
[num, status] = str2num(species_name(i)); = If the species name has a number then it will be saved in num and the status will be 1 or else the status will be 0
if (status) = only if the status is 1 this if condition will work
molecular_weight=molecular_weight+(atomic_masses(n)*(num-1)); = If there is a number , num-1 value will be multiplied with the element before the number.
else = in else condition if the species name is a letter, that elements atomic weight will be added to the molecular weight.
for k=1:length(elems)
if species_name(i)== elems(k)
molecular_weight=molecular_weight+atomic_masses(k);
n=k; = k position will be saved in the n
end
end
end
end
M_weight=molecular_weight;
fprintf('molecular weight of %s : %f \n',species_name,M_weight) = This will print the value of molecular weight in the command window
20) mkdir will create a new folder with the spiecs name , so for each species we get a folder.
mkdir (char(species_name))
21) The below given are the codes to plot the 3 graphs for Cp, H and s
figure() = This will create a seperate figure window.
plot(Temperature,Cp,'linewidth',4) = This will plot the temperature vs Cp curve with a linewidth of 4.
title('Temperature Vs Cp') = This will give Temperature Vs Cp as title.
xlabel('Temperature') = This will give the x-axis a name.
ylabel('Cp') = This will give the y axis a name.
url1 = sprintf('C:/Users/Skill_Lync/Documents/MATLAB/Project1.1/%s/Temperature Vs Cp.jpg',species_name); = Here in url1 I have give a path to which i need to save the plot.
saveas(gcf,url1) = This save as wil save the plot in the above path.
The below codes are the same as above only the name changes Cp to H or S
figure()
plot(Temperature,H,'linewidth',4)
title('Temperature Vs Enthalpy')
xlabel('Temperature')
ylabel('Enthalpy')
url2 = sprintf('C:/Users/Skill_Lync/Documents/MATLAB/Project1.1/%s/Temperature Vs Enthalpy.jpg',species_name);
saveas(gcf,url2)
figure()
plot(Temperature,S,'linewidth',4)
title('Temperature Vs Entropy')
xlabel('Temperature')
ylabel('Entropy')
url3 = sprintf('C:/Users/Skill_Lync/Documents/MATLAB/Project1.1/%s/Temperature Vs Entropy.jpg',species_name);
saveas(gcf,url3)
The below code which increment the k value with 4 will help us to move to the next species
k=k+4;
end = Will end the for loop
Result :-
1) Extracted the 14 coefficent for each species
2) Calculated the molecular weight of each species
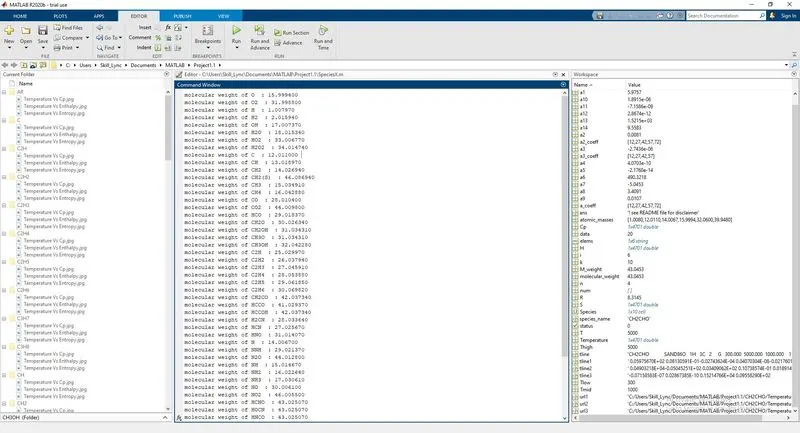
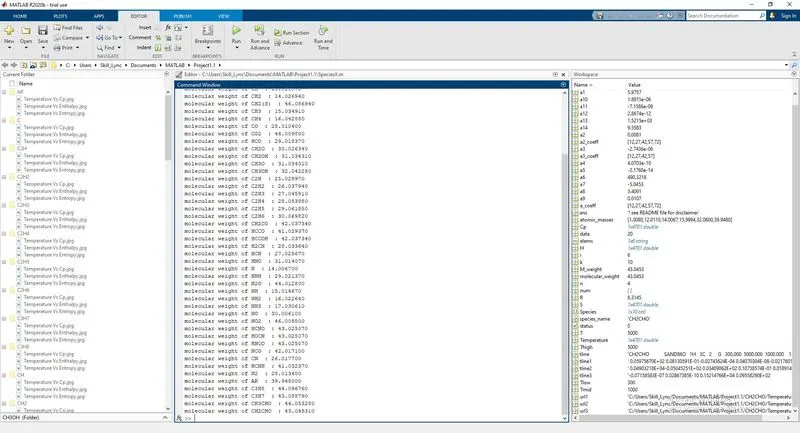
3) Ploted the 3 graphs Cp vs Temperature, H vs temperature and S Vs temperature for every species.
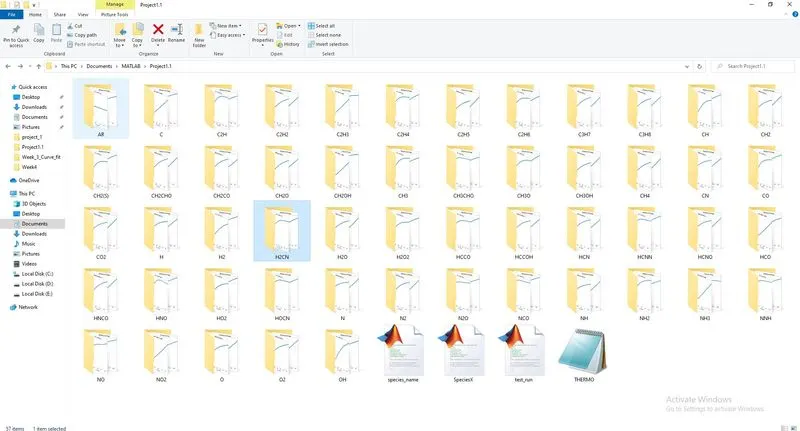
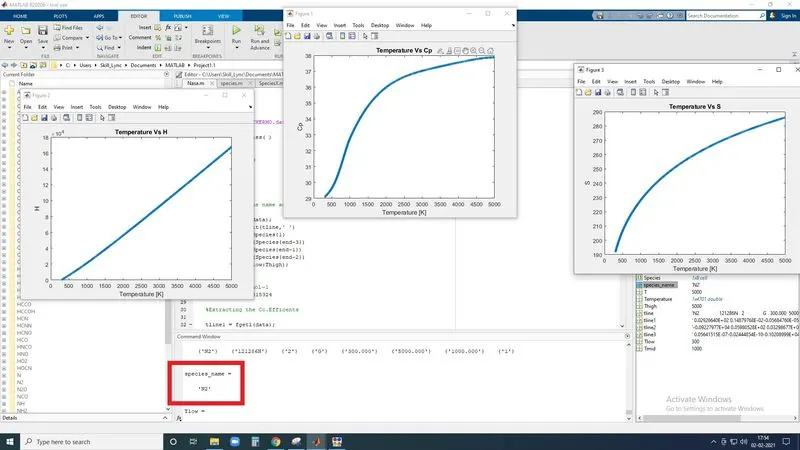
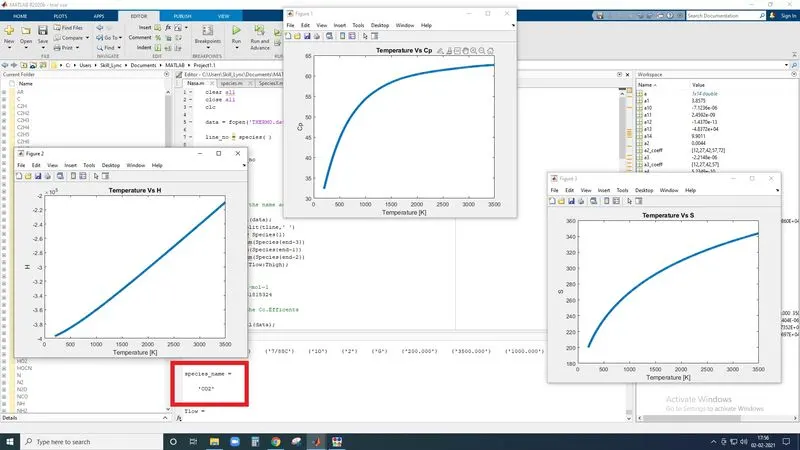
4) Plots for O2, N2 and CO2 species
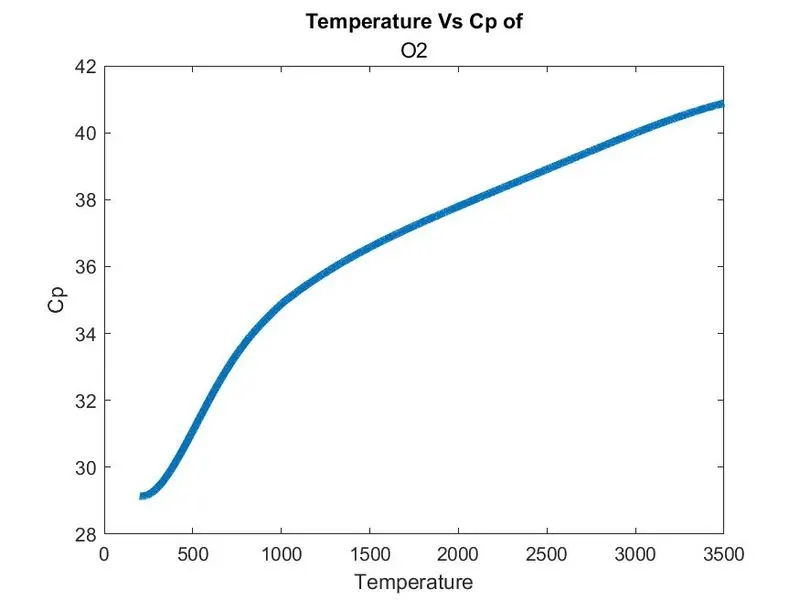
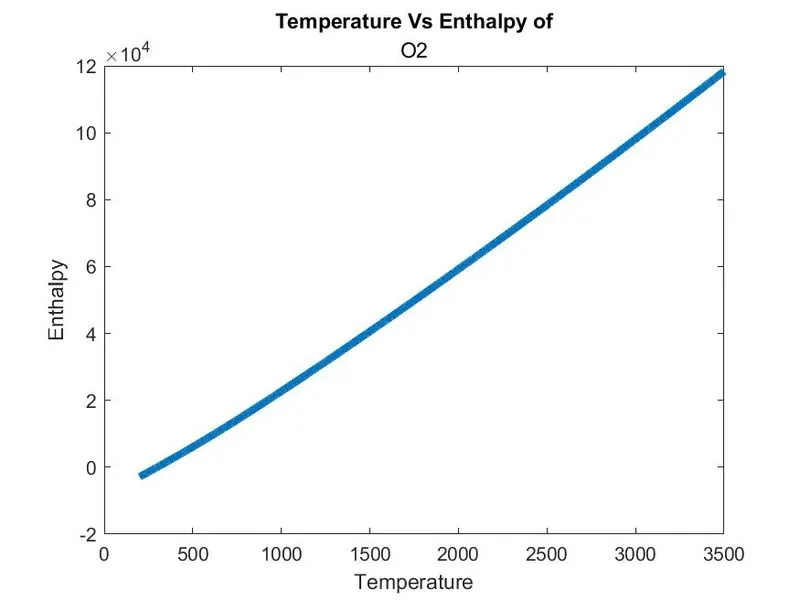
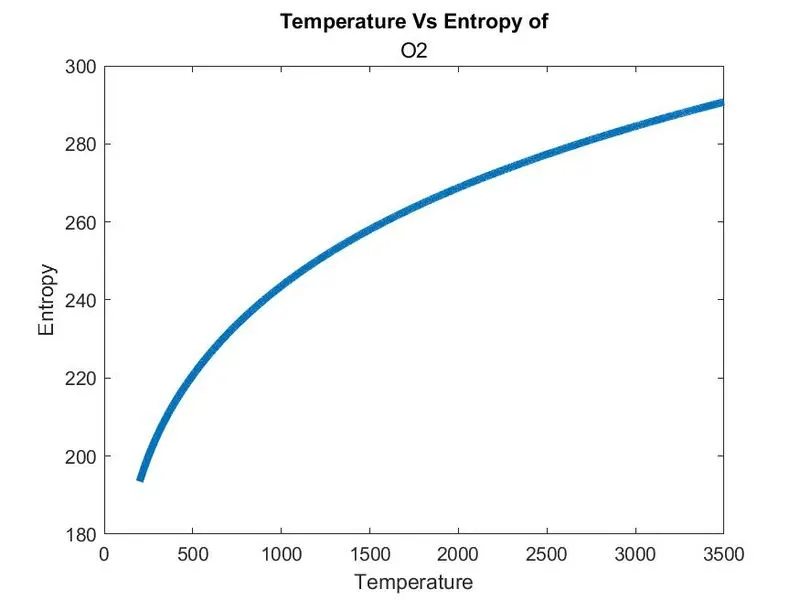
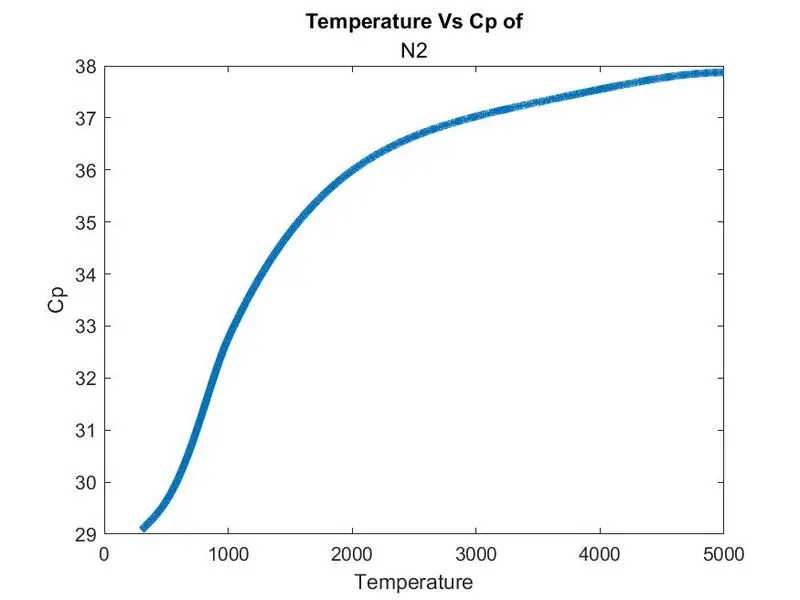
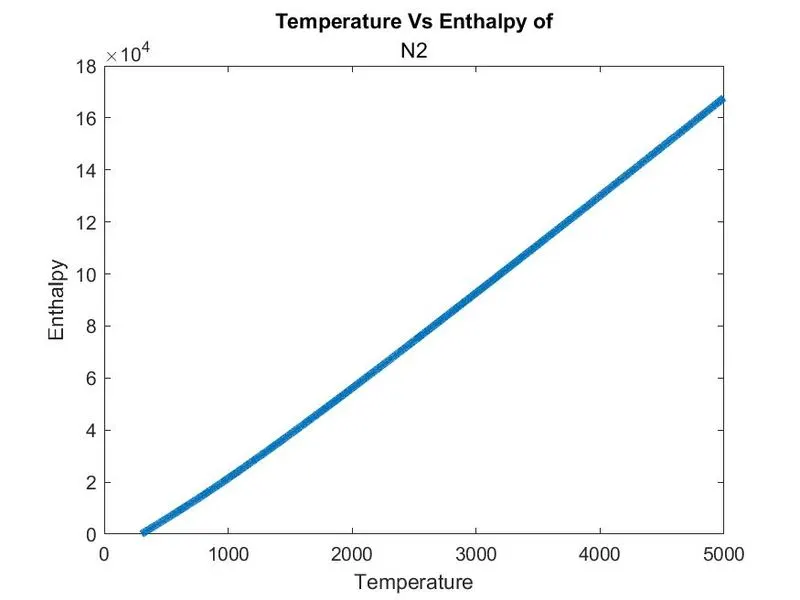
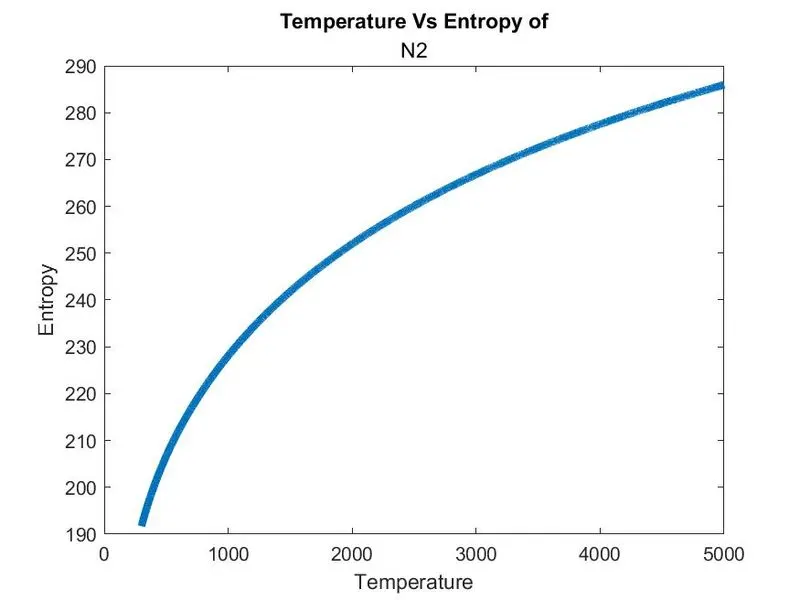
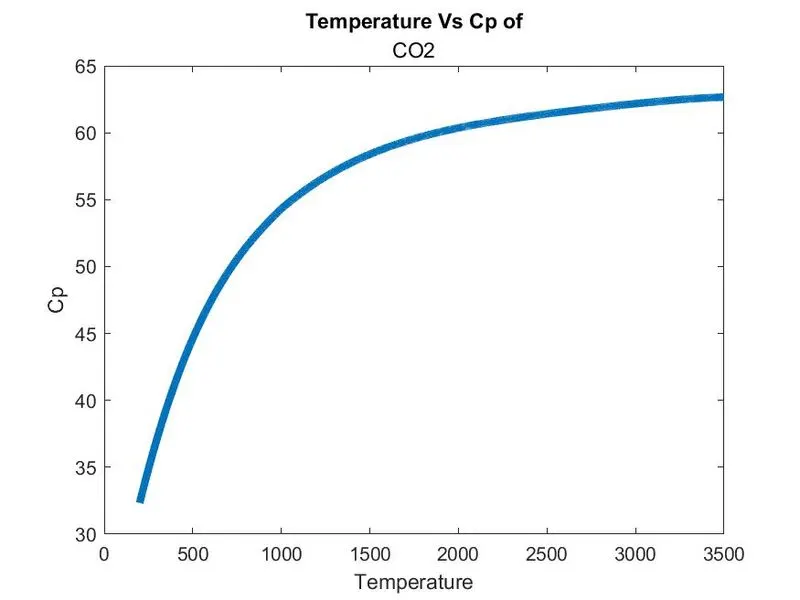
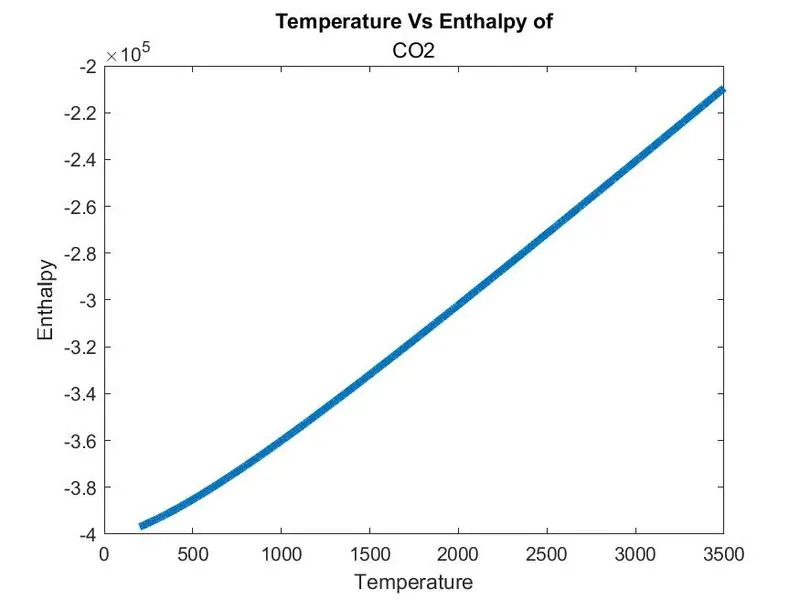
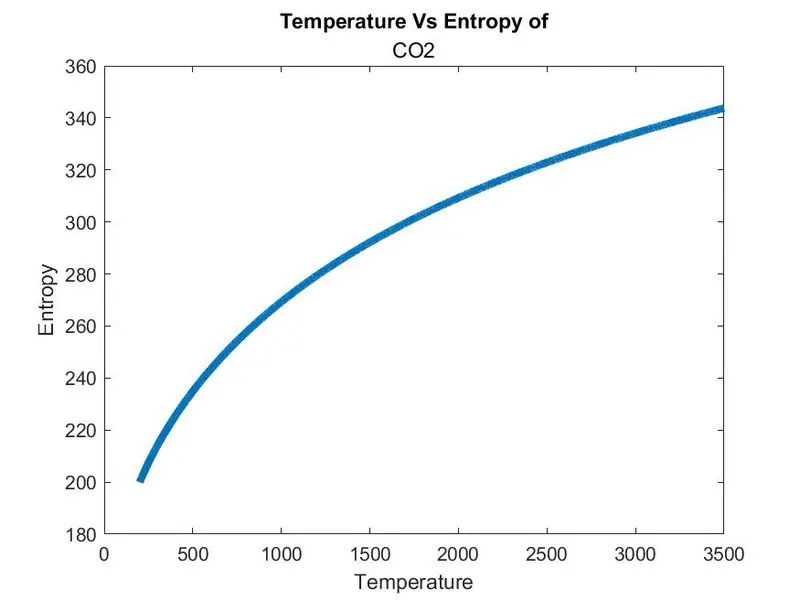
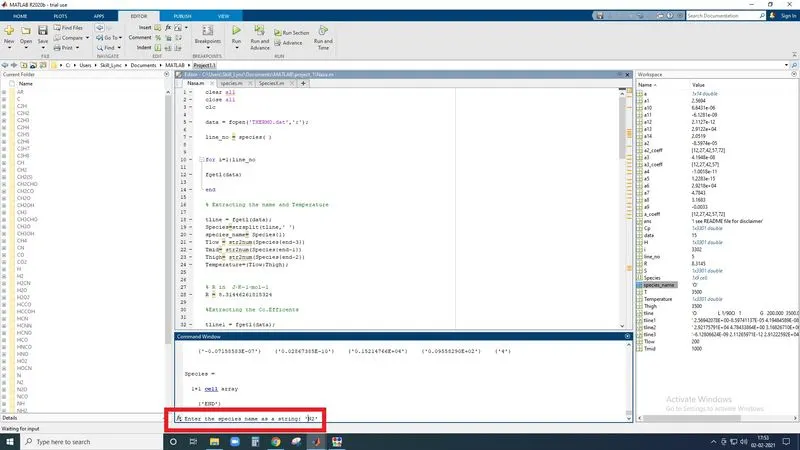
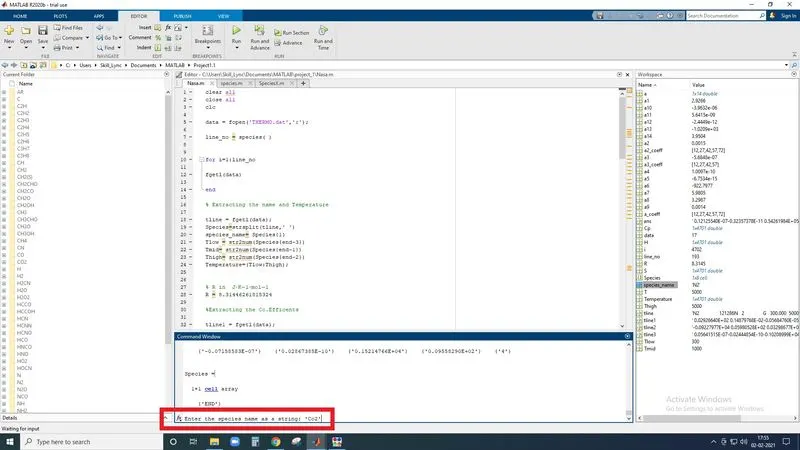
I have also written a program where , If you give the name of species as input it will give its plot and calculation. The program is case insensitive.
clear all
close all
clc

data = fopen('THERMO.dat','r');

line_no = species( )


for i=1:line_no

fgetl(data)

end

% Extracting the name and Temperature

tline = fgetl(data);
Species=strsplit(tline,' ')
species_name= Species{1}
Tlow = str2num(Species{end-3})
Tmid= str2num(Species{end-1})
Thigh= str2num(Species{end-2})
Temperature=(Tlow:Thigh);


% R in  J⋅K−1⋅mol−1
R = 8.31446261815324

%Extracting the Co.Efficents

tline1 = fgetl(data);
a_coeff=findstr(tline1,'E') ;
a1=tline1(1:a_coeff(1)+3);
a1=str2num(a1);
a2=tline1(a_coeff(1)+4:a_coeff(2)+3);
a2=str2num(a2);
a3=tline1(a_coeff(2)+4:a_coeff(3)+3);
a3=str2num(a3);
a4=tline1(a_coeff(3)+4:a_coeff(4)+3);
a4=str2num(a4);
a5=tline1(a_coeff(4)+4:a_coeff(5)+3);
a5=str2num(a5);

tline2 = fgetl(data);
a2_coeff=findstr(tline2,'E');
a6=tline2(1:a2_coeff(1)+3);
a6=str2num(a6);
a7=tline2(a2_coeff(1)+4:a2_coeff(2)+3);
a7=str2num(a7);
a8=tline2(a2_coeff(2)+4:a2_coeff(3)+3);
a8=str2num(a8);
a9=tline2(a2_coeff(3)+4:a2_coeff(4)+3);
a9=str2num(a9);
a10=tline2(a2_coeff(4)+4:a2_coeff(5)+3);
a10=str2num(a10);

tline3 = fgetl(data);
a3_coeff=findstr(tline3,'E');
a11=tline3(1:a3_coeff(1)+3);
a11=str2num(a11);
a12=tline3(a3_coeff(1)+4:a3_coeff(2)+3);
a12=str2num(a12);
a13=tline3(a3_coeff(2)+4:a3_coeff(3)+3);
a13=str2num(a13);
a14=tline3(a3_coeff(3)+4:a3_coeff(4)+3);
a14=str2num(a14);

%Functions
a =[a1 a2 a3 a4 a5 a6 a7 a8 a9 a10 a11 a12 a13 a14];
i =1;
for T =(Tlow:Thigh)

 if T<=Tmid
     a1=a(8);
     a2=a(9);
     a3=a(10);
     a4=a(11);
     a5=a(12);
     a6=a(13);
     a7=a(14);
 else
     a1=a(1);
     a2=a(2);
     a3=a(3);
     a4=a(4);
     a5=a(5);
     a6=a(6);
     a7=a(7);
 end


Cp(i) = (a1+(a2*T)+(a3*T^2)+(a4*T^3)+(a5*T^4))*R;
H(i)  = (a1+(a2*(T/2))+(a3*((T^2)/3))+(a4*((T^3)/4))+(a5*((T^4)/5))+(a6/T))*(R*T);
S(i)  = ((a1*log(T))+(a2*T)+(a3*(T^2)/2)+(a4*(T^3)/3)+(a5*(T^4)/4)+a7)*R;
i = i+1;
end

figure()
plot(Temperature,Cp,'linewidth',4)
title('Temperature Vs Cp')
xlabel('Temperature [K]')
ylabel('Cp')

figure()
plot(Temperature,H,'linewidth',4)
title('Temperature Vs H')
xlabel('Temperature [K]')
ylabel('H')

figure()
plot(Temperature,S,'linewidth',4)
title('Temperature Vs S')
xlabel('Temperature [K]')
ylabel('S')
The code is same in every means but i have used a funtion at the beganing line_no = species( )
function [line_no] = species( )

data = fopen('THERMO.dat','r');
line_count = 0;
j = 1;
for i = 1: 1000
    tline = fgetl(data);
    Species=strsplit(tline,' ')
    line_number= Species{end};
    if line_number == "1"
        Species_name(j) = string(Species{1})
        line_count(j) = i-1;
        j = j+1;
    elseif line_number == "END"
        break;
    end

end

input_species = input('Enter the species name as a string: ')
a = find(Species_name == input_species)
a = strcmpi(Species_name,input_species)
line_no = line_count(a)
Here each line is checked and if the end cell of the line is 1 then take the 1st cell which contain the species name . Also save the line number of the line before the species name. Then that line number is given to main code as input.
I have used strcpmi which make our input case insensitive.
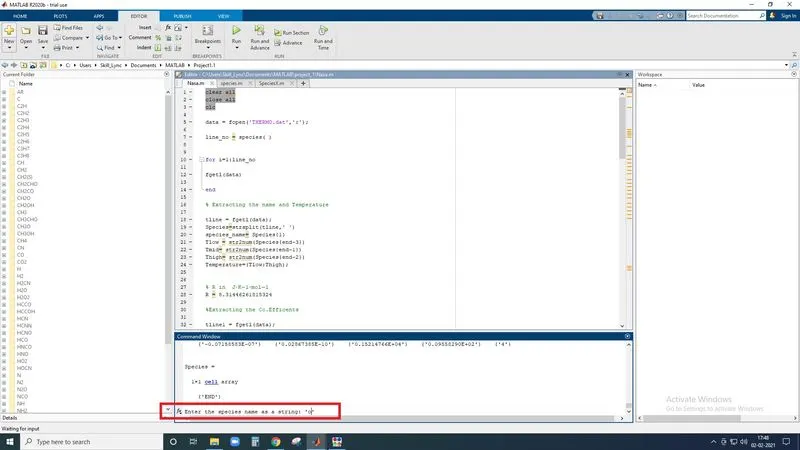
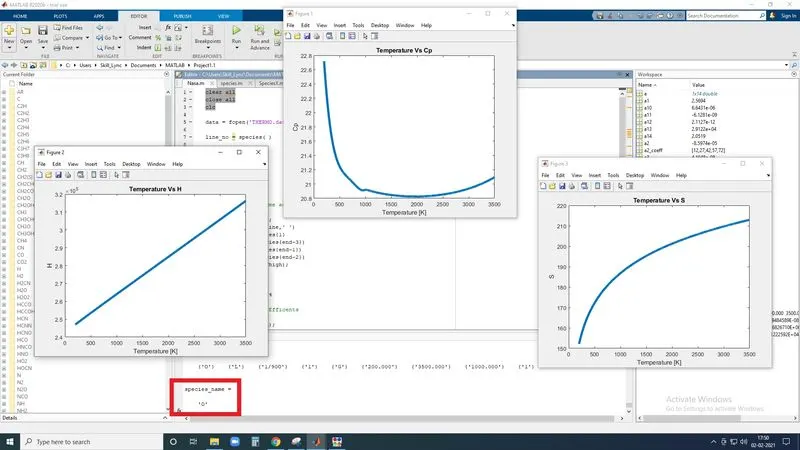
See even if i give lower case 'o' we get the result of 'O'
like wise for 'N2' and 'Co2'