Project 1 - Parsing NASA thermodynamic data
OBJECTIVE - Write a function that extracts the 14 co-efficients and calculates the enthalpy, entropy and specific heats for all the species in the data file. You will be reading this file NASA thermodynamic data.
INTRODUCTION - We have a NASA thermodynamic data file.This is link of file NASA data file .So firstly we will read that file in our MATLAB software then after that we will take line by line data by some command to operation .This operation is to extracting the co-efficient which will be help full for determining the different type of thermodynamic property like as specific heat (cp), enthalpy (H) and entropy(s) by below given equation:

Here R is the universal gas constant, T is the temperature
In given NASA file for each species like molecules O2 (oxygen), N2 (nitrogen), CO2 (carbon- die-oxide) etc have fourteen coefficient. The FIRST 7coefficients are at HIGH-temperature coefficients and the SECOND 7 coefficients are at LOW-temperature coefficients. So we will determine these thermodynamic properties at low temperature as well as high temperature coefficient.We will also code for making directory for storing the specific plots for each species with its name. All these will be generated automatically by coding.
THEORY -
ENTHALPY -
Enthalpy is the sum of the internal energy of the system plus the product of the pressure of the gas in the system and its volume: H = U + PV. Therefore, enthalpy of a gas decreases with pressure at constant temperature. Enthalpy of the liquid phase at constant temperature remains constant for moderate pressures.
ENTROPY -
Entropy is defined as the quantitative measure of disorder or randomness in a system. The concept comes out of thermodynamics, which deals with the transfer of heat energy within a system. Instead of talking about some form of "absolute entropy,"
n an isothermal process, the change in entropy (delta-S) is the change in heat (Q) divided by the absolute temperature (T):
delta-S = Q/T
SPECIFIC HEAT -
Specific heat, ratio of the quantity of heat required to raise the temperature of a body one degree to that required to raise the temperature of an equal mass of water one degree.
MATLAB CODE - Now writing the main code for parsing the dat file .
clear all
close all
clc

thermo = fopen('THERMO.dat','r')
fgetl(thermo);
f1 = fgetl(thermo);

A = strsplit(f1,' ');

global_low_temp = str2num(A{2});
global_mid_temp = str2num(A{3});
global_high_temp = str2num(A{4});

fgetl(thermo);
fgetl(thermo);
fgetl(thermo);

for n = 1:53;

f2 = fgetl(thermo);

A2 = strsplit(f2,' ');
l = length(A2)
species_name = A2{1}


mkdir(species_name)

local_low_temp = str2num(A2{l-3});
local_high_temp = str2num(A2{l-2});
local_mid_temp = str2num(A2{l-1});

f3 = fgetl(thermo);

A3 = findstr(f3,'E');

coef1 = f3(1:15);
coef2 = f3(16:30);
coef3 = f3(31:45);
coef4 = f3(46:60);
coef5 = f3(61:75);

coeff1 = str2num(coef1);
coeff2 = str2num(coef2);
coeff3 = str2num(coef3);
coeff4 = str2num(coef4);
coeff5 = str2num(coef5);


f4 = fgetl(thermo);
A4 = findstr(f4,'E');

coef6 = f4(1:15);
coef7 = f4(16:30);
coef8 = f4(31:45);
coef9 = f4(46:60);
coef10 = f4(61:75);

coeff6 = str2num(coef6);
coeff7 = str2num(coef7);
coeff8 = str2num(coef8);
coeff9 = str2num(coef9);
coeff10 = str2num(coef10);

f5 = fgetl(thermo);
A5 = findstr(f5,'E');

coef11 = f5(1:15);
coef12 = f5(16:30);
coef13 = f5(31:45);
coef14 = f5(46:60);

coeff11 = str2num(coef11);
coeff12 = str2num(coef12);
coeff13 = str2num(coef13);
coeff14 = str2num(coef14);


% for

R = 8.314;

t = linspace(local_low_temp,local_high_temp,300)

for i = 1:length(t)

if t(i)> local_mid_temp

cp(i) = (coeff1 + coeff2*t(i) + coeff3*(t(i)^2) + coeff4*(t(i)^3) + coeff5*(t(i)^4))*R

h(i) = (coeff1 + (coeff2*t(i))/2 + (coeff3*t(i)^2)/3 +(coeff4*t(i)^3)/4 + (coeff5*t(i)^4)/5 + coeff6/t(i))*R*t(i)

s(i) = (coeff1*log(t(i)) + coeff2*t(i) + (coeff3*t(i)^2)/2 + (coeff4*t(i)^3)/3 + (coeff5*t(i)^4)/4 + coeff7)*R

else
cp(i) = (coeff8 + coeff9*t(i) + coeff10*(t(i)^2) + coeff11*(t(i)^3) + coeff12*(t(i)^4))*R

h(i) = (coeff8 + (coeff9*t(i))/2 + (coeff10*t(i)^2)/3 +(coeff11*t(i)^3)/4 + (coeff12*t(i)^4)/5 + coeff13/t(i))*R*t(i)

s(i) = (coeff8*log(t(i)) + coeff9*t(i) + (coeff10*t(i)^2)/2 + (coeff11*t(i)^3)/3 + (coeff12*t(i)^4)/4 + coeff14)*R

end

end


plot(t,cp,'linewidth',3,'color','r')
xlabel('temperature')
ylabel('specific heat')
dir = sprintf('E:/week 2 matlab/%s/specific heat plot.jpg',species_name)
saveas(gcf, dir)

plot(t,h,'linewidth',3,'color','b')
xlabel('temperature')
ylabel('enthalpy')
dir2 = sprintf('E:/week 2 matlab/%s/enthalpy plot.jpg',species_name)
saveas(gcf, dir2)


plot(t,s,'linewidth',3,'color','b')
xlabel('temperature')
ylabel('entropy')
dir3 = sprintf('E:/week 2 matlab/%s/entropy plot.jpg',species_name)
saveas(gcf, dir3)


% calculation to find the molecular weigth

Q = 0;


atoms = ['H', 'C', 'O','N', 'A', 'R', '(', ')', 'S'];

atomic_mass = [1, 12, 16, 14, 40, 0, 0, 0, 0];


for j = 1:length(species_name)

    z = species_name(j) == atoms;
    ind = find(z==1);
    z = z*z';

    if z

        Q(j) = atomic_mass(ind);

    else
        atomic_mass_index = find(atoms==species_name(j-1));
        Q(j-1) = str2num(species_name(j)) * atomic_mass(atomic_mass_index);

    end
end

Molecular_weigth(n) = sum(Q)


end
EXPLAINATION OF CODE USED -
- Value of R is specified.
- THERMO.dat file is opened for reading using fopen command.
- Reading stepwise all the lines and stored it using a fgetl command.
- As there are 53 species to be read, a for loop is started upto 53 times.
- strsplit command is used to split the string of words into a cell array.
- str2num command is used to convert this string array into a definite number.
- Specifying the local temperature range.
- All the 14 coefficients are specified.
- linspace command used to create 500 values between low and high local temperature ranges.
- The expression of Cp,H & S is formulated in a for loop.
- mkdir command is used to create a folder where this file can be dumped.
- cd command is used to dump the files in that folder.
- plotting the results.
- calculating the molecular mass of the species.
- Using the saveas command to save the plots as a jpg file.
BRIEFLY EXPLAINED CODE -
-Initially we will opening the given THERMO.dat file using fopen command and then we will extract all the information provided in the file using fgetl command.
-It is observed that the data is stored in a pattern for each species which is repeated after 4 lines, this pattern is used to collect the data.
-First we we will get the global temperature by using strslplit command and then we skip some lines using the fget command.
-Now we make use of for loop command to get all temperature and coefficients that are presnt in our file.
-At the end of the line, number one specifies that it is the first line for species O and from this line, we can take the species name which is the first character and the low, high, and mid temperatures.
-It is observed that the letter E is used after every coefficient to specify the power, hence 'E' is used as the delimiter in the 'findstr' function. Using the index of the letter 'E' each coefficient of the line is found and stored.
-For getting temperature and coefficients we use finstr command inorder to input the accurate spot and specifying it so that we can get all the data.
-Now the datas which are obtanied from the file will be of string format which we need to convert into numbers by using str2num command.and by this we will get the temperature and coefficient of all the species.
-New folders are created using the mkdir function and the current folder is changed to a newly created folder using the 'cd' function. The plot is saved by function saveas where the file name and the file type is provided for saving the plots.
-Now the specific heat,enthalpy ,entropy function is calculated and gets plotted.
-The three figures are plotted using plot command and each species name is displayed using title command.And further it will named using xlabel and ylabel command.
-Now we are changing the dierectory using cd command and then we will save the plots as our images using save command.
-Finally we will again change the directory using cd command to calculate molecular weight of each species using the function program.
MOLECULAR WEIGTH -

Folder made after saving the file with species name

OUTPUT - Some random output plot
PLOT FOR O2 -
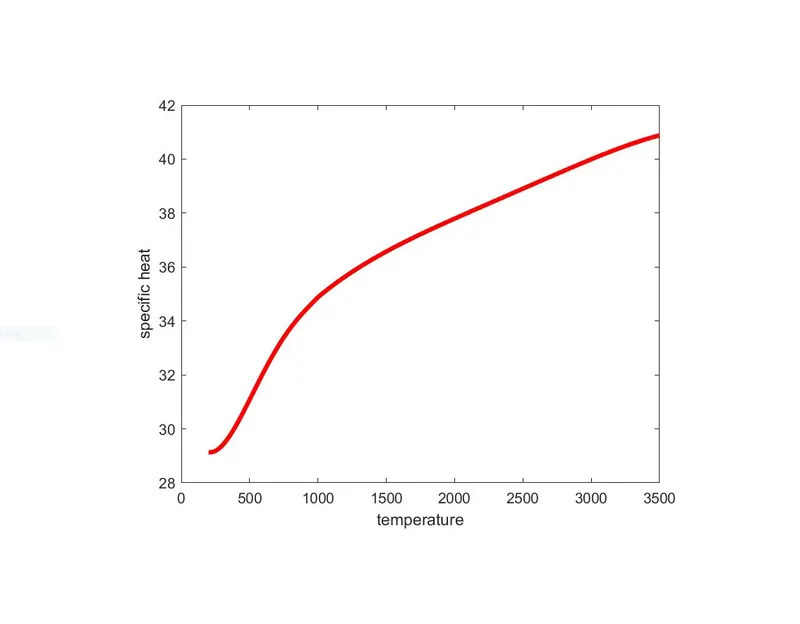
SPECIFIC HEAT VS TEMP. PLOT
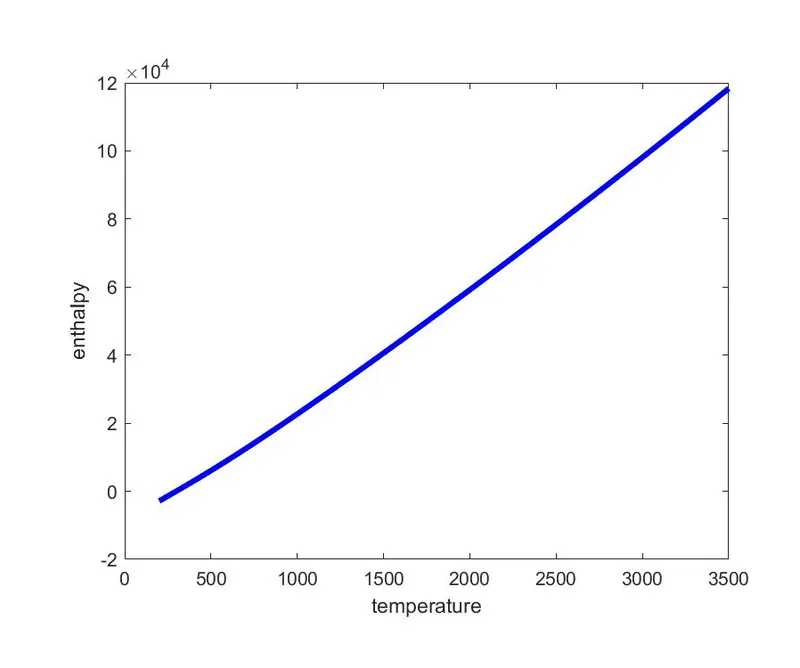
ENTHALPY VS TEMP. PLOT
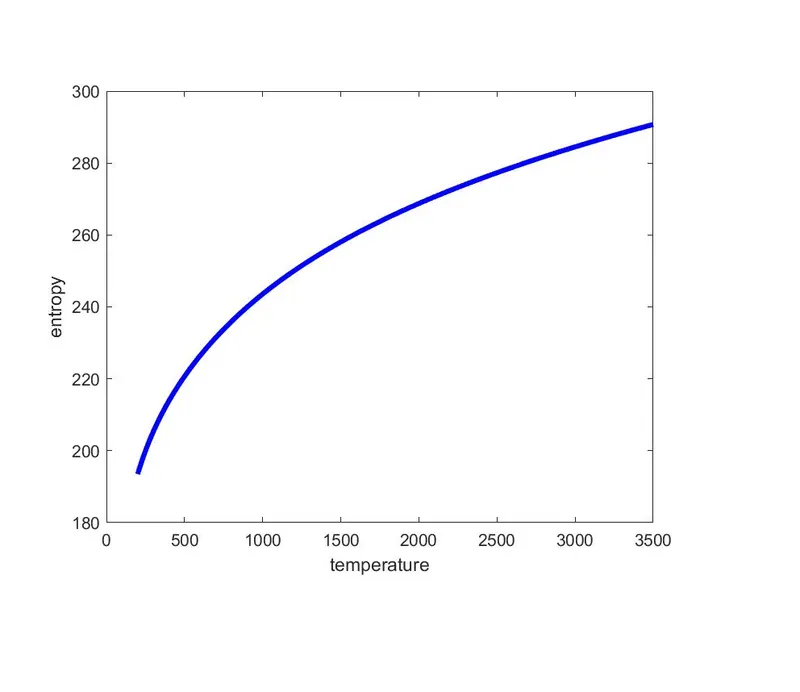
ENTROPY VS TEMP. PLOT
PLOT FOR N2 -
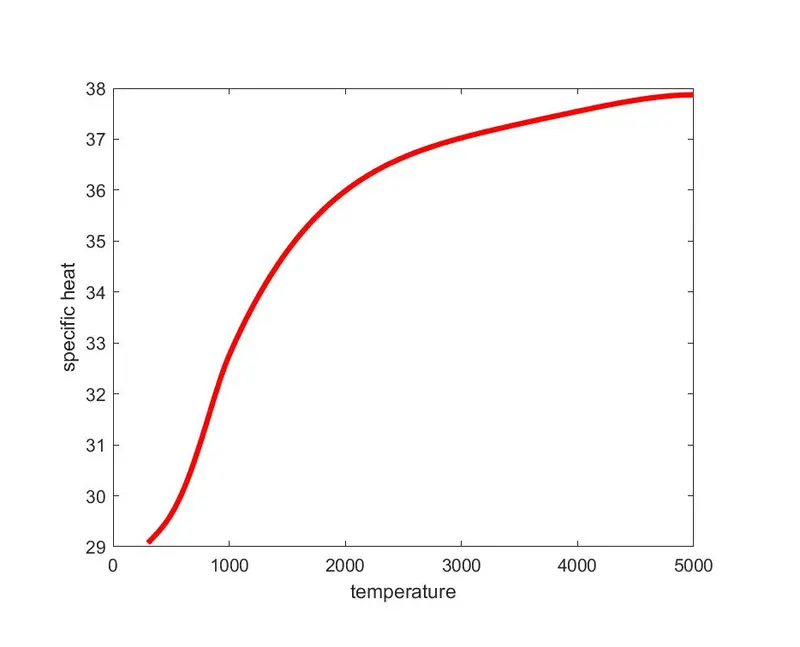
SPECIFIC HEAT VS TEMP. PLOT
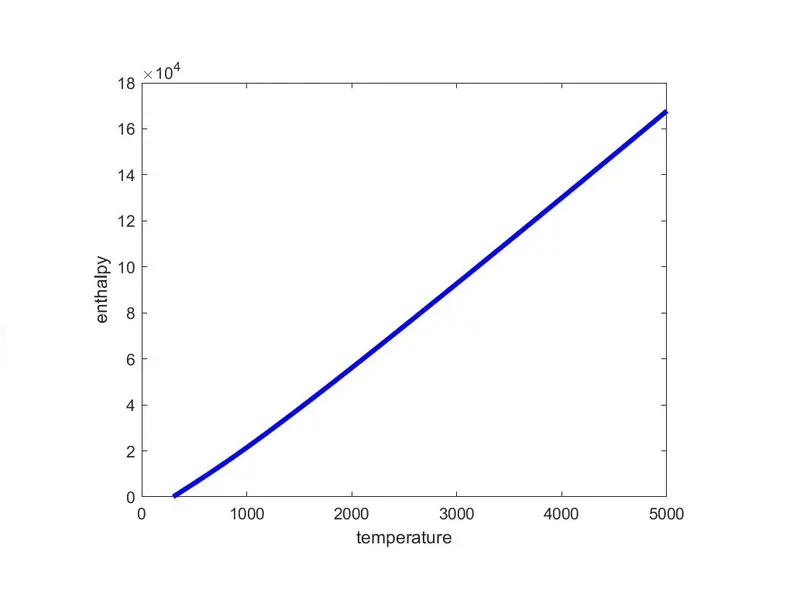
ENTHALPY VS TEMP. PLOT
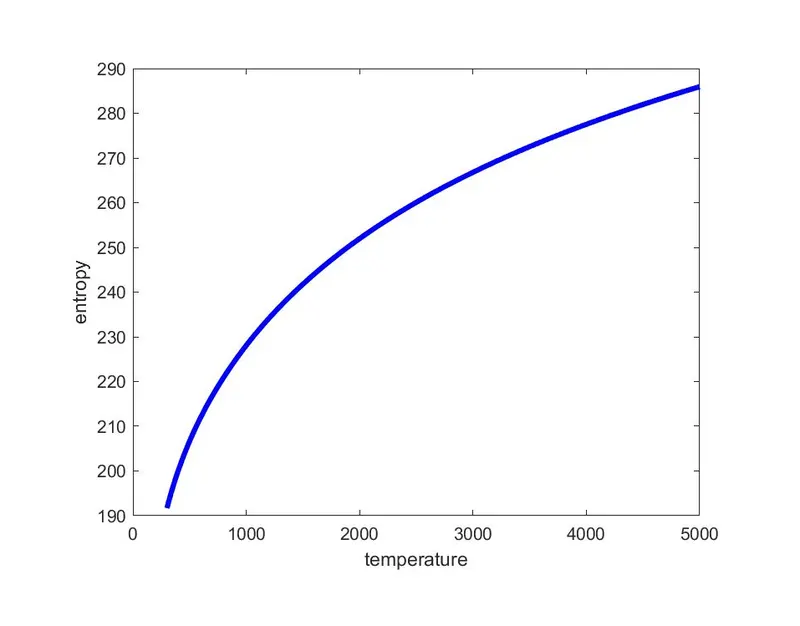
ENTROPY VS TEMP. PLOT
PLOT FOR CO2
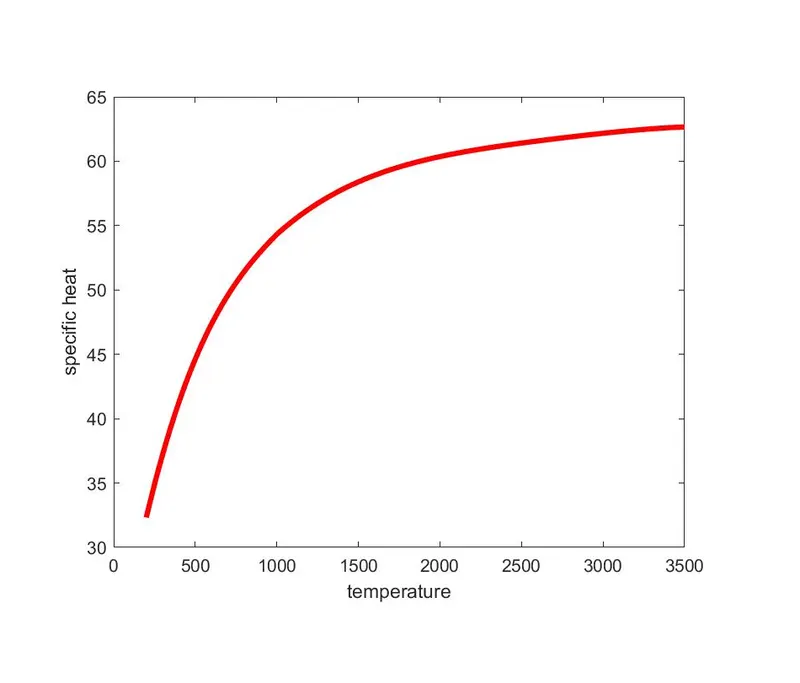
SPECIFIC HEAT VS TEMP. PLOT
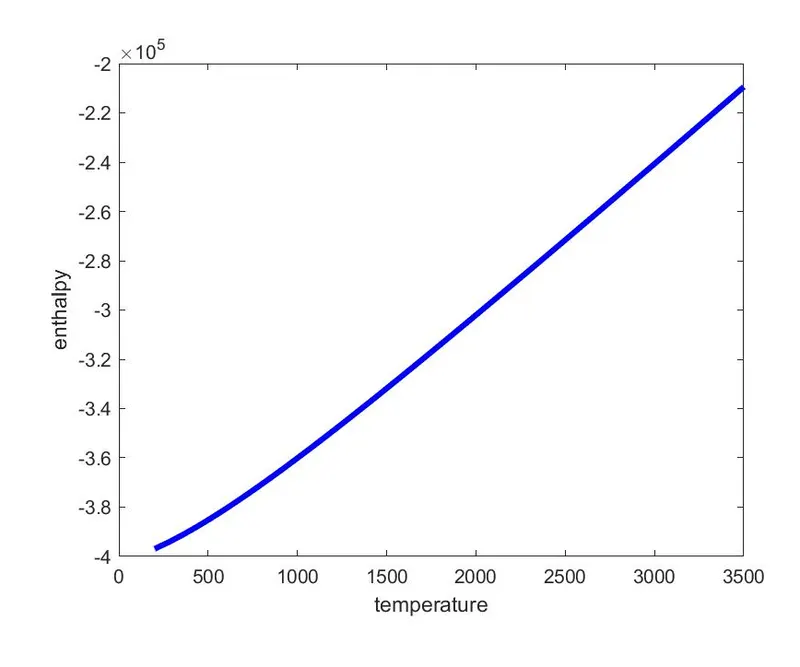
ENTHALPY VS TEMP. PLOT
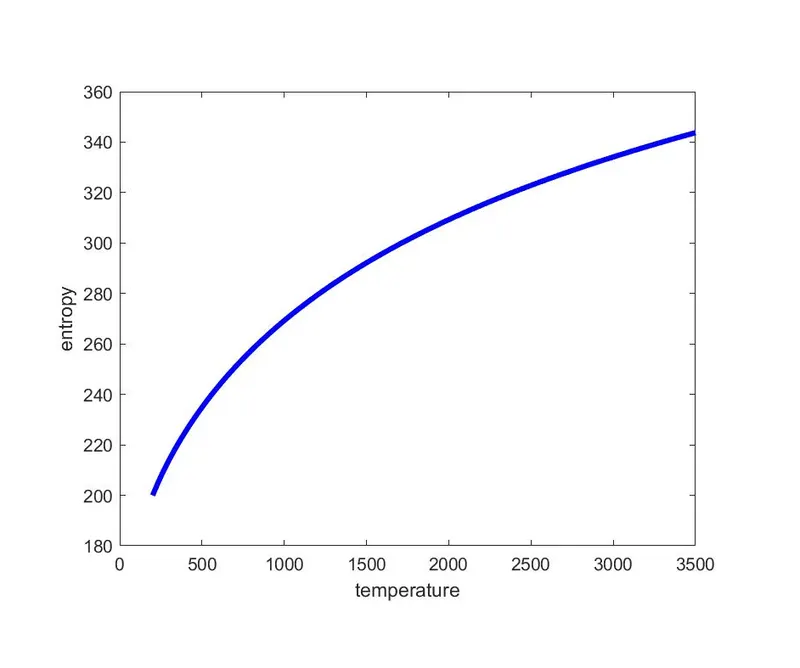
ENTROPY VS TEMP. PLOT
CONCLUSION - On successful parsing of data from NASA's Thermodynamic Data file, variation of thermodynamic properties with temperature of certain species of molecules are observed with the help of plots obtained.