Project 1 - Parsing NASA thermodynamic data
Objective:
Read the data from "THERMO.dat" file.
Creating a loop to read all local temperature.
Reading and seperating all the coefficient values.
Creating function for enthalp , entrop and specific heat by using given equation and also creating one more function to calculate molecular weight.
Plotting Specific heat vs Temperature, Enthalpy vs Temperature, Entropy vs Temperature.
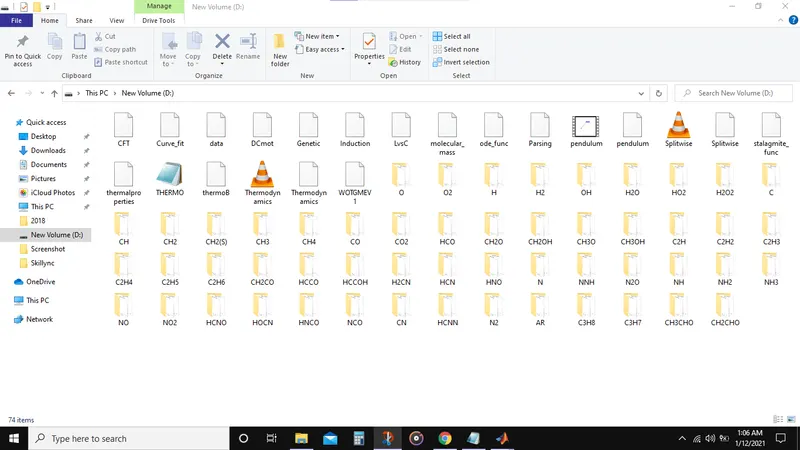
Creating directory file to save all plots in seperate folder for each species.
File Parsing:
The process of parsing can be described as reading a data file and building an in-memory model or representation of the semantic content of that data, in order to facilitate perfroming some kind of transformation on the data.
Program:
fopen is used to open the file that has to be read and then skipping the first few lines as they are heading and not usefule for the calculation.
Afterwards we take the global temperature values and store it in a string and seperate them with strsplit command.
Skipping the next 3 lines we reach to the 53 species with their 14 coefficients. deblank command is used to remove spaces between them
Then extracting local temperature from line 6 using its column range location, and using strsplit to split each local temperature using spaces between them.
Next, extract all the coefficients from line 7,8 and 9. For that,first read the 7th line and use 'findstr' to locate 'E' in each coefficients.
After extracting all the information from the file we move towards calculation
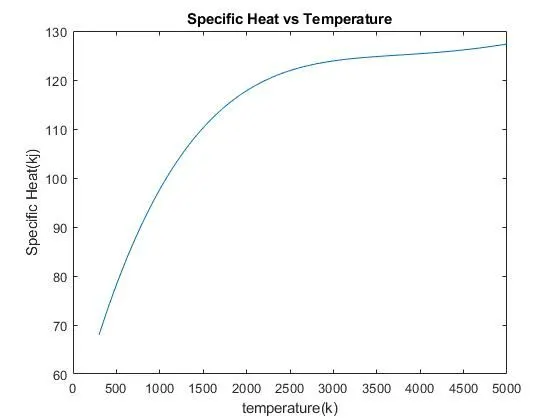
Specific Heat : The specific heat is the amount of heat per unit mass required to raise the temperature by one degree celcius.

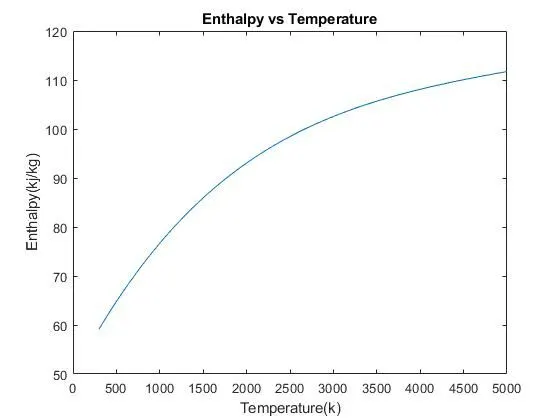
Enthalpy : The enthalpy of fluid is the property of fluid, since it consists of sum of the properties and the product of two properties it can be introduced into any problem whether the process is a flow or non-flow process.

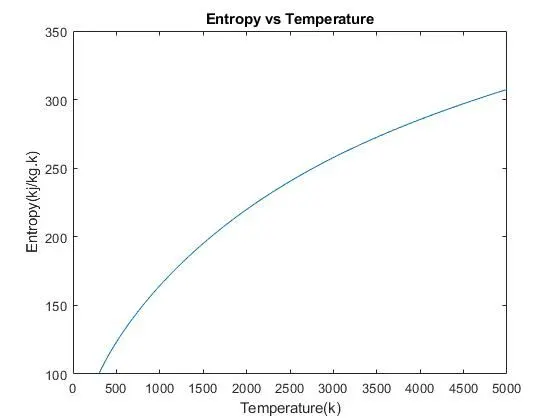
Entropy : The measure of a system's thermal energy per unit temperature that is unavailable for doing useful work. Because work is obtained from ordered molecular motion.
Entropy is also a measure of molecular disorder or randomness of a system.

Using all the equation, we write a function program.
Next Step is to write one more function program for Molecular weight
Molecular weight : Molecular weight is a measure of sum of atomic weight values of the atoms in a molecule.
At the initial point molecular weight is considered as 0.
At the end Molecular weight function is called.
Using all the calculated value we now plot all graph.
After that plots are saved by creating directory in seperate folder by each species name.
And the molecular weight is printed.
CODE:
% Reading the THERMO.dat file
f1=fopen('THERMO.dat','r');
Title=fgetl(f1);
% Global Temperatures
G_T = fgetl(f1);

%% All globbal Temperatures
A_G_T=strsplit(G_T,' ');

% Converting string to double
%G_L_T = Global low temperature
%G_M_T = Global medium temperature
%G_H_T = Global high temperature
G_L_T = str2double(A_G_T{1});
G_M_T = str2double(A_G_T{2});
G_H_T = str2double(A_G_T{3});

fgetl(f1);
fgetl(f1);
fgetl(f1);

%% Step 3
% First Species is taken to extract the local temperatures and coefficients
% them to convert to number

for i=1:53

    o_line1 = fgetl(f1);
    A=strsplit(o_line1,' ');
    L_T=strfind(o_line1,'G');
    molecule_name=o_line1(1:6)
    L_l_t=o_line1(L_T+3:55);
    L_m_t=o_line1(L_T+23:65);
    L_h_t=o_line1(L_T+13:65);

    L_l_t=str2double(L_l_t);
    L_m_t=str2double(L_m_t);
    L_h_t=str2double(L_h_t);

    o_line2=fgetl(f1);
    l1=strfind(o_line2,'E');
    cf_h_1=o_line2(1:l1(1)+3);
    cf_h_2=o_line2(l1(1)+4:l1(2)+3);
    cf_h_3=o_line2(l1(2)+4:l1(3)+3);
    cf_h_4=o_line2(l1(3)+4:l1(4)+3);
    cf_h_5=o_line2(l1(4)+4:l1(5)+3);

    o_line3=fgetl(f1);
    l2=strfind(o_line3,'E');
    cf_h_6=o_line3(1:l2(1)+2);
    cf_h_7=o_line3(l2(1)+4:l2(2)+3);
    cf_l_1=o_line3(l2(2)+4:l2(3)+3);
    cf_l_2=o_line3(l2(3)+4:l2(4)+3);
    cf_l_3=o_line3(l2(4)+4:l2(5)+3);

    o_line4=fgetl(f1);
    l3=strfind(o_line4,'E');
    cf_l_4=o_line4(1:l3(1)+2);
    cf_l_5=o_line4(l3(1)+4:l3(2)+3);
    cf_l_6=o_line4(l3(2)+4:l3(3)+3);
    cf_l_7=o_line4(l3(3)+4:l3(4)+3);

    % Step 4 converting string to cell
    hf1=str2double(cf_h_1);
    hf2=str2double(cf_h_2);
    hf3=str2double(cf_h_3);
    hf4=str2double(cf_h_4);
    hf5=str2double(cf_h_5);
    hf6=str2double(cf_h_6);
    hf7=str2double(cf_h_7);
    lf1=str2double(cf_l_1);
    lf2=str2double(cf_l_2);
    lf3=str2double(cf_l_3);
    lf4=str2double(cf_l_4);
    lf5=str2double(cf_l_5);
    lf6=str2double(cf_l_6);
    lf7=str2double(cf_l_7);

    % To create folder with molecule name
    mkdir(molecule_name);

    %% Step 5 Cp,H,S
    T = linspace(L_l_t,L_h_t,500);
    t_mid=1000;
    R=8.314;
    [Cp,H,S]=thermalproperties(L_l_t,L_h_t,t_mid,T,R,lf1,lf2,lf3,lf4,lf5,lf6,lf7,hf1,hf2,hf3,hf4,hf5,hf6,hf7);

    %% Step 6 plotting graph
    figure(1);
    plot(T,Cp)
    xlabel('temperature(k)')
    ylabel('Specific Heat(kj)')
    title('Specific Heat vs Temperature')

    figure(2)
    plot(T,S)
    xlabel('Temperature(k)')
    ylabel('Entropy(kj/kg.k)')
    title('Entropy vs Temperature')

    figure(3)
    plot(T,H)
    xlabel('Temperature(k)')
    ylabel('Enthalpy(kj/kg)')
    title('Enthalpy vs Temperature')

    % Inorder to save the generated images into test
    cd(molecule_name)

    saveas(1,'Cp.png');
    saveas(2,'S.png');
    saveas(3,'H.png');
    % Going back to the directory
    cd ..

    %% Step 7 Calculating Molecular Weight of the species
    MW=molecular_mass(molecule_name)

end
FUNCTION FOR MOLECULAR WEIGHT:
function MW=molecular_mass(molecule_name)
atoms={'H','C','N','O','AR'};
Atomic_weight=[1 12 14 16 40];
MW=0;
for i=1:length(molecule_name)
    for j=1:length(Atomic_weight)
        if(strcmp(molecule_name(i),atoms(j))==1)
            MW=MW+Atomic_weight(j);
            p=j;
            break
        end
    end
    n=str2double(molecule_name(i));
    if (n>1)
        MW=MW+(Atomic_weight(p)*(n-1));
    end
end
end
RESULTS:
SCREENSHOT OF THE FOLDER:
ERRORS:
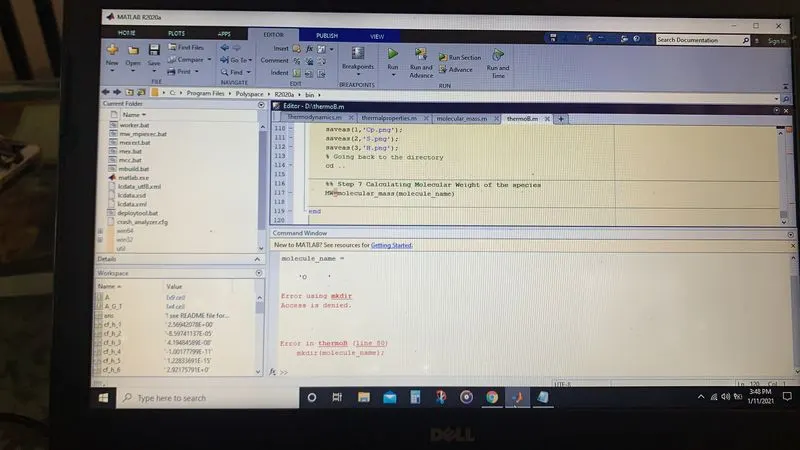
Since the path of the folder was not changed, error in making the directory.