Project 1 - Parsing NASA thermodynamic data
AIM: Parsing NASA THERMO data file through MATLAB.
OBJECTIVES:
1) Write a function that extracts the 14 co-efficients form NASA THERMO data file and calculates the enthalpy, entropy and specific heats for all the species in the data file.
2) Plot the Cp, Enthalpy and Entropy for the temperature range (low temperature : high temperature) specific for each species.
3) Save the plots as images with appropriate names and dump them in separate folders for each species with a suitable name. All these should be generated automatically.
4) Calculate the molecular weight of each species and display it in the command window.
5) The main program that just take the "THERMO.dat" file as an input and generate Cp, H and S plots.
THEORY:
PROGRAMS:
1) A program to sort temperature and extract 14 co-efficients from NASA THERMO data file.
close all
clear all
clc


% Sorting header
f1=fopen('THERMO.dat','r');
file_name=fgetl(f1);
t_line=fgetl(f1);
A=strsplit(t_line,' ');

% Setting temprature limits
global_low_temp = str2num(A{2});
global_mid_temp = str2num(A{3});
global_high_temp = str2num(A{4});


% For ignoring the comments
for i=1:3
    comments=fgetl(f1);
end


for i=1:53

    %extracting species name
    species =fgetl(f1);
    species_name = species(1:6);

    %extracting coefficients from first line
    line_1 = fgetl(f1);
    l1 = strfind(line_1,'E')
    a1 = str2num(line_1(1:(l1(1)+3)));
    a2 = str2num(line_1(l1(1)+4:(l1(2)+3)));
    a3 = str2num(line_1(l1(2)+4:(l1(3)+3)));
    a4 = str2num(line_1(l1(3)+4:(l1(4)+3)));
    a5 = str2num(line_1(l1(4)+4:(l1(5)+3)));

    %extracting coefficients from second line
    line_2 = fgetl(f1);
    l2 = strfind(line_2,'E')
    a6 = str2num(line_2(1:(l2(1)+3)));
    a7 = str2num(line_2(l2(1)+4:(l2(2)+3)));
    a8 = str2num(line_2(l2(2)+4:(l2(3)+3)));
    a9 = str2num(line_2(l2(3)+4:(l2(4)+3)));
    a10 = str2num(line_2(l2(4)+4:(l2(5)+3)));

    %extracting coefficients from second line
    line_3 = fgetl(f1);
    l3 = strfind(line_2,'E')
    a11 = str2num(line_3(1:(l3(1)+3)));
    a12= str2num(line_3(l3(1)+4:(l3(2)+3)));
    a13= str2num(line_3(l3(2)+4:(l3(3)+3)));
    a14= str2num(line_3(l3(3)+4:(l3(4)+3)));

end
Explanation:
Above code is used to define temperatures and read header data from given data file by using following commands,
1.fopen command is used to open THERMO data file
2.fgetl command is used to get new line
3.strsplit command is used to split given line
4.str2num command is used to convert string into number
in order to extract coefficients we use 'E' as a seprator i.e 3 value after E we get a new coeffiecient.
2) Function to calculate Enthalpy(h), Entropy(s) and Specific heat(Cp) and plot their variation with Temperature(T).
Governing eqn:-
where, R=universal gas constant whose value is 8.134 J⋅K−1⋅mol−1
%function to calculta Cp,h,s


function[Cp,h,s]=parsing_coeff(a1,a2,a3,a4,a5,a6,a7,a8,a9,a10,a11,a12,a13,a14,T)
R=8.134;

for j=1:length(T)
    if T(j)<1000

       Cp=(a1 + a2.*T + a3.*T.^2 + a4.*T.^3 + a5.*T.^4).*R;
       h=(a1 + (a2.*T)./2 + (a3.*T.^2)./3 + (a4.*T.^3)./4 + (a5.*T.^4)./5 + (a6./T)).*R.*T;
       s=(a1.*log(T) + a2.*T + (a3.*T.^2)./2 + (a4.*T.^3)./3 + (a5.*T.^4)./4 + a7).*R;

    else
        Cp=(a8 + a9.*T + a10.*T.^2 + a11.*T.^3 + a12.*T.^4).*R;
       h=(a8 + (a9.*T)/2 + (a10.*T.^2)/3 + (a11.*T.^3)/4 + (a12.*T.^4)/5 + (a13./T)).*R.*T;
       s=(a8.*log(T) + a9.*T + (a10.*T.^2)/2 + (a11.*T.^3)/3 + (a12.*T.^4)/4 + a14).*R;

    end
end
endExplanation:
Here we use given formula to calculate h,s and Cp for all temperature range.
3) Function to calculate molecular weight of all species.
% Molecular weight of the species


function[Molecular_weight]=mol_wt(species_name)
species = upper(species_name)
constituents={'H','C','N','O','A','S'};
atomic_weight = [1 12 14 16 40 32];

Molecular_weight =0;

for j=1:length(species_name)
    for k=1:length(constituents)
        if strcmp(species(j),constituents(k))
            Molecular_weight = Molecular_weight + atomic_weight(k);
            u=k;
        end
    end


    n=str2double(species(j));
    if n>1
        Molecular_weight = Molecular_weight + atomic_weight(u).*(n-1);
    end
end
end
Explanation:
Here we use the Ideology that all species made up of given constituents so to calculate molecular weight of each species we split it into its constituens and comapre it with constituent arrar.
4) The main program to generate plot of enthalpy, entropy and specific heat with temperature variation for all species.
close all
clear all
clc


%header data
f1=fopen('THERMO.dat','r');
file_name=fgetl(f1);
t_line=fgetl(f1);
A=strsplit(t_line,' ');

global_low_temp = str2num(A{2});
global_mid_temp = str2num(A{3});
global_high_temp = str2num(A{4});


%for ignoring the comment
for i=1:3
    comments=fgetl(f1);
end


for i=1:53
% main program
    %extracting species name
    species =fgetl(f1);
    species_name = species(1:6);

    %extracting coefficients from first line
    line_1 = fgetl(f1);
    l1 = strfind(line_1,'E')
    a1 = str2num(line_1(1:(l1(1)+3)));
    a2 = str2num(line_1(l1(1)+4:(l1(2)+3)));
    a3 = str2num(line_1(l1(2)+4:(l1(3)+3)));
    a4 = str2num(line_1(l1(3)+4:(l1(4)+3)));
    a5 = str2num(line_1(l1(4)+4:(l1(5)+3)));

    %extracting coefficients from second line
    line_2 = fgetl(f1);
    l2 = strfind(line_2,'E')
    a6 = str2num(line_2(1:(l2(1)+3)));
    a7 = str2num(line_2(l2(1)+4:(l2(2)+3)));
    a8 = str2num(line_2(l2(2)+4:(l2(3)+3)));
    a9 = str2num(line_2(l2(3)+4:(l2(4)+3)));
    a10 = str2num(line_2(l2(4)+4:(l2(5)+3)));

    %extracting coefficients from second line
    line_3 = fgetl(f1);
    l3 = strfind(line_2,'E')
    a11 = str2num(line_3(1:(l3(1)+3)));
    a12= str2num(line_3(l3(1)+4:(l3(2)+3)));
    a13= str2num(line_3(l3(2)+4:(l3(3)+3)));
    a14= str2num(line_3(l3(3)+4:(l3(4)+3)));


    % Creating folder for each species
    mkdir(['C:\matlab save files\PROJECTS\File Parsing\Species\',species_name]);


    T = linspace(global_low_temp,global_high_temp,500);

    %calling Thermodynamic function
    [Cp,h,s]=parsing_coeff(a1,a2,a3,a4,a5,a6,a7,a8,a9,a10,a11,a12,a13,a14,T)


    %Plotting graphs

    % 1) Temperature vs Entropy
    figure(1)
    plot(T,s,'linewidth',3,'color','r')
    title(species_name)
    xlabel('Temperature')
    ylabel('Entropy')

    % 2) Temperature vs Enthalpy
    figure(2)
    plot(T,h,'linewidth',3,'color','b')
    title(species_name)
    xlabel('Temperature')
    ylabel('Enthalpy')

    % 3) Temperature vs Specific heat
    figure(3)
    plot(T,Cp,'linewidth',3,'color','g')
    title(species_name)
    xlabel('Temperature')
    ylabel('Specific heat')


    directory=(['C:\matlab save files\PROJECTS\File Parsing\Species\',species_name]);
    cd(directory)


    %saving plots
    saveas(1,'Entropy.jpg')
    saveas(2,'Enthalpy.jpg')
    saveas(3,'Specific heat.jpg')
    cd('C:\matlab save files\PROJECTS\File Parsing')

    fprintf(species_name)
    Molecular_weight=mol_wt(species_name)

end
fclose(f1);
Explanation:
To save plot of Enthalpy,Entropy and Specific heat for each species we use 'mkdir' command
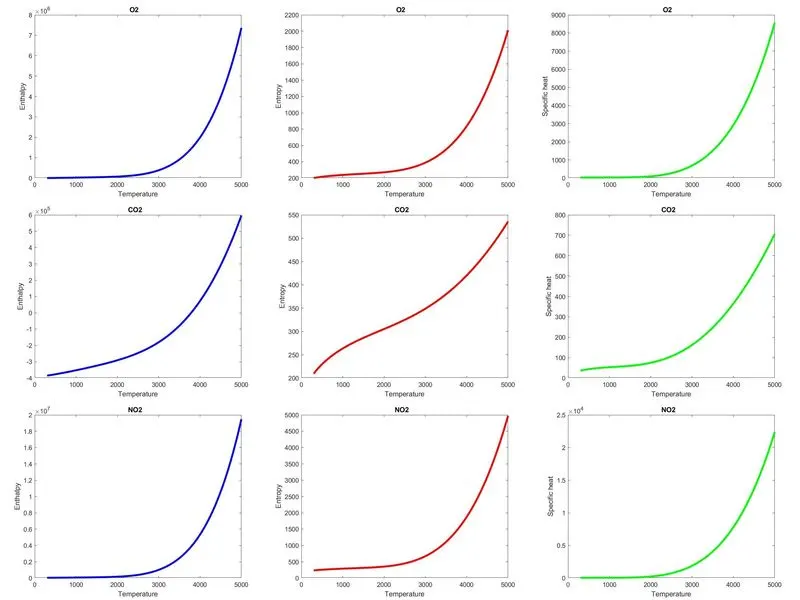
Plot of Enthalpy, Entropy and Specific heat curve of O2,CO2 and NO2 :-