Project 1 - Parsing NASA thermodynamic data
PARSING THE NASA THERMODYNAMIC DATA AND EVALUATING THE PROPERTIES
AIM :
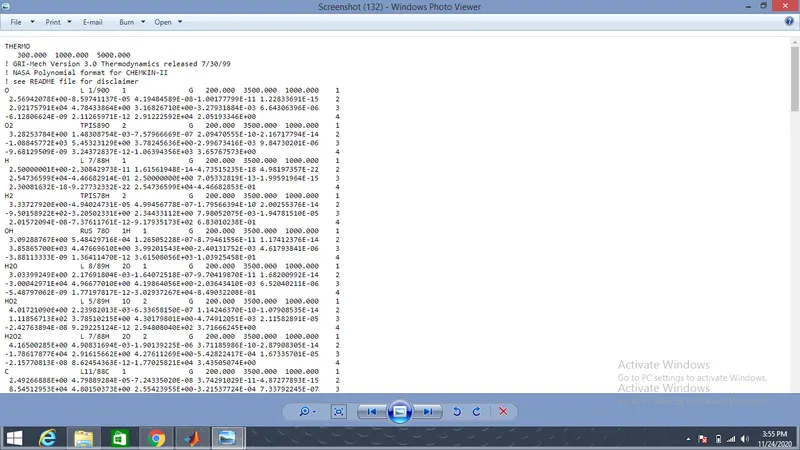
The vision of this project is to parse the given thermodynamic data and use the polynomial equation from it to evaluate the thermodynamic properties and also calculate the molecular weight of the each species present in those data.
PARSING :
In general the term parsing mainly used to disintegrate the given sort of data into a convenient, readable thing and that data can be used to evaluate some particuar values or graphs can be plotted by utilising those information.
Example : In our daily life if we are in a state of non-understandable of some big things we divide the things into easy things and in a particular order to finish the things easily and effortlessly and that is also can be called as parsing and here we does it in a computer understandable code.
In this challange or project we have given the unparsed NASA Thermodynamic data as a mixed set of data that cannot be visualised in a particular format and here the work is to parse the given data i.e, seperate these set of mixed data into a perfect readable data, then use the coefficients in the data and using those coefficients we can calculate the thermodynamic properties such as Specific heat(Cp), Enthalpy(E), Entropy(S).
There are also some of the species that are included in the data for which molecular weight should be found out.
PROCEDURE :
The process in here we are going to do is quiet simple i.e, first we are going to import and open the given NASA data file with fopen command and inside the command we give file name and read the file.
Then to skip the file or save the particular line we extract that line using the command called fgetl. So that line can be assigned to some variable.
After saving the line to some variable we can use the line desirably.
The formula for calculating specific heat(Cp), Enthalpy(E), Entropy(S) is given below

MAIN CODE :
clear all
close all
clc

%initial data
data = fopen('THERMO.dat','r');
header_line = fgetl(data);
temp_line = fgetl(data);
A = split(temp_line);
G_low_temp = str2double(A{2});
G_mid_temp = str2double(A{3});
G_high_temp = str2double(A{4});
global_temp = [G_low_temp,G_mid_temp,G_high_temp];
fgetl(data);
fgetl(data);
fgetl(data);
%defining the input values for calculating
%heat(Cp),enthalpy(H),entropy(s)

%universal gas constant R(kj/kg.mole.k)


for i = 1:53
species_name = fgetl(data); %i.e, molecule name
F = strsplit(species_name,' '); %splits the string into elements
B = length(F);
molecule = F{1};
L_lowtemp = str2double(F{B-3}); %converts the string to a value
L_hightemp = str2double(F{B-2});
L_midtemp = str2double(F{B-1});
Local_temp = [L_lowtemp,L_midtemp,L_hightemp];
T = linspace(L_lowtemp,L_hightemp,1500);
Coeff_line1 = fgetl(data);
C = strfind(Coeff_line1,'E'); %finds the particular location value of a string
a1 = str2double(Coeff_line1(1:C(1)+3));
a2 = str2double(Coeff_line1(C(1)+4:C(2)+3));
a3 = str2double(Coeff_line1(C(2)+4:C(3)+3));
a4 = str2double(Coeff_line1(C(3)+4:C(4)+3));
a5 = str2double(Coeff_line1(C(4)+4:C(5)+3));
Coeff_line2 = fgetl(data);
D = strfind(Coeff_line2,'E');
a6 = str2double(Coeff_line2(1:D(1)+3));
a7 = str2double(Coeff_line2(D(1)+4:D(2)+3));
a8 = str2double(Coeff_line2(D(2)+4:D(3)+3));
a9 = str2double(Coeff_line2(D(3)+4:D(4)+3));
a10 = str2double(Coeff_line2(D(4)+4:D(5)+3));
Coeff_line3 = fgetl(data);
K = strfind(Coeff_line3,'E');
a11 = str2double(Coeff_line3(1:K(1)+3));
a12 = str2double(Coeff_line3(K(1)+4:K(2)+3));
a13 = str2double(Coeff_line3(K(2)+4:K(3)+3));
a14 = str2double(Coeff_line3(K(3)+4:K(4)+3));

%calculation of specific heat, enthalpy, entropy by given formulas
R = 8.314;
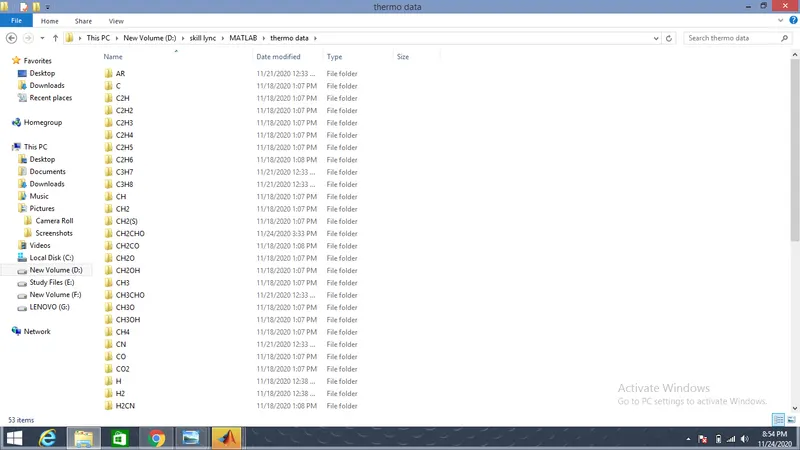
mkdir(['D:\skill lync\MATLAB\thermo data\',molecule]); %creating the directory with a folder name
for j = 1:length(T)
if T(j)>L_midtemp

Cp(j) = (a1+a2*T(j)+a3*(T(j)^2)+a4*(T(j)^3)+a5*(T(j)^4))*R;

H(j) = (a1+a2*(T(j)/2)+a3*((T(j)^2)/3)+a4*((T(j)^3)/4)+a5*((T(j)^4)/5)+a6/T(j))*R*T(j);

S(j) = (a1*log(T(j))+a2*T(j)+a3*((T(j)^2)/2)+a4*((T(j)^3)/3)+a5*((T(j)^4)/4)+a7)*R;

else

Cp(j) = (a8+a9*T(j)+a10*(T(j)^2)+a11*(T(j)^3)+a12*(T(j)^4))*R;

H(j) = (a8+a9*(T(j)/2)+a10*((T(j)^2)/3)+a11*((T(j)^3)/4)+a12*((T(j)^4)/5)+a13/T(j))*R*T(j);

S(j) = (a8*log(T(j))+a9*T(j)+a10*((T(j)^2)/2)+a11*((T(j)^3)/3)+a12*((T(j)^4)/4)+a14)*R;

end
end

%plotting the graphs for specific heat, enthalpy, entropy against temperature

figure(1)
plot(T,Cp,'color','r');
xlabel('temperature');
ylabel('specific heat');
title('temperature Vs specific heat');

figure(2)
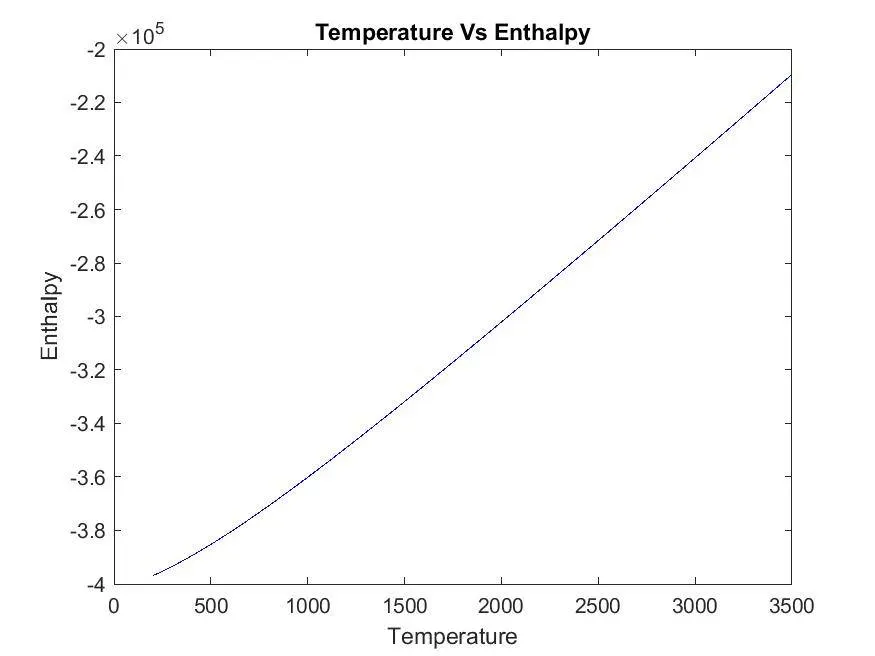
plot(T,H,'color','b');
xlabel('Temperature');
ylabel('Enthalpy');
title('Temperature Vs Enthalpy');

figure(3)
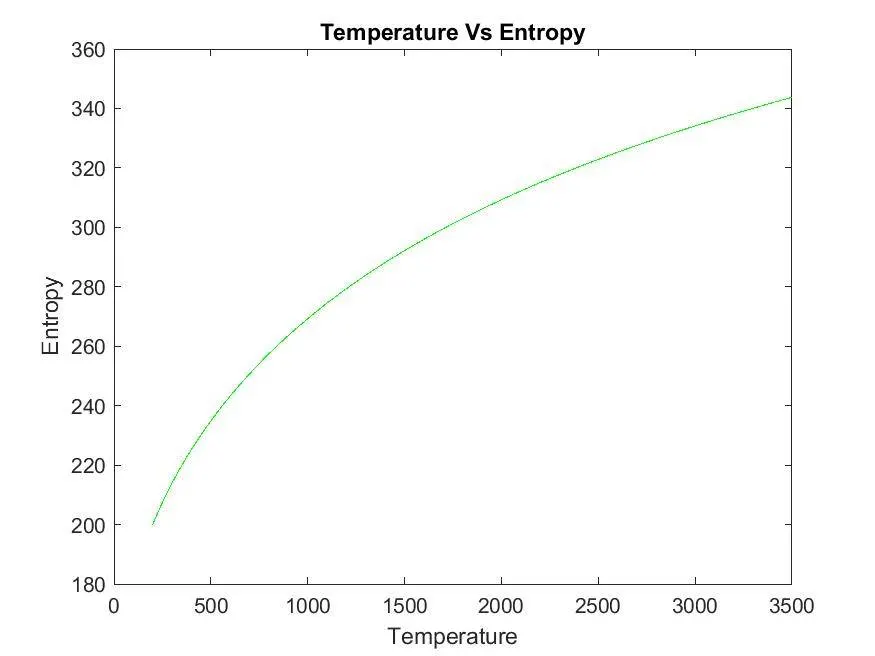
plot(T,S,'color','g');
xlabel('Temperature');
ylabel('Entropy');
title('Temperature Vs Entropy');

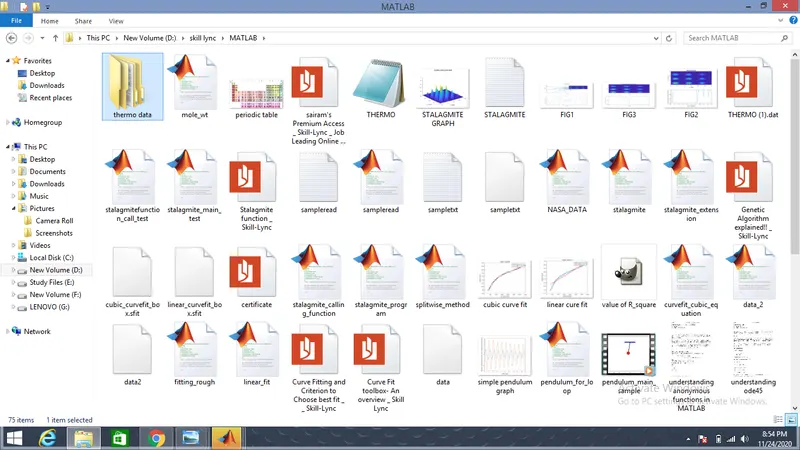
cd(['D:\skill lync\MATLAB\thermo data\',molecule])   %saving the graphs as images into the created folder

saveas(1,'specific heat','jpg');
saveas(2,'Enthalpy','jpg');
saveas(3,'Entropy','jpg');


%creating the FUNCTION CODE for calculating molecular weight

M = mole_wt(molecule);

end
FUNCTION CODE FOR MOLECULAR WEIGHT :
function M = mole_wt(molecule)

atoms = ['H','C','N','O','AR'];
atom_mass = [1 12 14 16 40];
M = 0;

for i = 1:length(molecule)
    for j = 1:length(atom_mass)
        if strcmp(molecule(i),atoms(j))
        M = M+atom_mass(j);
        q = j;
        end
    end
        n = str2double(molecule(i));
        if n>1
            M = M+atom_mass(q)*(n-1);
        end
end
sprintf('Molecular weight of %s:%f',molecule,M)
end
CODE EXPLAINATION :
1. In this code the primary given data file should be opened through the fopen command and include 'r' inside the command as (data = fopen('THERMO.dat','r') so that the file is ready to read.
2. Then the command fgetl is used to go to the next line in the given data file.
3. After that the local temperature is assigned to a variable by going to that line using fgetl command and for storing them in the variable as a number. The string value is converted to a value by using str2double command.
4. Then after that we are going to skip the unwanted lines and then the next comes is species line which is stored in a seperate variable and in this we should seperate the species in the first six places and also the global temperature ranges into another three variables that is used in the future.
5. Now the next line onwards there consists a coefficients which are required in the polynomial equations to calculate the Specific heat(Cp), Enthalpy(E), Entropy(S) properties using the for loop which is written in the above code.
6. So the temperature and coefficient values in the properties calculation formula will be extracted using the above for loop so that all property values will be obtained.
7. After getting the values graphs should be plotted for each species between the temperatures and Cp, H, and S.
8. Then the seperate directory should be created to save all the plots in that folder.
8. At finally the molecular weight for each species should be calculated and should be displayed in the command window and the code for molecular weight is written above.
Outputs :
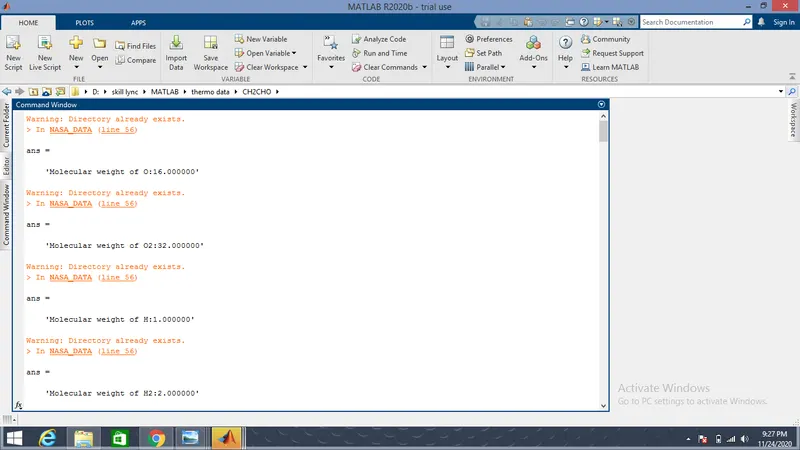
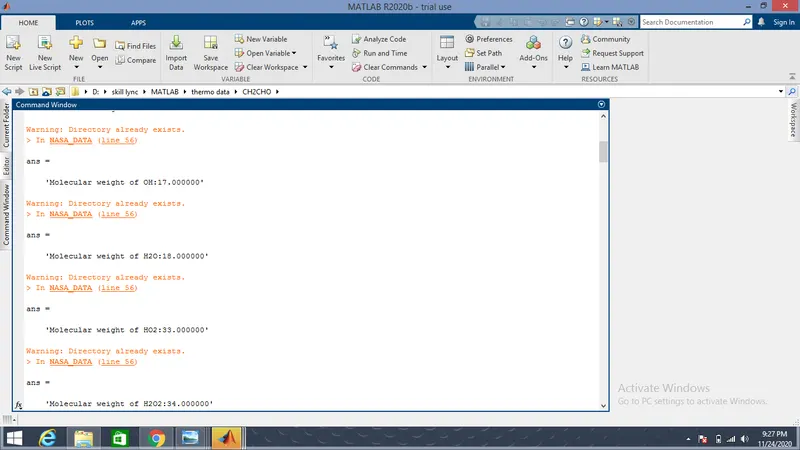
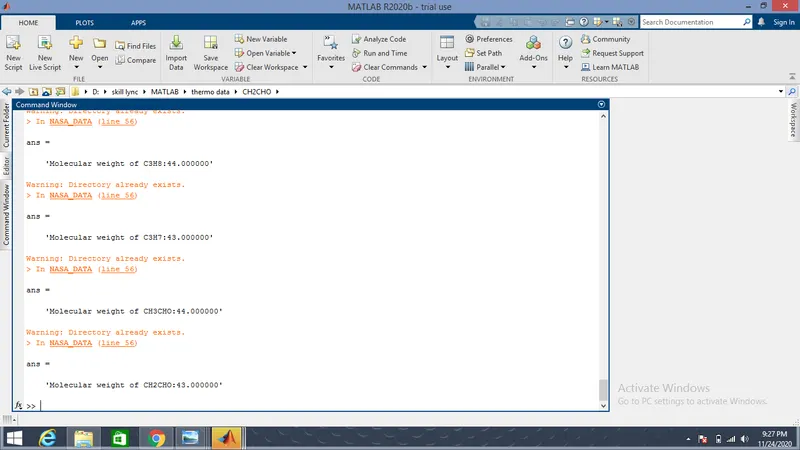
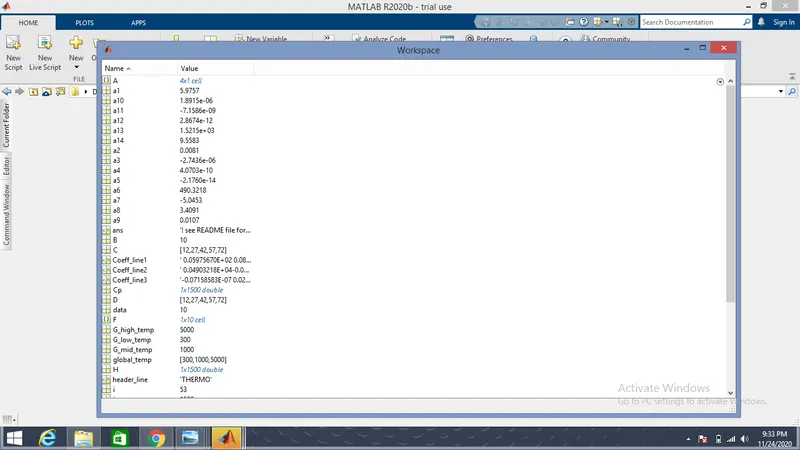
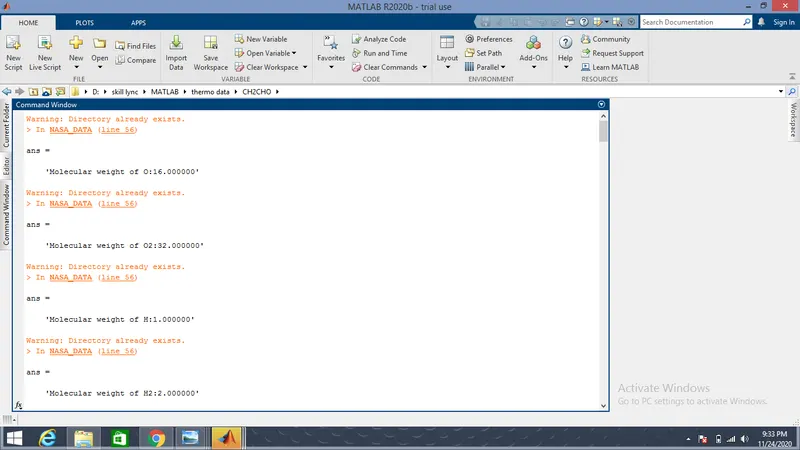
The outputs of the above code can be seen in the workspace and the molecular weights of each species can be seen in the command window as shown in the below image.
The molecular weights of some of the species which are printed in the command window were shown in the below image :
PLOTS :
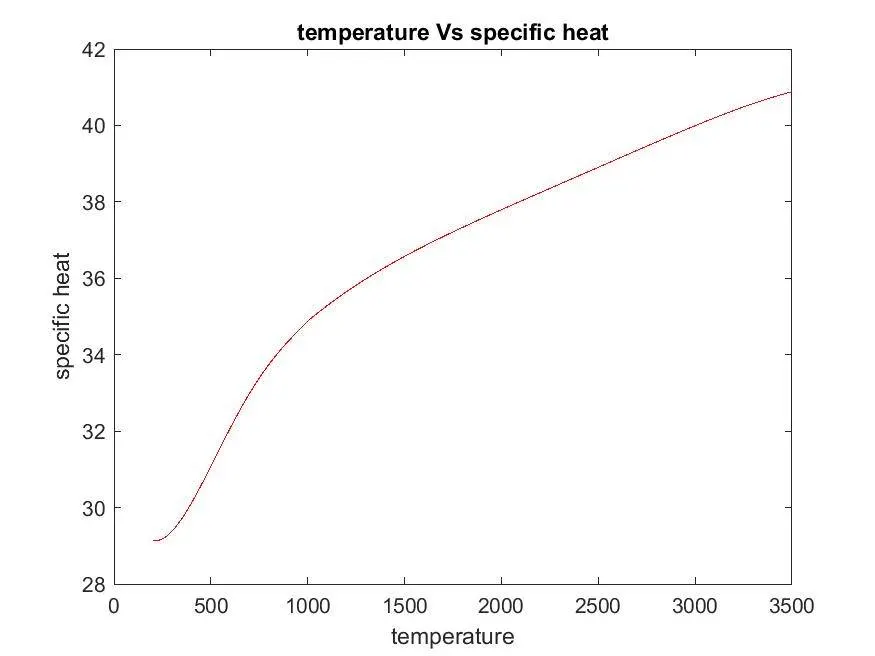
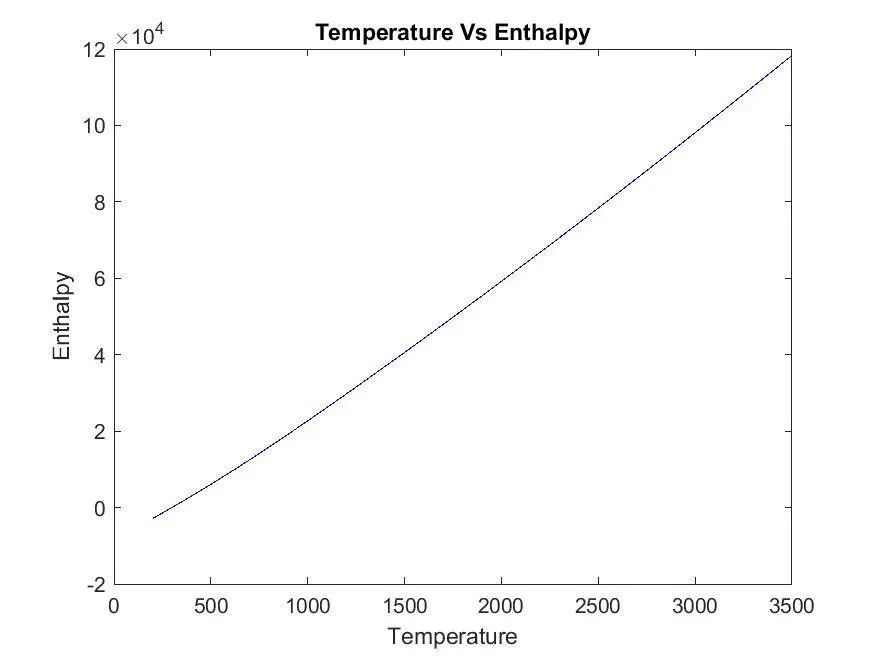
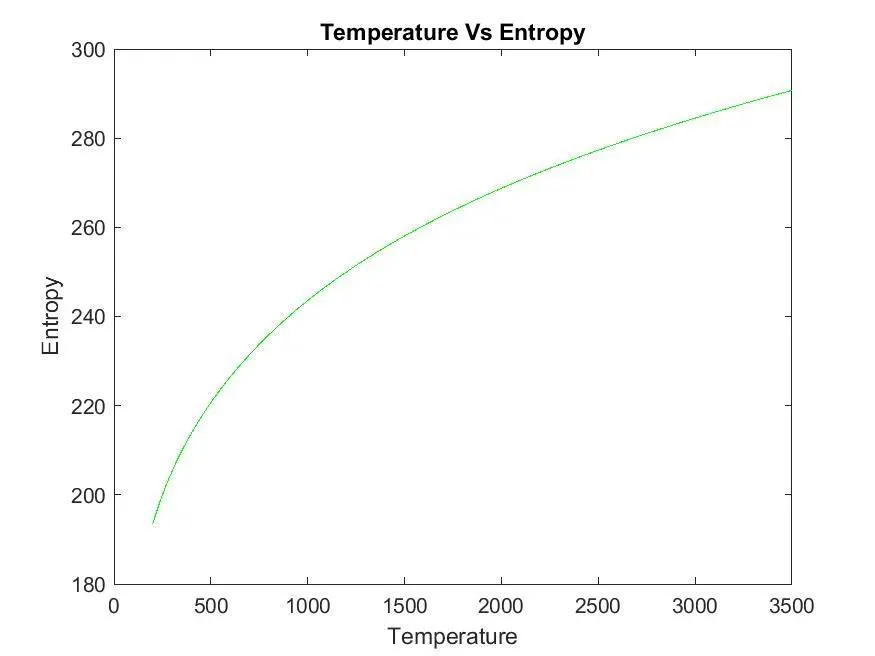
PLOTS FOR O2, N2 and CO2
O2 Graphs :
Temperature Vs specific heat Temperature Vs Enthalpy Temperature Vs Entropy
N2 Graphs :
Temperature Vs specific heat Temperature Vs Enthalpy Temperature Vs Entropy
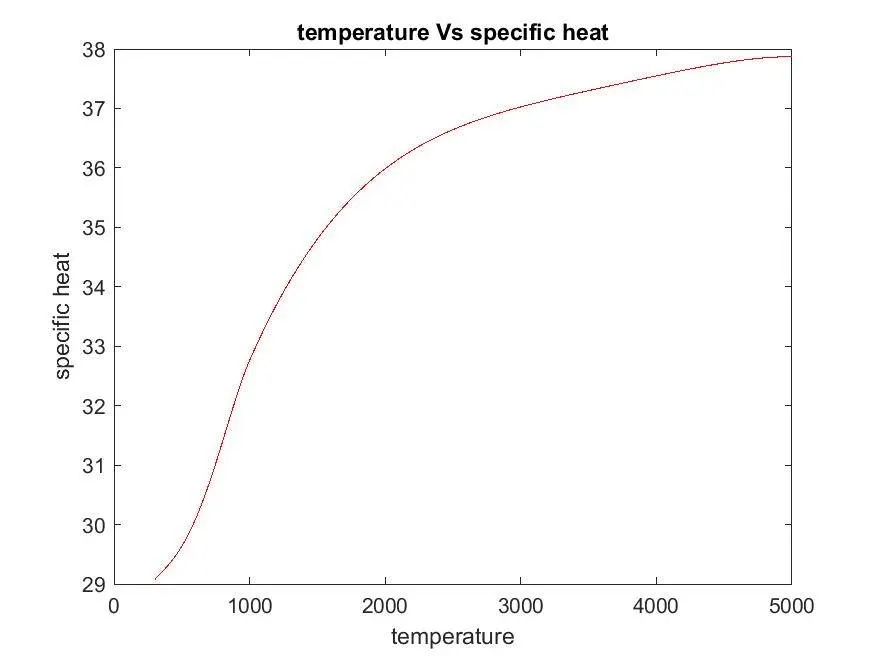
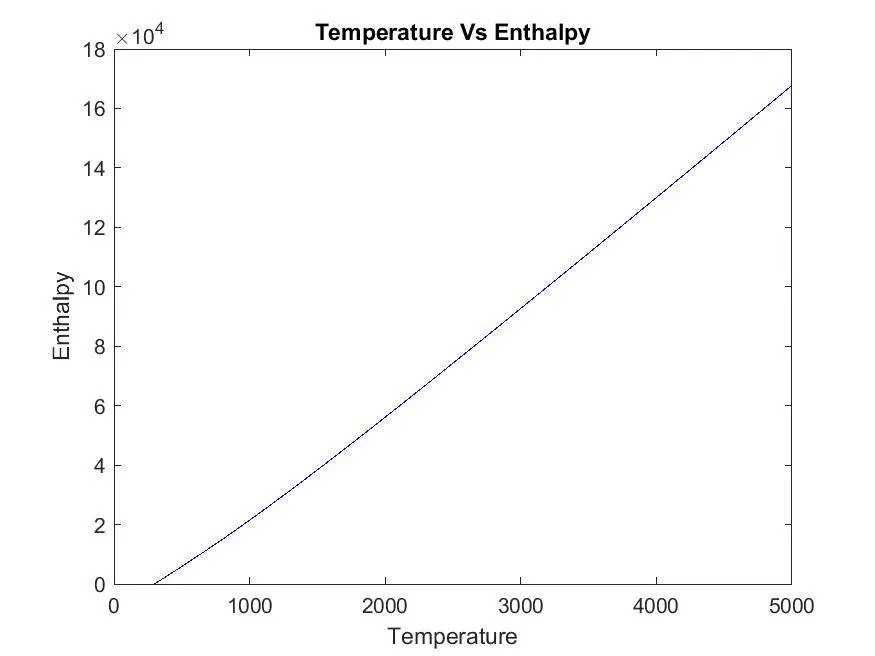
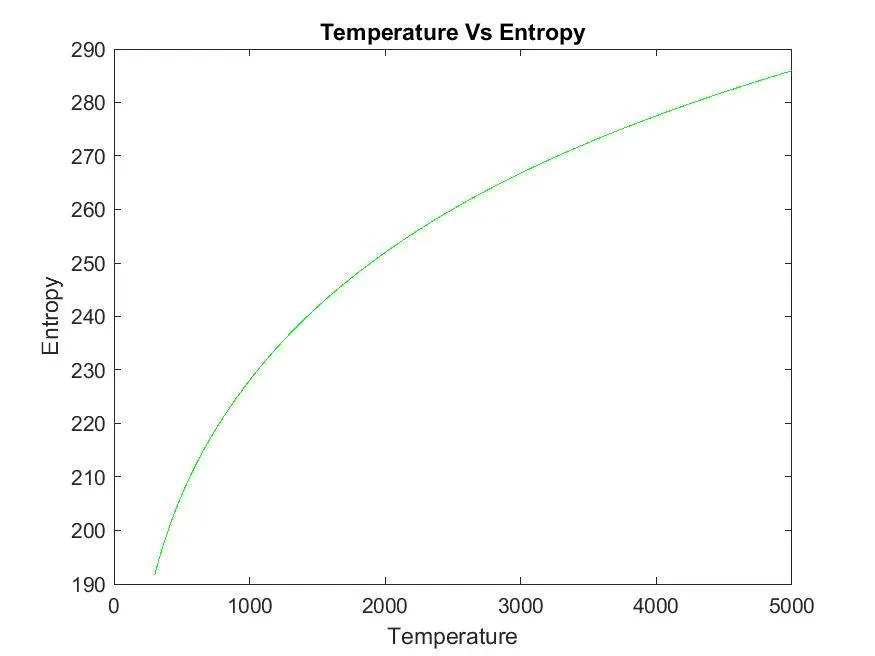
CO2 Graphs :
Temperature Vs specific heat Temperature Vs Enthalpy Temperature Vs Entropy
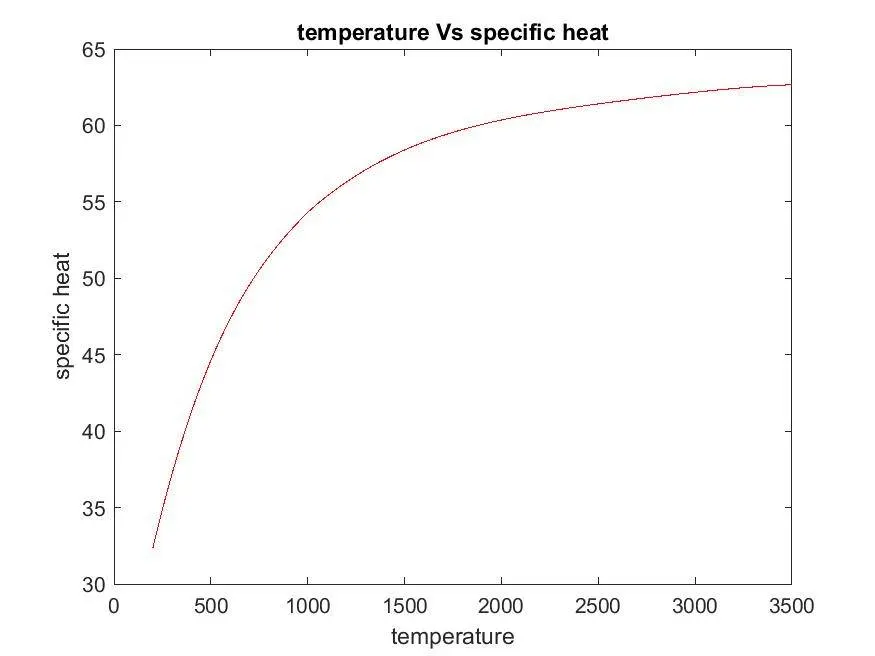
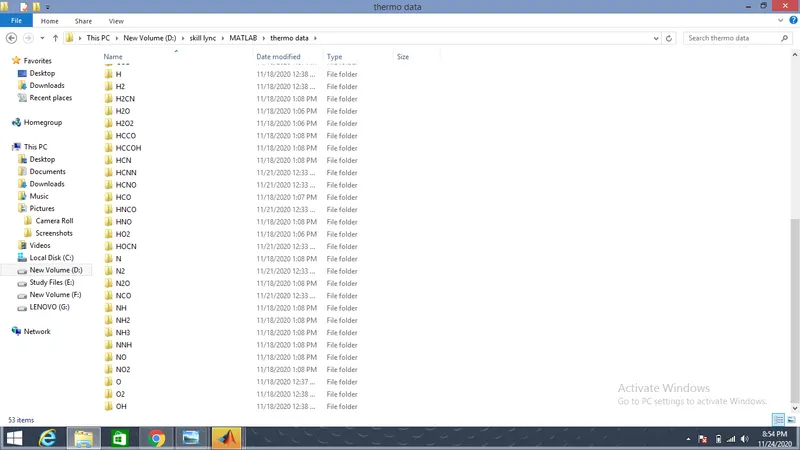
SCREENSHOTS OF SAVED DIRECTORIES :
ERRORS :
- Mentioning of wrong command that instead of "strfind" i have given "findstr" that gave a wrong results.
- When converting string to a value command input str2num does'nt gave exact result but str2double command an appropriate result.
- There was graphs which are plottted empty because of giving the global temperatues i.e, extracting the temperature values by giving the position instead of dividing the strings based on the spaces between the elements.
- There are also some minute mistakes that occured in the function code of finding the molecular weight giving wrong formula and rectified it soon.
- Finally forgot to assign index into position in the molecular weight code that does'nt print right molecular weight in the command window.
- Some errors occured in placing the parenthesis in the wrong areas while calculating the thermodynamic properties.
- some negligable errors that was considered as shown below :
CONCLUSION :
Finally the graphs between temperature and thermodynamic properties and also the molecular weights were obtained by parsing the NASA thermodynamic data.
LINK FOR THE AVOVE CODE :