Project 1 - Parsing NASA thermodynamic data
Aim: To Write a function that extracts the 14 co-efficients and calculates the enthalpy, entropy and specific heats for all the species in the data file.
File prasing :
Parsing a file means reading in a data stream of some sort and building an in memory model of the semantic content of that data. This aims at facilitating perfoming some kind of transformation on the data.
Function :

Function Code :
%function code for s, h, cp

function [S,H,CP] = file_prasing_func(T,R,hc1,hc2,hc3,hc4,hc5,hc6,hc7,lc1,lc2,lc3,lc4,lc5,lc6,lc7,mtemp)
for i = 1 : length(T);
    if T(i) > mtemp;

        S(i) = (hc1*log(T(i)) + hc2*T(i) + hc3*T(i)^2/2 + hc4*T(i)^3/3 + hc5*T(i)^4/4 + hc7)*R;
        H(i) = (hc1 + hc2*T(i)/2 + hc3*T(i)^2/3 + hc4*T(i)^3/4 + hc5*T(i)^4/5 + hc6/T(i))*R*T(i);
        CP(i) = ( hc1 + hc2*T(i) + hc3*T(i)^2 + hc4*T(i)^3 + hc5*T(i)^4)*R;

    else T(i) < mtemp;

        S(i) = (lc1*log(T(i)) + lc2*T(i) + lc3*T(i)^2/2 + lc4*T(i)^3/3 + lc5*T(i)^4/4 + lc7)*R;
        H(i) = (lc1 + lc2*T(i)/2 + lc3*T(i)^2/3 + lc4*T(i)^3/4 + lc5*T(i)^4/5 + lc6/T(i))*R*T(i);
        CP(i) = (lc1 + lc2*T(i) + lc3*T(i)^2 + lc4*T(i)^3 + lc5*T(i)^4)*R;

    end

end
Explanation :
- The fuction to find the S H CP is written and saved seperately in the same name as the function so that matlab will able to call the function.
- for loop is used so that the function iterqate itself. and the values of S h Cp will be found for all the variables.
- if function is used so that we can seperate the values as low and high temperature coefficients.
- The coefficients greater than mtemp is taken as the High coefficeints(hc).
- The coefficients lower than mtemp is taken as the low coefficeints(hc).
Main code :
clear all
close all
clc

%opening file:

A = fopen('THERMO.DAT','r');

%Title:

Title = fgetl(A);

%global temperatures:

t = str2num(fgetl(A));

%unwanted 3 lines:

for i = 1 : 3;
    fgetl(A);
end

%local temperature and coefficients:


while true;

line1 = fgetl(A);
if line1 == "END";
    break;

end;

line2 = fgetl(A);
line3 = fgetl(A);
line4 = fgetl(A);
Elements = strtok(line1);

%local temperature for each element:

line1 = strsplit(line1,' ');
mtemp = str2double(line1{end-1});
htemp = str2double(line1{end-2});
ltemp = str2double(line1{end-3});
T = linspace(ltemp,htemp,50);

%inputs:

R = 8.314;

%locating the species with 'E' :

q = findstr(line2,'E');
r = findstr(line3,'E');
s = findstr(line4,'E');

%high coefficients:

hc1 = str2double(line2(1:q(1)+3));
hc2 = str2double(line2(q(1)+4:q(2)+3));
hc3 = str2double(line2(q(2)+4:q(3)+3));
hc4 = str2double(line2(q(3)+4:q(4)+3));
hc5 = str2double(line2(q(4)+4:q(5)+3));
hc6 = str2double(line3(1:r(1)+3));
hc7 = str2double(line3(r(1)+4:r(2)+3));

%low coefficients:

lc1 = str2double(line3(r(2)+4:r(3)+3));
lc2 = str2double(line3(r(3)+4:r(4)+3));
lc3 = str2double(line3(r(4)+4:r(5)+3));
lc4 = str2double(line4(1:s(1)+3));
lc5 = str2double(line4(s(1)+4:s(2)+3));
lc6 = str2double(line4(s(2)+4:s(3)+3));
lc7 = str2double(line4(s(3)+4:s(4)+3));

%function for S , H , CP :

[S,H,CP] = file_prasing_func(T,R,hc1,hc2,hc3,hc4,hc5,hc6,hc7,lc1,lc2,lc3,lc4,lc5,lc6,lc7,mtemp);

E = [ 'C' 'H' 'O' 'N' 'A' 'S' ];

MME = [12 1 16 14 40 32];

MM = 0;

for i = 1 : length(Elements);
    for j = 1 : length(E);
    if strcmpi(Elements(i),E(j));
        MM = MM + MME(j);
    end
    end
n = str2num(Elements(i));

if     n > 1;
    MM = MM + MME(j)*(n-1);
end

end

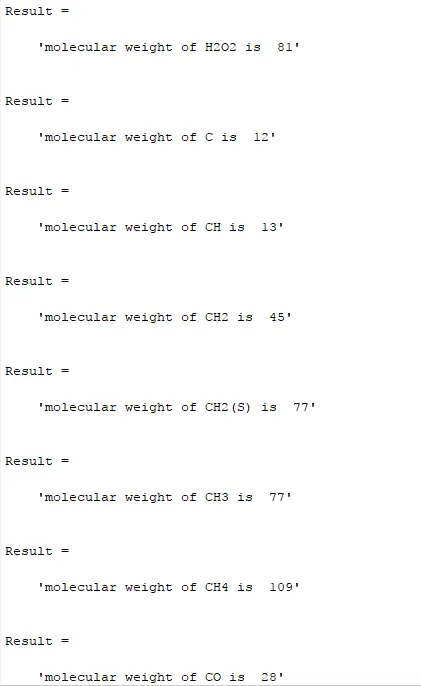
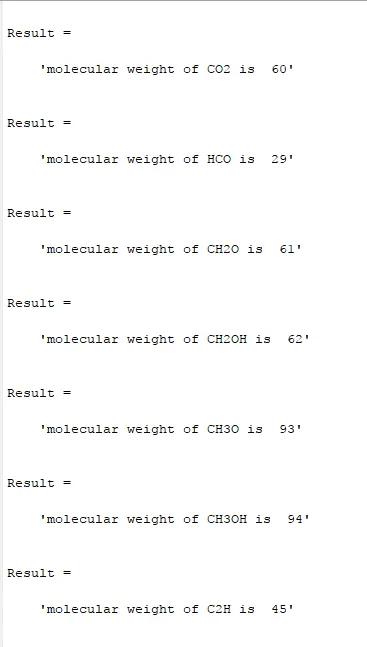
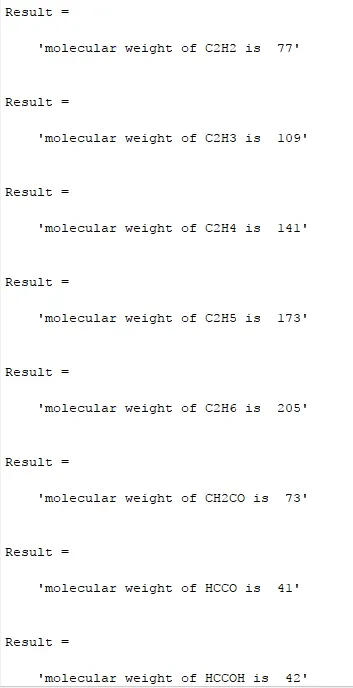
Result = sprintf('molecular weight of %s is  %d',Elements ,MM )

figure(1)
plot(T,CP,'linewidth',2,'color','r')
xlabel('temperature')
ylabel('entropy')
title(sprintf('temperature vs entropy of %s', Elements))
grid on

figure(2)
plot(T,S,'linewidth',2,'color','g')
xlabel('temperature')
ylabel('specific heat')
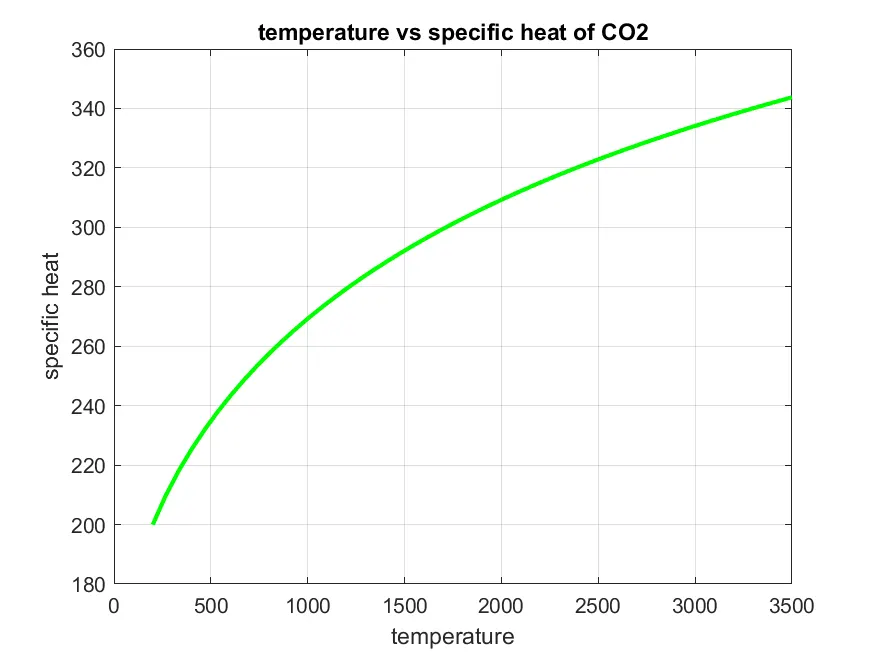
title(sprintf('temperature vs specific heat of %s', Elements))
grid on

figure(3)
plot(T,H,'linewidth',2,'color','blue')
xlabel('temperature')
ylabel('Enthalpy')
title(sprintf('temperature vs Enthalpy of %s', Elements))
grid on

mkdir('C:\Users\Skill_Lync\Documents\MATLAB\ELEMENTS',Elements)
cd(['C:\Users\Skill_Lync\Documents\MATLAB\ELEMENTS\',Elements])
saveas(1,'Entropy.png')
saveas(2,'Specific_heat.png')
saveas(3,'Enthalpy.png')
cd(['C:\Users\Skill_Lync\Documents\MATLAB'])
end
Explanation of Code :
- The code starts with clear all, close all, clc.
- fopen syntax is used to open the file. and the r is given to read the datas in file.
- Title is obtained using fgetl command. This fgetl command take the one line at a time every time its is used.
- str2num command is used to take the values as an string.
- To take the unwanted three lines out simple for loop and fgetl option is used.
- Now all the four lines which are required is taken out.

- Elements is take using strtok command.
- For the first line we only required the last three values. Initialy the strsplit command is used to take the strings and spliting using the spaces in between them. Then str2double is used to take the reqired values out.
- Species are identifed using the 'E' in them for that findstr command is used.
- Then using the str2double command both the low coefficeints and high coefficients are taken out.
- To find the S, H, CP the function is called.
- Values of E and the MME is given in the arrays.
- Then the value of MME is calculated for all the species by putting the formulas in the for loop.
- To calculate only for the species the if command is used.
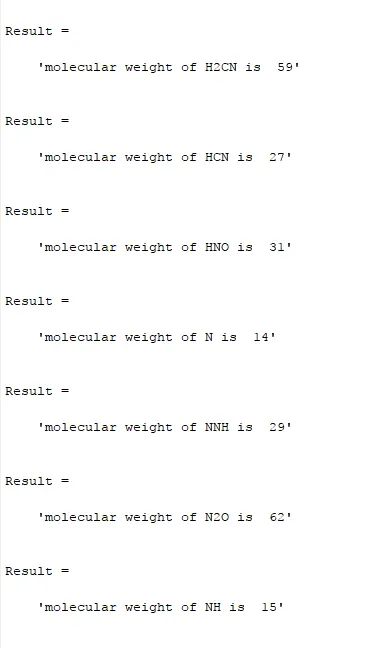
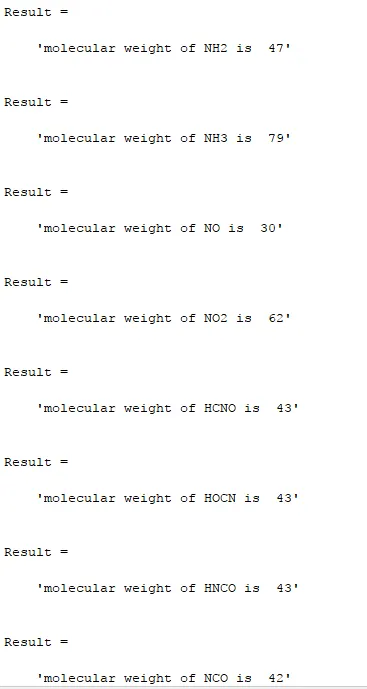
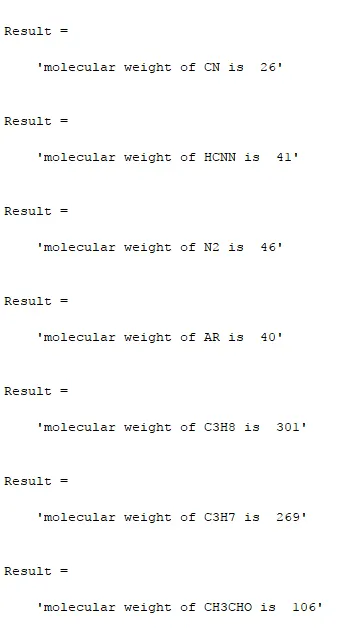
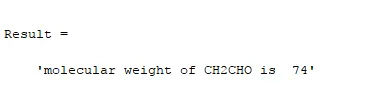
- The results of the MME is printed using the sprintf command.
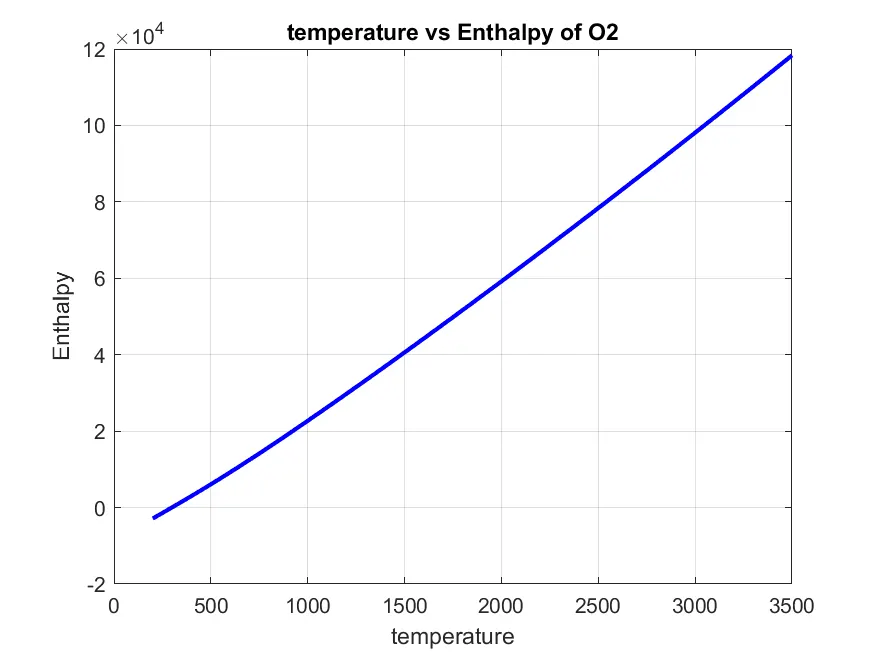
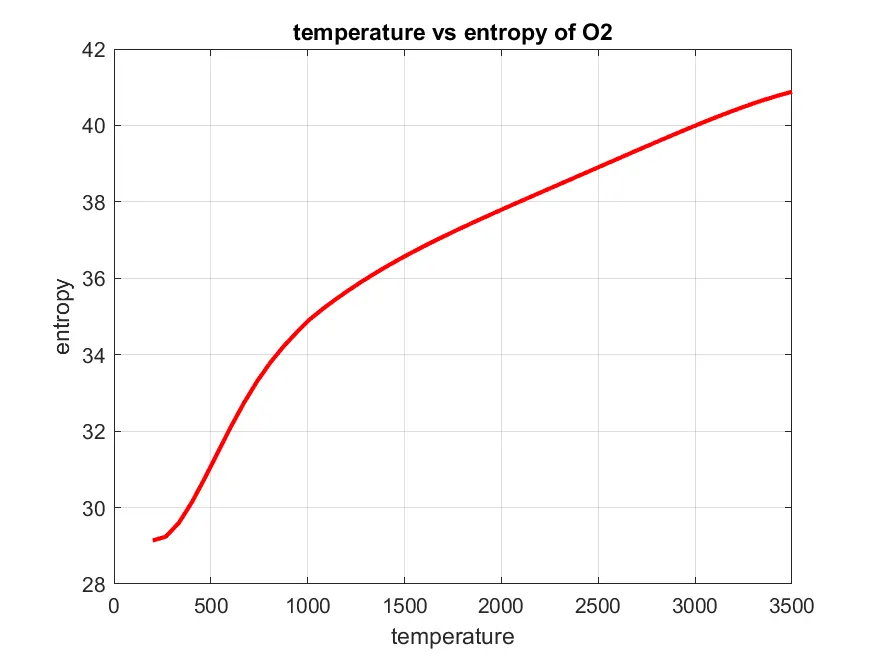
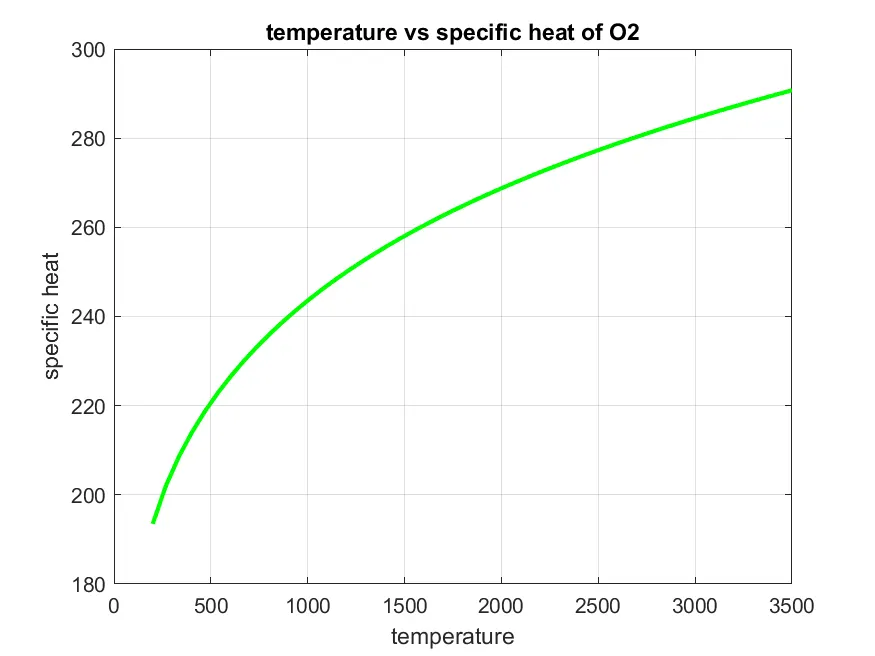
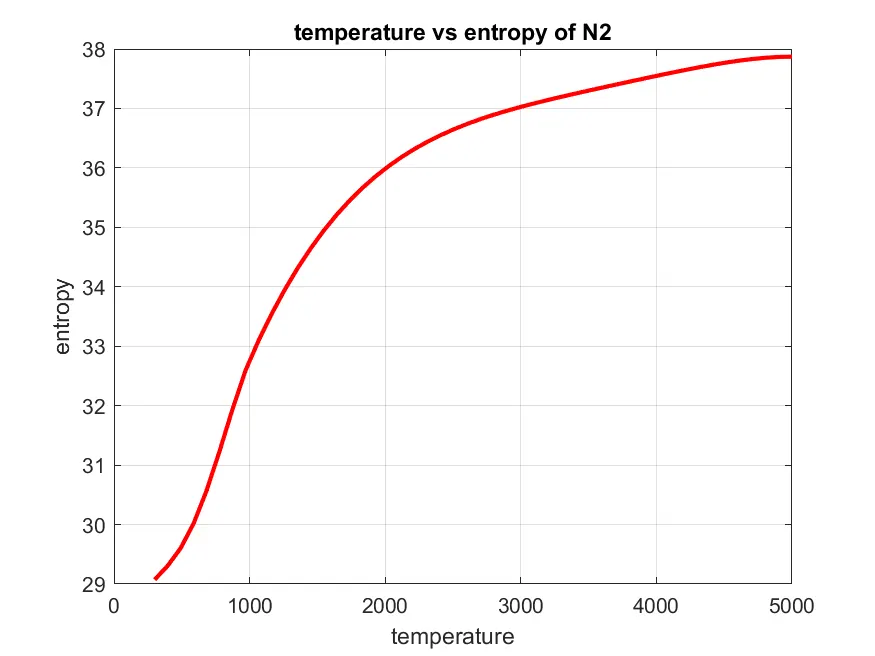
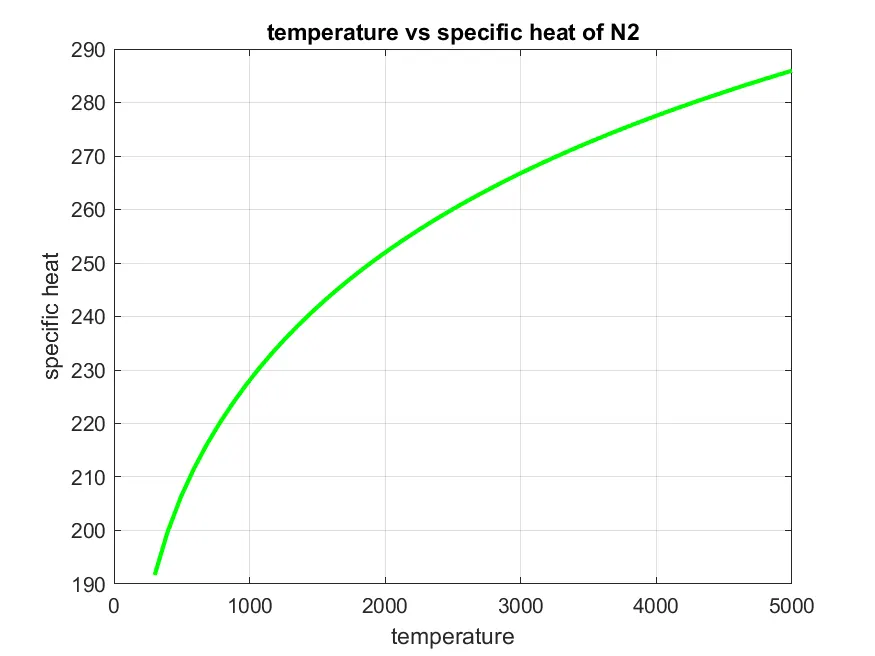
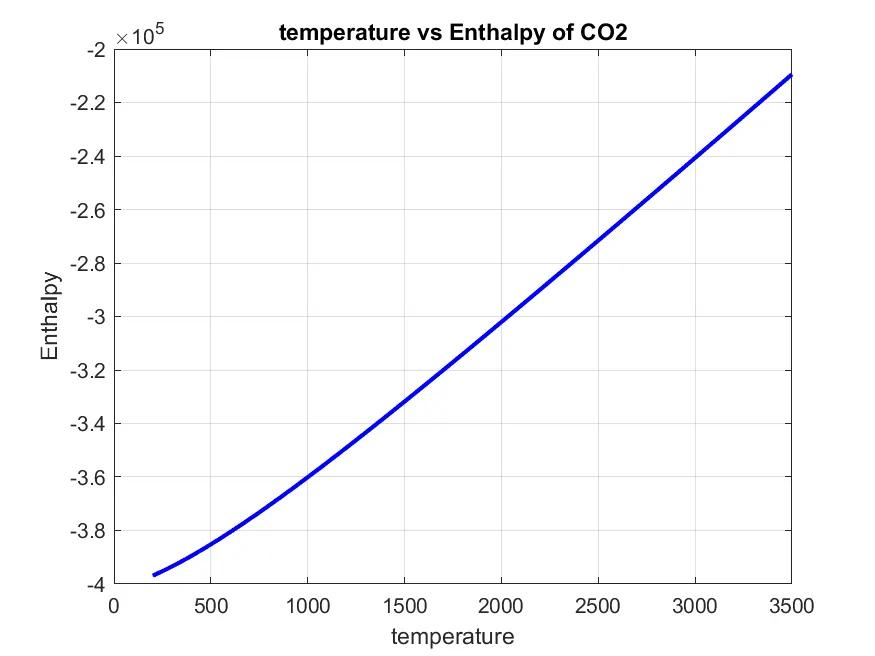
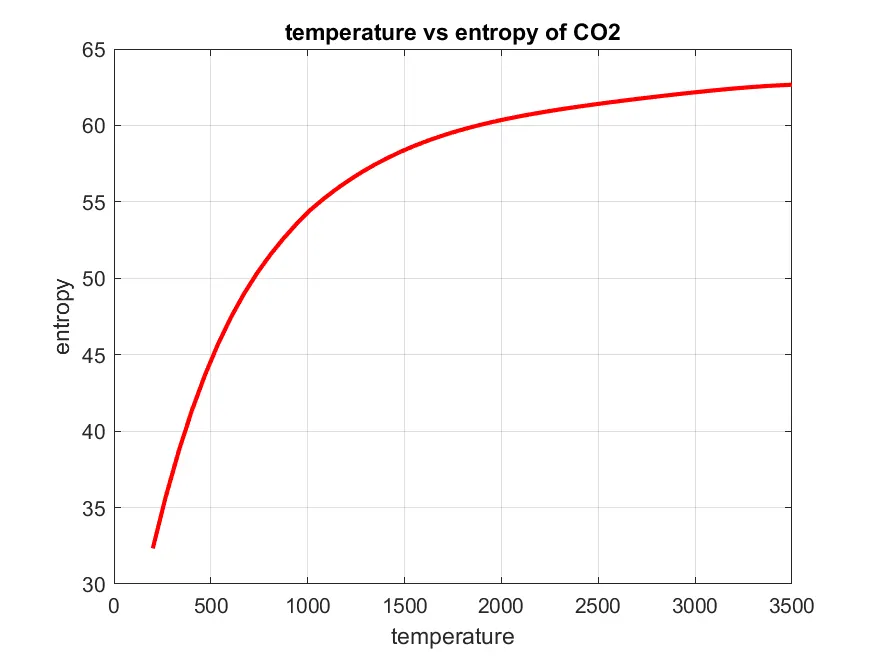
- The plot command is used to plot the enthalpy, entropy and specific heats.
- mkdir command is used to create the directory to store the data processed.
- saveas command is used to save the datas.
- cd command is used to open and close directory.
Results :

The screenshot of all the folders that are saved.
Plots:
O2 :
N2 :
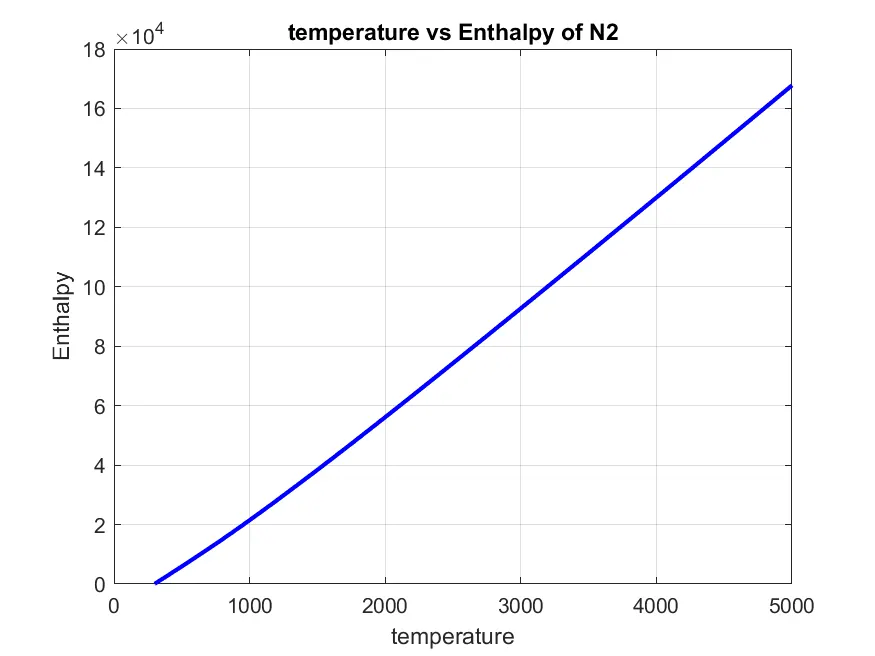
CO2 :
Molecular mass :
Conclusion :
Thus the code is written to get the values from the file and to find the S, H, CP and the molecular values of the species were calculated.