Project 1 - Parsing NASA thermodynamic data
PROJECT 1 - PARSING NASA THERMODYNAMIC DATA
ABSTARCT
This report is regarding MATLAB code for parsing the NASA thermodynamic data about species, extracting the 14 coefficients of the individual species, determining the specific heat, enthalpy, entropy of species and calculating molecular weight of the species form the given data file. In addition, plotting the Specific Heat, Enthalpy, Entropy with respect to local temperatures and saving the images of the plots in the individual folder with species names. MATLAB code is developed for user to input his choice of species for retrieving their plots. The step-by-step code generation in MATLAB and logic is explained and errors appeared during process of successful execution of code and steps are taken to resolve them. Additionally, evidence of errors is documented in the report.
THEORY
DATA PARSING: it is method of converting one string of data into other categories of data based on user choice. It is also defined as input analysis to organize the data. Originally, parsing is essential because different entities need the data to be in different forms. Parsing permits transmute data in a way that can be acknowledged by a particular software. The universal example is programs -which are written by humans and executed by computers. Here, people scribe them in a form that they perceive , then a software transforms them in a way that can be used by a computer.
NASA Thermodynamics Data: The National Aeronautics and Space Administration is USA’s independent agency which came up thermodynamic data for individual species are necessary for accomplishing equilibrium chemistry and finite-rate chemical kinetics calculations. This data commonly provides the thermodynamic properties (enthalpy, entropy, and specific heat) of a species as a function of temperature which are determined from coefficients present in the data.
Thermodynamic data for individual species are essential in many chemical reaction applications. For more than half-century, the NASA Lewis (Currently Glenn) Research Center has been compiling and disseminating thermodynamic data utilization in its chemical equilibrium programs. This data comprehensively used by the thermodynamic community across the globe. Initially the data had 42 species and now it’s been accumulated to more than 2000 species.
This report utilized some of the thermodynamic data used in the NASA Glenn computer program CEA (Chemical Equilibrium with Applications). The original NASA CEA program consists of more than 2000 solid, liquid, and gaseous chemical species with their temperatures ranging from 200 to 20 000 K. The data are expressed as least-squares coefficients to a seven-term functional form for specific heat with respect temperature by Universal gas constant with integration constants for H0(T)/RT and S0(T)/R. The NASA Glenn computer program PAC (Properties and Coefficients) was used to calculate thermodynamic functions and to generate the least-squares coefficients. PAC input was taken from a wide range of sources. The following are three equations. The NASA polynomials have the form:
Cp/R = a1 + a2 T + a3 T^2 + a4 T^3 + a5 T^4
H/RT = a1 + a2 T /2 + a3 T^2 /3 + a4 T^3 /4 + a5 T^4 /5 + a6/T
S/R = a1 lnT + a2 T + a3 T^2 /2 + a4 T^3 /3 + a5 T^4 /4 + a7
where a1, a2, a3, a4, a5, a6, and a7 are the numerical coefficients supplied in NASA thermodynamic files. The first 7 numbers starting on the second line of each species entry (five of the second line and the first two of the third line) are the seven coefficients (a1 through a7, respectively) for the high-temperature range (above 1000 K, the upper boundary is specified on the first line of the species entry). The following seven numbers are the coefficients (a1 through a7, respectively) for the low-temperature range (below 1000 K, the lower boundary is specified on the first line of the species entry).
Cp= Specific heat of the specie in (J/kg K)
H= Enthalpy in (J/kg)
S= Entropy in (J/K)
Specific heat: based on thermodynamics, the specific heat capacity of a substance is the heat capacity of a sample of the substance divided by the mass of the sample. In layman’s words, it is the amount of energy that must be added, in the form of heat, to one unit of mass of the substance in order to cause an increase of one unit in temperature.
Enthalpy: it is a concept used in science and engineering when heat and work need to be calculated. The name comes from the Greek word "enthalpos" (ενθαλπος), meaning "to put heat into". The idea and the word were made up by the Dutch scientist Heike Kamerlingh Onnes in 1909.
If a substance changes at constant pressure at this juncture enthalpy tells how much heat and work was added or removed from the substance.
Enthalpy is analogous to energy, but not the similar . during the process of substance enlarging and shrinking , energy is consumed or released. Enthalpy accounts for this energy, this made scientist to calculate change the enthalpy rather than the change in energy.
Enthalpy (H)= Internal Energy (u) + (Pressure(P) x Volume (v)); H = u + (P x V)
ENTROPY: it is defined as a measure of the amount of energy which is unavailable to do work. it is a measure of the number of possible arrangements of the atoms in a system that can have. So, it could be called as a measure of uncertainty or randomness.
MATLAB CODE STEP-BY-STEP DESCRIPTION
The following are various steps involved in generating code to parse the ‘THERMO.dat’ file for extraction of the 53 species and their respective coefficients and local temperatures. Additionally, the code for functions are developed in order determine Molecular weight species, specific heat, entropy and enthalpy. In the output, all the species with respective folders/directories are developed along with specific heat, entropy and enthalpy versus local temperature ranges and there is OUTPUT_FILE.txt file about specie. The following are steps involved:
1.Starting code with comment box to inform about what is purpose MATLAB code and using ‘close all‘, ‘clear all’, ‘clc’ functions. The 'clear all': this function removes all variables, functions and MEX-files from-memory and leaving workspace empty. The 'close all': This function will close all the figure handles are visible and hidden figure handles. The 'clc': function clears text from function window.
close all
clear all
clc
2. Now, I am declaring the Gas constant. The gas constant (also known as the molar gas constant, universal gas constant, or ideal gas constant) is denoted by the symbol R.
R=8.314;
3. Here, I am opening the 'THERMO.DAT' file using 'fopen' function in read mode 'r' and assigning to file handle variable named as 'NASA'. Open a file or obtain information about open files. The fileID = fopen(filename)opens the file, filename, for binary read access, and returns an integer file identifier equal to or greater than 3. MATLAB® reserves file identifiers 0, 1, and 2 for standard input, standard output (the screen), and standard error, respectively. If fopen cannot open the file, then fileID is -1.
NASA=fopen('THERMO.DAT','r');
4. Now, I use 'fgetl' function to read the line by lines from the data file using the file handler. The function ‘fgetl’ reads line from file, removing newline characters. In this case, 'THERMO' is the word in 1st line of the file is read into MATLAB. The ‘HEADER’ is variable to which 1st line is assigned.
HEADER=fgetl(NASA);
5. At this point, I am reading the Global temperatures in the second line of data file using function 'fgetl' and assigning to the variable 'GIVEN_GLOBAL_TEMP', then splitting the string into cells by using function 'strsplit' function. This function split string or character vector at specified delimiter. After that, I converted the characters in to numerical by using 'str2num' function. This function converts the string SPLIT_GIVEN_GLOBAL_TEMP{2}, SPLIT_GIVEN_GLOBAL_TEMP{3}, SPLIT_GIVEN_GLOBAL_TEMP{4} which is an ASCII character representation of a numeric value to numeric representation.
GIVEN_GLOBAL_TEMP=fgetl(NASA);
SPLIT_GIVEN_GLOBAL_TEMP=strsplit(GIVEN_GLOBAL_TEMP,' ');
LOWER_GLOBAL_TEMP=str2num(SPLIT_GIVEN_GLOBAL_TEMP{2});
MIDDLE_GLOBAL_TEMP=str2num(SPLIT_GIVEN_GLOBAL_TEMP{3});
HIGHER_GLOBAL_TEMP=str2num(SPLIT_GIVEN_GLOBAL_TEMP{4});
6.Now, I am ignoring the data which not essential, that is
“! GRI-Mech Version 3.0 Thermodynamics released 7/30/99
! NASA Polynomial format for CHEMKIN-II
! see README file for disclaimer"
I used ‘for loop’ function as it is in the three lines. I assigned that data to a variable called 'NOT_REQUIRED_DATA'.
for i=1:3
NOT_REQUIRED_DATA=fgetl(NASA);
end
7.At this step, I will be extracting all the essential 53 coefficients, corresponding local temperatures, using two functions for calculating the specific heat, enthalpy, entropy and; molecular weight, and saving plots of Specific heat, Enthalpy and Entropy against local temperatures in to species respective to individual folders and creating an output file for every individual specie which contains species name, molecular weight, entropy, enthalpy values using 'for' loop and using various functions like 'fgetl', 'strsplit', 'linespace', 'findstr', 'str2num', 'set', 'plot', 'xlabel', 'ylabel', 'title', 'sprintf', 'fprintf', 'cd', 'mkdir', 'saveas', 'fopen'. The below is code.
for j=1:53
DATA=fgetl(NASA);
SPLIT_DATA=strsplit(DATA,' ');
LOWER_LOCAL_TEMP=str2num(SPLIT_DATA{end-3});
MID_LOCAL_TEMP=str2num(SPLIT_DATA{end-1});
HIGH_LOCAL_TEMP=str2num(SPLIT_DATA{end-2});
SPECIES_NAME=SPLIT_DATA{1};
TEMP_RANGE=linspace(LOWER_LOCAL_TEMP,HIGH_LOCAL_TEMP,200);
COEFF_LINE_1=fgetl(NASA);
COEFF_LINE_2=fgetl(NASA);
COEFF_LINE_3=fgetl(NASA);
FIND_LOC_1_E=findstr(COEFF_LINE_1,'E');
a1=str2num(COEFF_LINE_1(1:FIND_LOC_1_E(1)+3));
a2=str2num(COEFF_LINE_1(FIND_LOC_1_E(1)+4:FIND_LOC_1_E(2)+3));
a3=str2num(COEFF_LINE_1(FIND_LOC_1_E(2)+4:FIND_LOC_1_E(3)+3));
a4=str2num(COEFF_LINE_1(FIND_LOC_1_E(3)+4:FIND_LOC_1_E(4)+3));
a5=str2num(COEFF_LINE_1(FIND_LOC_1_E(4)+4:FIND_LOC_1_E(5)+3));
FIND_LOC_2_E=findstr(COEFF_LINE_2,'E');
a6=str2num(COEFF_LINE_2(1:FIND_LOC_2_E(1)+3));
a7=str2num(COEFF_LINE_2(FIND_LOC_2_E(1)+4:FIND_LOC_2_E(2)+3));
a8=str2num(COEFF_LINE_2(FIND_LOC_2_E(2)+4:FIND_LOC_2_E(3)+3));
a9=str2num(COEFF_LINE_2(FIND_LOC_2_E(3)+4:FIND_LOC_2_E(4)+3));
a10=str2num(COEFF_LINE_2(FIND_LOC_2_E(4)+4:FIND_LOC_2_E(5)+3));
FIND_LOC_3_E=findstr(COEFF_LINE_3,'E');
a11=str2num(COEFF_LINE_3(1:FIND_LOC_3_E(1)+3));
a12=str2num(COEFF_LINE_3(FIND_LOC_3_E(1)+4:FIND_LOC_3_E(2)+3));
a13=str2num(COEFF_LINE_3(FIND_LOC_3_E(2)+4:FIND_LOC_3_E(3)+3));
a14=str2num(COEFF_LINE_3(FIND_LOC_3_E(3)+4:FIND_LOC_3_E(4)+3));
[Cp H S]=THERMOPROP(a1,a2,a3,a4,a5,a6,a7,a8,a9,a10,a11,a12,a13,a14,R,TEMP_RANGE,MIDDLE_GLOBAL_TEMP);
[MOL_WEIGHT(j)]=MOLECULAR_W(SPECIES_NAME);
set(0,'DefaultFigureVisible','off');
m(1)=figure;
plot(TEMP_RANGE,Cp,'linewidth',5,'color','g');
xlabel('TEMPERATURE (K)');
ylabel('SPECIFIC HEAT (J/kg K)');
title(['SPECIFIC HEAT Vs TEMPERATURE ',SPECIES_NAME]);
m(2)=figure;
plot(TEMP_RANGE,H,'linewidth',5,'color','c');
xlabel('TEMPERATURE (K)');
ylabel('ENTHALPY (J)');
title(['ENTHALPY Vs TEMPERATURE ',SPECIES_NAME]);
m(3)=figure;
plot(TEMP_RANGE,S,'linewidth',5,'color','r');
xlabel('TEMPERATURE (K)');
ylabel('ENTROPY ((J/K)');
title(['ENTROPY Vs TEMPERATURE ',SPECIES_NAME]);
fprintf('SPECIES NAME:%s \n',SPECIES_NAME)
fprintf('MOLECULAR WEIGHT OF SPECIE:%f \n',MOL_WEIGHT(j))
Molecular_weight_Data=sprintf('Molecular weight of %s is %f ',SPECIES_NAME,MOL_WEIGHT(j));
cd('C:\Users\prudhvikumar\Desktop\NASA_Parsing');
mkdir(SPECIES_NAME);
cd(SPECIES_NAME);
saveas(m(1),'SPECIFIC_HEAT_Vs_TEMPERATURE.jpg');
saveas(m(2),'ENTHALPY_Vs_TEMPERATURE.jpg');
saveas(m(3),'ENTROPY_Vs_TEMPERATURE.jpg');
saveas(m(1),'SPECIFIC_HEAT_Vs_TEMPERATURE.fig');
saveas(m(2),'ENTHALPY_Vs_TEMPERATURE.fig');
saveas(m(3),'ENTROPY_Vs_TEMPERATURE.fig');
OUTPUT_DATA=fopen('OUTPUT_FILE.txt','w');
fprintf(OUTPUT_DATA,'%15s : %15s \n','SPECIES NAMES',SPECIES_NAME);
fprintf(OUTPUT_DATA,'%15s : %15.3s \n','MOLECULAR WEIGHT',MOL_WEIGHT(j));
fprintf(OUTPUT_DATA,'FOR THE LOCAL TEMPERATURE RANGE: %3.1fk to %3.1fk \n',LOWER_LOCAL_TEMP,HIGH_LOCAL_TEMP);
fprintf(OUTPUT_DATA,'%6s %6s %16s %16s \n','TEMPERATURE (K)','SPECIFIC HEAT (J/kg K)','ENTHALPY (J)','ENTROPY (J/K)');
fprintf(OUTPUT_DATA,'%11.2f %17.2f %19.2f %20.2f \n',TEMP_RANGE,Cp,H,S);
cd('C:\Users\prudhvikumar\Desktop\NASA_Parsing');
end
the ‘for loop’ function will iterate for 53 times as I need to extract 53 species and corresponding coefficients ,local temperatures during this, I will calling functions for determining the thermodynamic properties like specific heat, entropy and enthalpy and other function calculating the molecular weight. I will be explaining code inside for loop.
First , I use 'fgetl' function to read the data into variable 'DATA'. The below is code.
DATA=fgetl(NASA);
Now, using 'strsplit' splitting the string based on delimiters. The below is code that depicts:
SPLIT_DATA=strsplit(DATA,' ');
After that, I will be organizing the local temperatures in to LOWER_LOCAL_TEMP, MID_LOCAL_TEMP, HIGH_LOCAL_TEMP after converting into number by using 'str2num' function.
LOWER_LOCAL_TEMP=str2num(SPLIT_DATA{end-3});
MID_LOCAL_TEMP=str2num(SPLIT_DATA{end-1});
HIGH_LOCAL_TEMP=str2num(SPLIT_DATA{end-2});
Now, I will be extracting the species name and assigning to variable 'SPECIES_NAME', as loop iterates all the specie names are obtained.
SPECIES_NAME=SPLIT_DATA{1};
I will be generating local temperature ranges using ‘linspace’ function from the extracted LOWER_LOCAL_TEMP,HIGH_LOCAL_TEMP.
TEMP_RANGE=linspace(LOWER_LOCAL_TEMP,HIGH_LOCAL_TEMP,200);
As it is observed that, In the data file, every specie coefficients are organized in three lines and from there, I am assigning to the variables COEFF_LINE_1, COEFF_LINE_2 and COEFF_LINE_3 using 'fgetl' function.
COEFF_LINE_1=fgetl(NASA);
COEFF_LINE_2=fgetl(NASA);
COEFF_LINE_3=fgetl(NASA);
For line 1, For every coefficient, the values have Exponential letter 'E'. Initially, using 'findstr' function to find 'E' and then I extracted the coefficients and converted into number and stored into variables a1, a2, a3, a4, a5 for coefficients of line 1.
FIND_LOC_1_E=findstr(COEFF_LINE_1,'E');
a1=str2num(COEFF_LINE_1(1:FIND_LOC_1_E(1)+3));
a2=str2num(COEFF_LINE_1(FIND_LOC_1_E(1)+4:FIND_LOC_1_E(2)+3));
a3=str2num(COEFF_LINE_1(FIND_LOC_1_E(2)+4:FIND_LOC_1_E(3)+3));
a4=str2num(COEFF_LINE_1(FIND_LOC_1_E(3)+4:FIND_LOC_1_E(4)+3));
a5=str2num(COEFF_LINE_1(FIND_LOC_1_E(4)+4:FIND_LOC_1_E(5)+3));
Similarly, for line 2, For every coefficient, the values have Exponential letter 'E'. Initially, using 'findstr' function to find 'E' and then I extracted the coefficients and converted into number and stored into variables a6, a7, a8, a9, a10 for coefficients of line 2.
FIND_LOC_2_E=findstr(COEFF_LINE_2,'E');
a6=str2num(COEFF_LINE_2(1:FIND_LOC_2_E(1)+3));
a7=str2num(COEFF_LINE_2(FIND_LOC_2_E(1)+4:FIND_LOC_2_E(2)+3));
a8=str2num(COEFF_LINE_2(FIND_LOC_2_E(2)+4:FIND_LOC_2_E(3)+3));
a9=str2num(COEFF_LINE_2(FIND_LOC_2_E(3)+4:FIND_LOC_2_E(4)+3));
a10=str2num(COEFF_LINE_2(FIND_LOC_2_E(4)+4:FIND_LOC_2_E(5)+3));
Similarly, for line 3, For every coefficient, the values have Exponential letter 'E'. Initially, using 'findstr' function to find 'E' and then I extracted the coefficients and converted into number and stored into variables a11, a12, a13, a14 for coefficients of line 3.
FIND_LOC_3_E=findstr(COEFF_LINE_3,'E');
a11=str2num(COEFF_LINE_3(1:FIND_LOC_3_E(1)+3));
a12=str2num(COEFF_LINE_3(FIND_LOC_3_E(1)+4:FIND_LOC_3_E(2)+3));
a13=str2num(COEFF_LINE_3(FIND_LOC_3_E(2)+4:FIND_LOC_3_E(3)+3));
a14=str2num(COEFF_LINE_3(FIND_LOC_3_E(3)+4:FIND_LOC_3_E(4)+3));
Here, I will be calling function 'THERMOPROP' for calculating the specific heat, entropy and enthalpy by passing parameters includes coefficients, temperature range, and Middle global temperature.
[Cp H S]=THERMOPROP(a1,a2,a3,a4,a5,a6,a7,a8,a9,a10,a11,a12,a13,a14,R,TEMP_RANGE,MIDDLE_GLOBAL_TEMP);
The below is the function definition for determining the Thermal properties based on the given data.
function [Cp H S]=THERMOPROP(a1,a2,a3,a4,a5,a6,a7,a8,a9,a10,a11,a12,a13,a14,R,TEMP_RANGE,MIDDLE_GLOBAL_TEMP)
%{
based on for loop with local temperature ranges and with low and high
temperature criteria, the Cp, S, H are calculated.
%}
for t=1:length(TEMP_RANGE)
if TEMP_RANGE(t)>MIDDLE_GLOBAL_TEMP
Cp(t)=R.*(a1+(a2.*(TEMP_RANGE(t))+(a3.*(TEMP_RANGE(t)).^2)+(a4.*(TEMP_RANGE(t)).^3)+(a5.*(TEMP_RANGE(t)).^4)));
H(t)=R.*TEMP_RANGE(t).*((a1)+((a2.*(TEMP_RANGE(t)))./(2))+((a3.*((TEMP_RANGE(t)).^2))./(3))+((a4.*((TEMP_RANGE(t)).^3))./(4))+((a5.*((TEMP_RANGE(t)).^4))./(5))+((a6)./(TEMP_RANGE(t))));
S(t)=R.*((a1.*log(TEMP_RANGE(t)))+(a2.*(TEMP_RANGE(t)))+((a3.*((TEMP_RANGE(t).^2))./(2)))+((a4.*((TEMP_RANGE(t).^3))./(3)))+((a5.*((TEMP_RANGE(t).^4))./(4)))+(a7));
else
Cp(t)=R.*(a8+(a9.*(TEMP_RANGE(t))+(a10.*(TEMP_RANGE(t)).^2)+(a11.*(TEMP_RANGE(t)).^3)+(a12.*(TEMP_RANGE(t)).^4)));
H(t)=R.*TEMP_RANGE(t).*((a8)+((a9.*(TEMP_RANGE(t)))./(2))+((a10.*((TEMP_RANGE(t)).^2))./(3))+((a11.*((TEMP_RANGE(t)).^3))./(4))+((a12.*((TEMP_RANGE(t)).^4))./(5))+((a13)./(TEMP_RANGE(t))));
S(t)=R.*((a8.*log(TEMP_RANGE(t)))+(a9.*(TEMP_RANGE(t)))+((a10.*((TEMP_RANGE(t).^2))./(2)))+((a11.*((TEMP_RANGE(t).^3))./(3)))+((a12.*((TEMP_RANGE(t).^4))./(4)))+(a14));
end
end
end
Similarly, I will be calling the function for calculating molecular weight. The below is code:
[MOL_WEIGHT(j)]=MOLECULAR_W(SPECIES_NAME);
The function definition code is below: here, I am passing Species names and based on atomic weight, I am calculating molecular mass of species.
function [MOL_WEIGHT]= MOLECULAR_W(SPECIES_NAME)
ATOMS=['O','H','C','N','S','A'];
ATOMIC_WEIGHT=[16,1,12,14,32,40];
MOL_WEIGHT=0;
%{
i am using for loop and based on the length of species name, i am
determining weight.
%}
for d=1:length(SPECIES_NAME)
for e=1:length(ATOMS)
if strcmp(SPECIES_NAME(d),ATOMS(e))
MOL_WEIGHT=ATOMIC_WEIGHT(e)+MOL_WEIGHT;
l=e;
end
end
% converting the string in to double numerical
g=str2double(SPECIES_NAME(d));
if g>1
MOL_WEIGHT=ATOMIC_WEIGHT(l)*(g-1)+MOL_WEIGHT;
end
end
end
Now , I will be plotting using the ' plot' function to plot graphs for Specific Heat, Enthalpy and Entropy with respective to local temperatures.
The 'set' function would create a figure that was not visible and would make it the active figure, but it would have no effect on later figures that you create using figure() without the 'visible' parameter.
set(0,'DefaultFigureVisible','off');
The ‘figure’ function : these objects are the individual windows on the screen in which MATLAB displays graphical output. figure creates a new figure object using default property values. Here it is stored in 'm'.
The ‘xlabel(txt)’ function labels the x-axis of the current axes or standalone visualization. The ‘xlabel’ command replaces the old label with the new label.
The ‘ylabel(txt)’ function labels the y-axis of the current axes or standalone visualization. The ‘ylabel’ command replaces the old label with the new label.
The ‘zlabel(txt)’ function labels the z-axis of the current axes or standalone visualization. The ‘zlabel’ command replaces the old label with the new label.
The ‘title’ function is located at the top and in the center of the axes. The ‘title(' string ')’ outputs the string at the top and in the center of the current axes. The ‘title(frame)’ evaluates the function that returns a string and displays the string at the top and in the center of the current axes.
m(1)=figure;
plot(TEMP_RANGE,Cp,'linewidth',5,'color','g');
xlabel('TEMPERATURE (K)');
ylabel('SPECIFIC HEAT (J/kg K)');
title(['SPECIFIC HEAT Vs TEMPERATURE ',SPECIES_NAME]);
m(2)=figure;
plot(TEMP_RANGE,H,'linewidth',5,'color','c');
xlabel('TEMPERATURE (K)');
ylabel('ENTHALPY (J)');
title(['ENTHALPY Vs TEMPERATURE ',SPECIES_NAME]);
m(3)=figure;
plot(TEMP_RANGE,S,'linewidth',5,'color','r');
xlabel('TEMPERATURE (K)');
ylabel('ENTROPY ((J/K)');
title(['ENTROPY Vs TEMPERATURE ',SPECIES_NAME]);
I am printing the species names along with Molecular weight in the command window. The ‘fprintf’ function. The fprintf function is used for printing information to the screen. The ‘fprintf’ function prints an array of characters to the screen: To "place" a number into this string of printed characters we use several formatting options, but they all start with a % sign.
fprintf('SPECIES NAME:%s \n',SPECIES_NAME)
fprintf('MOLECULAR WEIGHT OF SPECIE:%f \n',MOL_WEIGHT(j))
Here, I am assigning the species name and molecular weight to the variable 'Molecular_weight_Data'. The 'sprintf' function creates a string variable. fprintf writes to a file or to the command window.
Molecular_weight_Data=sprintf('Molecular weight of %s is %f ',SPECIES_NAME,MOL_WEIGHT(j));
Now, I am changing my directory to my interested location where my code creates individual folders with respective to species names by using function 'cd'. The 'cd' function changes to location of path or current folder.
cd('C:\Users\prudhvikumar\Desktop\NASA_Parsing');
Now , I will be making or creating the directory/folder using the function 'mkdir'.
mkdir(SPECIES_NAME);
Now, changing to the create directory where my plot would be stored.
cd(SPECIES_NAME);
At this point, I am saving all the plots in format of 'jpg'. This function saves figure or model using specified format.
saveas(m(1),'SPECIFIC_HEAT_Vs_TEMPERATURE.jpg');
saveas(m(2),'ENTHALPY_Vs_TEMPERATURE.jpg');
saveas(m(3),'ENTROPY_Vs_TEMPERATURE.jpg');
Now, I am saving all the plots in the .’fig’ format.
saveas(m(1),'SPECIFIC_HEAT_Vs_TEMPERATURE.fig');
saveas(m(2),'ENTHALPY_Vs_TEMPERATURE.fig');
saveas(m(3),'ENTROPY_Vs_TEMPERATURE.fig');
At this junction, I am saving extracted and calculated information into file named as 'OUTPUT_FILE.txt' by using 'fopen' function with write mode 'w'.
OUTPUT_DATA=fopen('OUTPUT_FILE.txt','w');
fprintf(OUTPUT_DATA,'%15s : %15s \n','SPECIES NAMES',SPECIES_NAME);
fprintf(OUTPUT_DATA,'%15s : %15.3s \n','MOLECULAR WEIGHT',MOL_WEIGHT(j));
fprintf(OUTPUT_DATA,'FOR THE LOCAL TEMPERATURE RANGE: %3.1fk to %3.1fk \n',LOWER_LOCAL_TEMP,HIGH_LOCAL_TEMP);
fprintf(OUTPUT_DATA,'%6s %6s %16s %16s \n','TEMPERATURE (K)','SPECIFIC HEAT (J/kg K)','ENTHALPY (J)','ENTROPY (J/K)');
fprintf(OUTPUT_DATA,'%11.2f %17.2f %19.2f %20.2f \n',TEMP_RANGE,Cp,H,S);
After saving all the plots and output data files into particular specie file, now it good to go back to the earlier directory so that, other species would be created in the same directory.
cd('C:\Users\prudhvikumar\Desktop\NASA_Parsing');
Now the loop iterates to generate for all the 53 species and their corresponding plots and output data file which contains specific heat, entropy and enthalpy.
8.Here, just for user info, I told the output file generated.
fprintf('\n THE OUTPUT FILE IS STORED');
9.Here, I am using while loop to ask user to choose his choice of species to know about plots of species from the information extracted from data file. I used ‘upper’ function in order to provide user to type upper/lower case letter by making code case insensitive.
upper (MATLAB Functions) t = upper('str') converts any lowercase characters in the string str to the corresponding uppercase characters and leaves all other characters unchanged.
The ‘openfig’ function is used to open the plots in the ‘.fig’ format files from the specific location. openfig( filename ) opens the figure saved in the MATLAB® figure file (FIG-file) called filename . openfig( filename , copies ) specifies whether to open a new copy of the figure in the case that a copy is already open. If you do not want to create a new copy, set copies to 'reuse' .
The below code will help the user to enter his choice of species names, then code look for the name of the species in the directory, once name matches with requested species name and it prints to display the plots using ‘openfig’ function. The while loop runs as longs as user inputs correct inputs and if not so informs user that entered wrong ‘WRONG INPUT PROVIDED BY USER’ and comes out of loop.
The strcmpi (MATLAB Functions) strcmpi( str1 , str2 ) returns 1 if strings str1 and str2 are the same except for case and 0 otherwise. strcmpi(S,T) when either S or T is a cell array of strings, returns an array the same size as S and T containing 1 for those elements of S and T that match except for case, and 0 otherwise.
Using ‘fclose(all) function , I will be closing all the opened files for this MATLAB code.
while(1)
% Here i provided options of user such that code case insensitive.
I_P=input('\n DO YOU WANT TO STILL REQUEST INFORMATION ABOUT SPECIES ? Y or y/N or n:','s');
I_P_U=upper(I_P);
% User can enquire about the extracted information
ENQUIRE=input('\n DO YOU NEED THERMODYNAMIC INFORMATION ABOUT SPECIES ? Y or y/N or n:\n','s');
ENQUIRE_U=upper(ENQUIRE);
if strcmpi(ENQUIRE_U,'Y')
% User provides his input
NAME_SPECIES=input('PLEASE PROVIDE INTERESTED SPECIES NAME in capital or small letters:','s');
NAME_SPECIES_U=upper(NAME_SPECIES);
% Based on input request, checks for extracted info
cd('C:\Users\prudhvikumar\Desktop\NASA_Parsing');
%{
here , i am checking the requested species name is not matching
in the directory
%}
if not(isfolder(NAME_SPECIES_U))
fprintf('\n WRONG INPUT PROVIDED BY USER \n')
fprintf('\n PLEASE PROVIDE CORRECT SPECIES NAME\n')
else
cd(NAME_SPECIES_U)
%Based on user choice of species, the below information is provided
openfig('SPECIFIC_HEAT_Vs_TEMPERATURE.fig','visible')
openfig('ENTHALPY_Vs_TEMPERATURE.fig','visible')
openfig('ENTROPY_Vs_TEMPERATURE.fig','visible')
fprintf('REQUESTED PLOTS ARE OPENED \n')
fprintf('QUERY ENDED \n')
end
elseif strcmpi(ENQUIRE_U,'N')
fprintf('\n THANK YOU \n')
else
end
if I_P_U=='N'
% while loop breaks when user selects N or n
break
end
end
% Here, i am closing all the files.
fclose('all')
ERORS FACED AND STEPS TO OVERCOME
The following paragraphs will illustrate various errors encountered during programing and steps taken to resolve.
1. The following is error occurred due the wrong use of operator signs along with ‘if’ condition. MATLAB shown error in the command with specific line number. The below is screen shot of error.
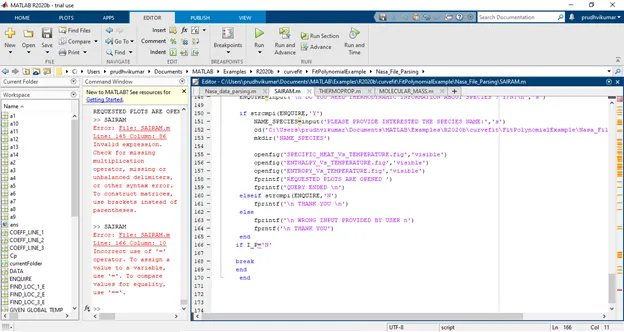
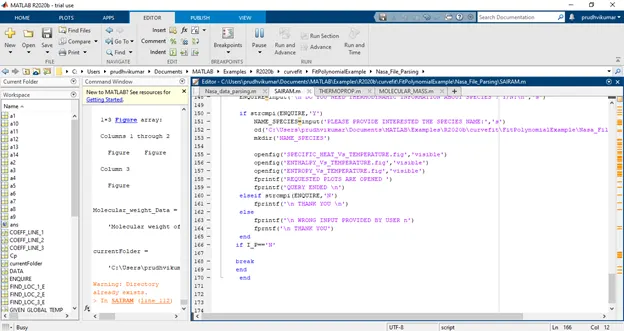
The error resolved by identifying with help of command window which shown line number 166 and column 10. I placed correct conditional operator ‘==’. The issue is resolved. The below is the after correction and code is starts executing.
2. Error occurred while writing some content into the file. I did not place the quotes for ‘w’ write access mode. The below is the error.
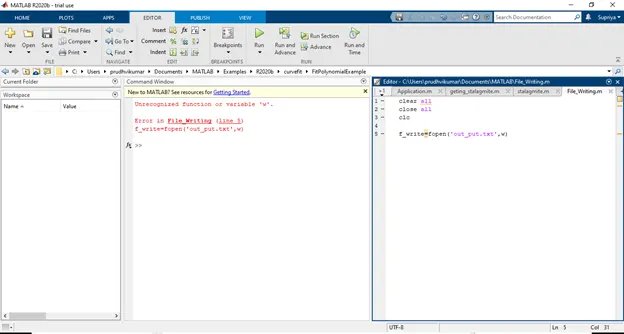
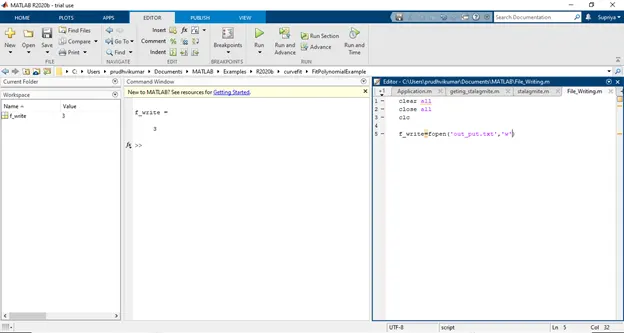
The below is the screenshot, the error is identified with help of command window showing the location of error line 5 and mentioned it as ‘Unrecognized function or variable ‘w’, then issue is resolved by putting the access variable write mode in quotes ‘w’.
3. I had an error while closing the file handle created by using ‘fclose’ function, here I put the file handle in the quotes fclose(‘f_write’), which is wrong. The below is screenshot of the error.
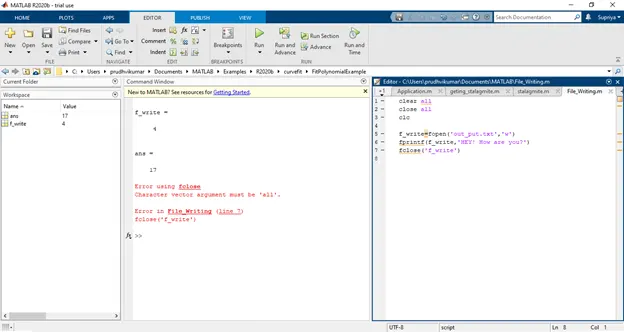
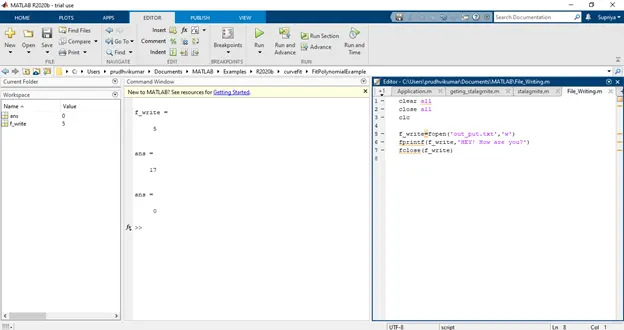
The issue is resolved by removing the quotes in the fclose(f_write). The command window shown me location of error and it is corrected by me. The below is the picture of corrected ones.
OUTPUT
The MATLAB code is helpful in generating output. Initially, the 53 species names and their respective coefficients are obtained. The following output.
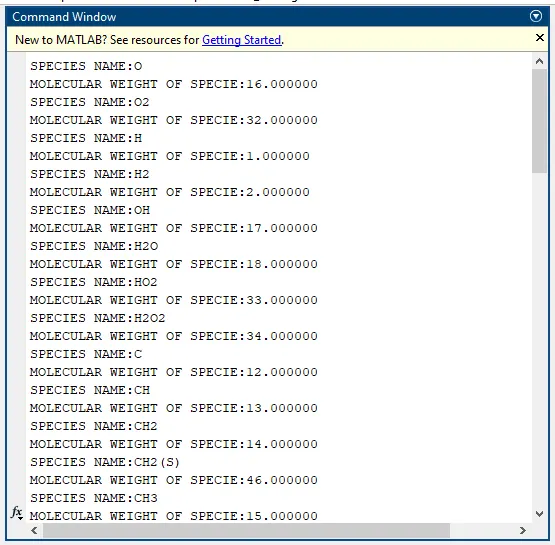
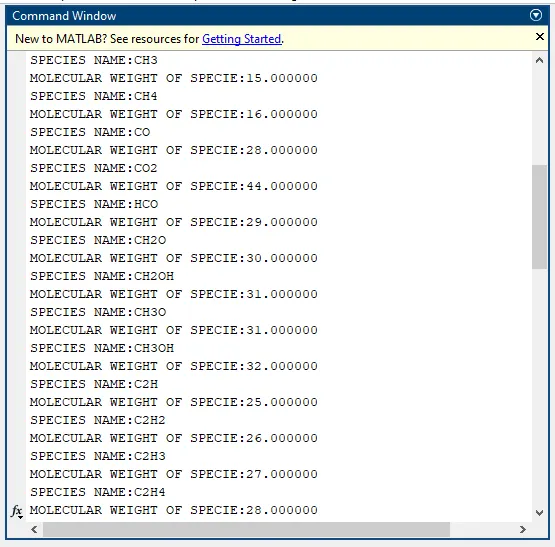
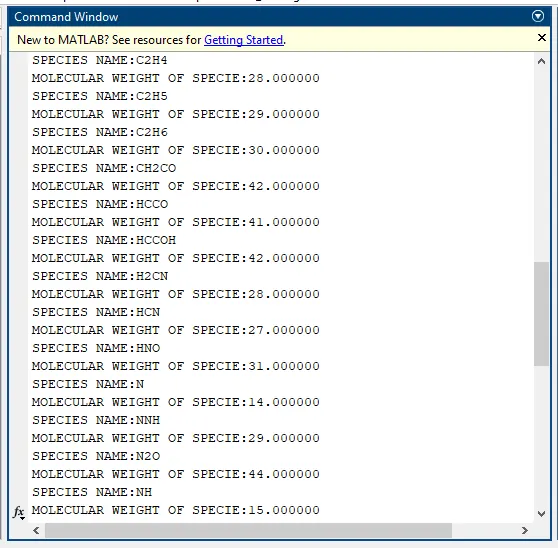
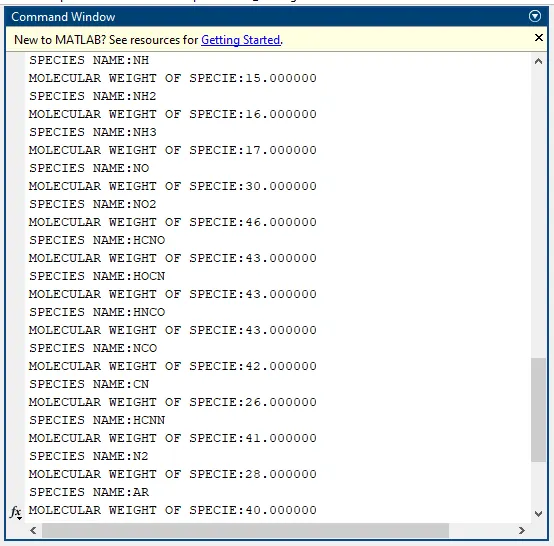
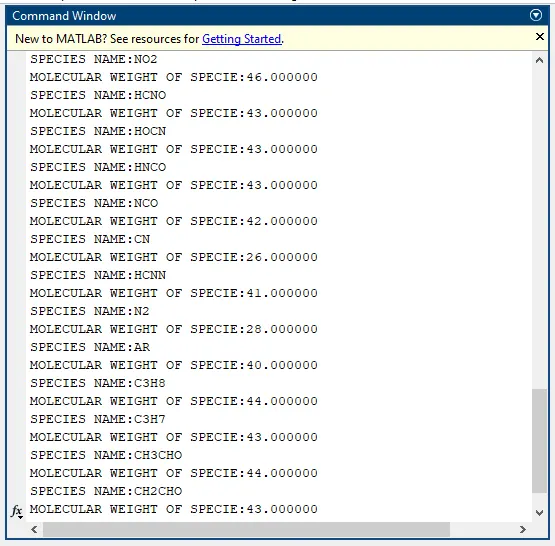
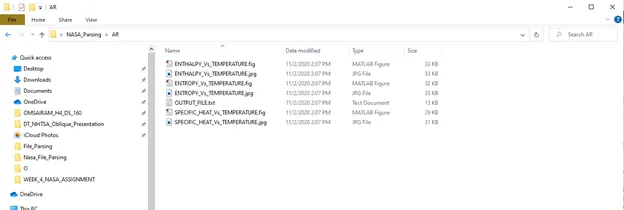
The following is the other output obtained which includes generation of species directories and it includes plots for Specific Heat, Enthalpy, Entropy with respective to given temperature ranges in both ‘.fig’ and ‘.jpg’ format and also the OUTPUT_FILE.txt which includes information about thermodynamic properties. The below picture depiction of folders.
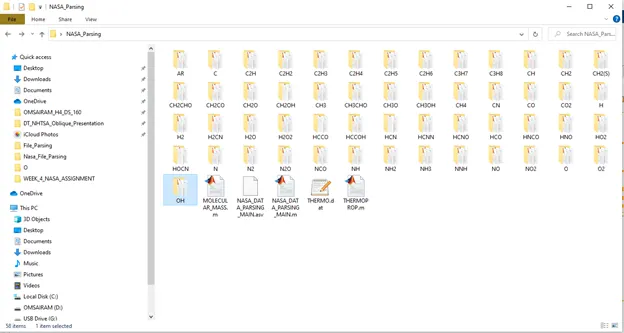
The below is the picture that represents the requested outputs into specific species names.
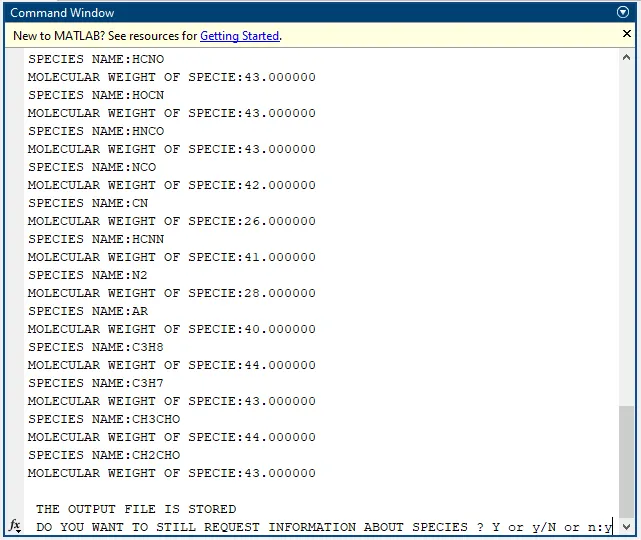
Another output is based on the user input request, the following are the series of screen shots to show case how the code is requesting user to input their choice and output plots of requested species name are generated.
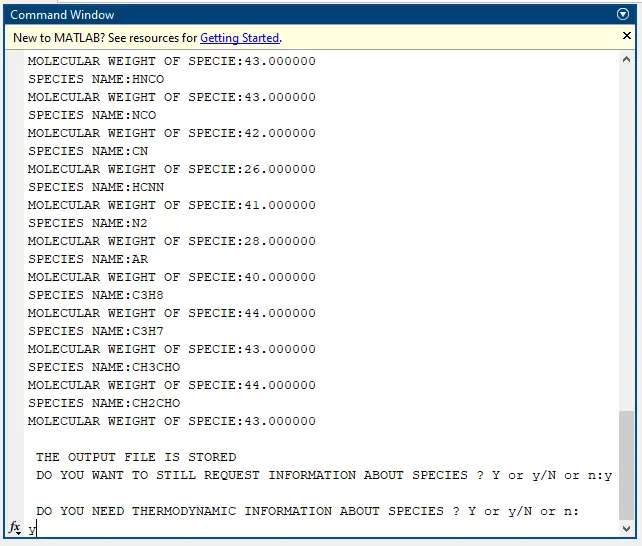
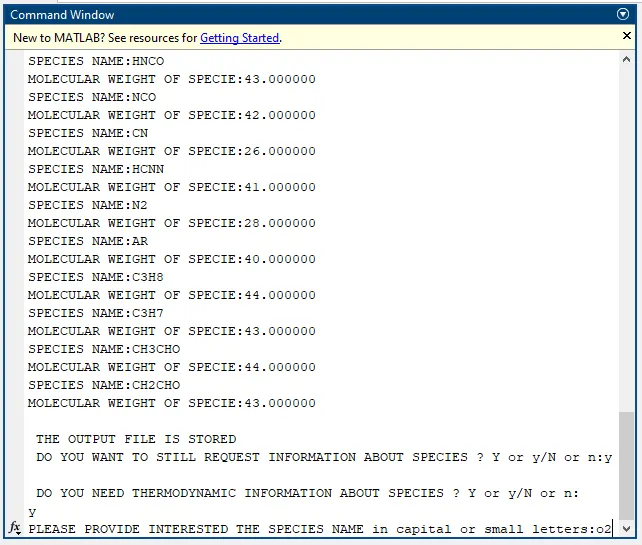
The requested plots for O2 are generated. The below are pictures of them.
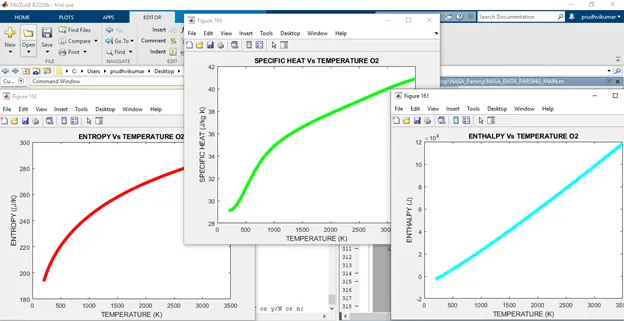
The individual plots for O2 species are below
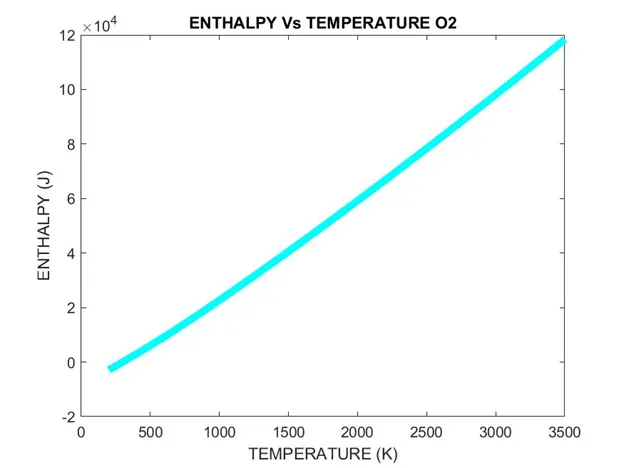
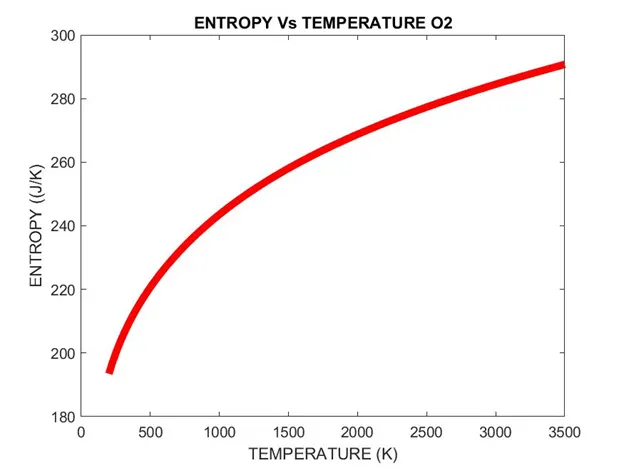
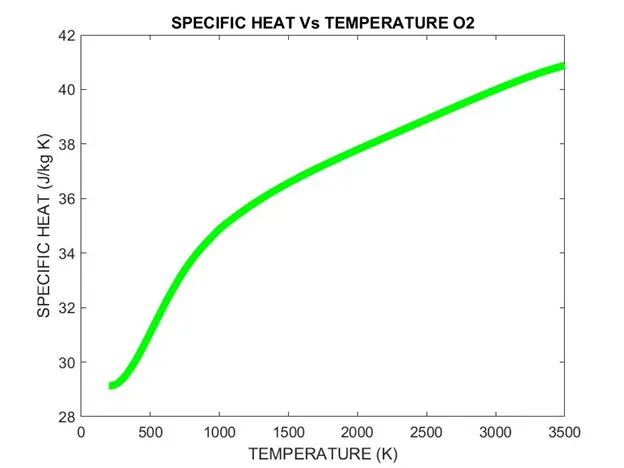
The following other screen shots of the user request for the N2 species:
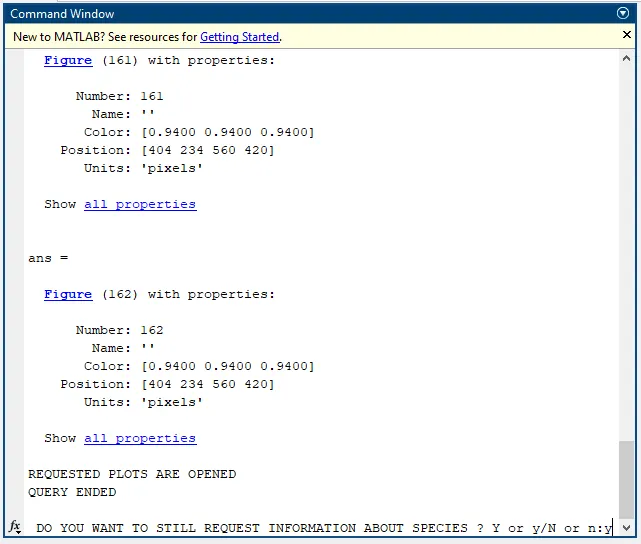
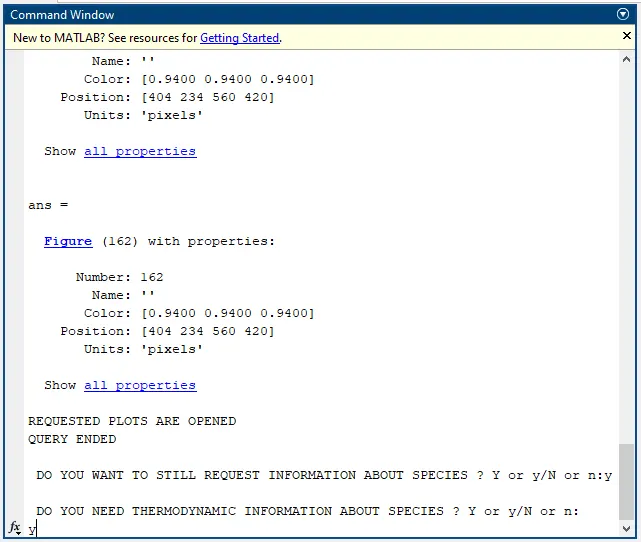
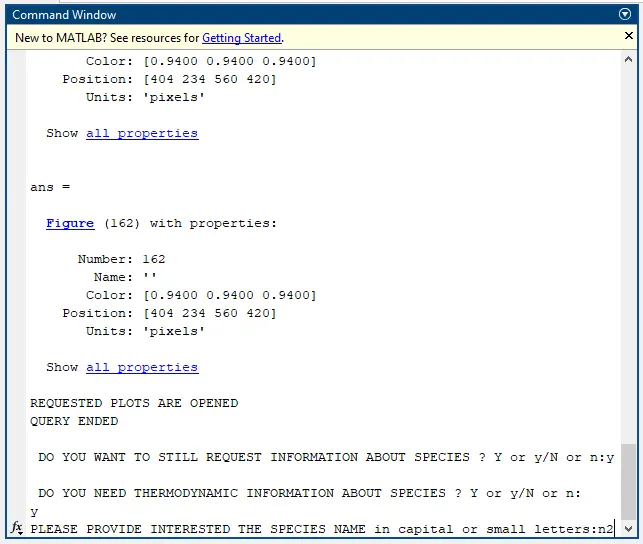
The output generated based user request for N2 species plots. The below is the screen shots related to that.
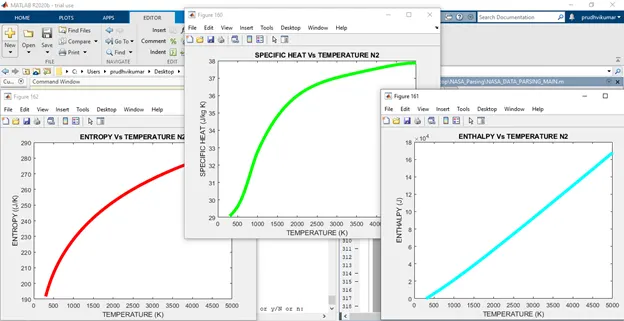
The individual plots for N2 species are below:
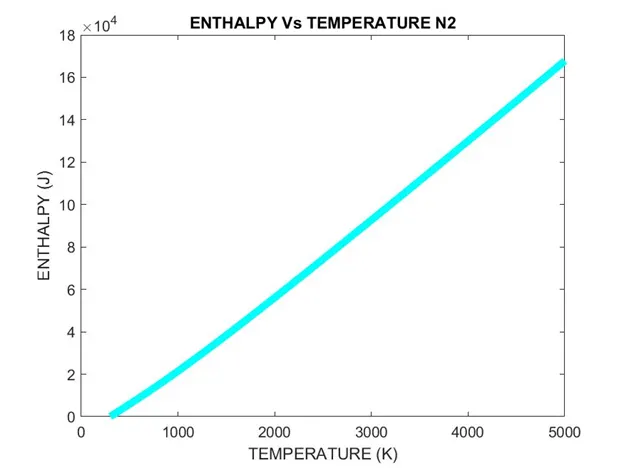
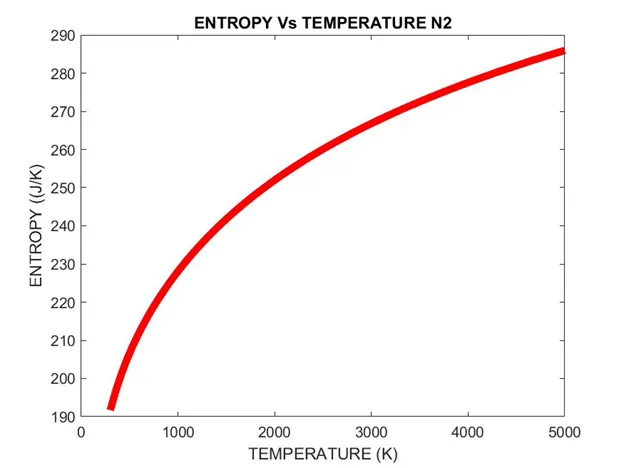
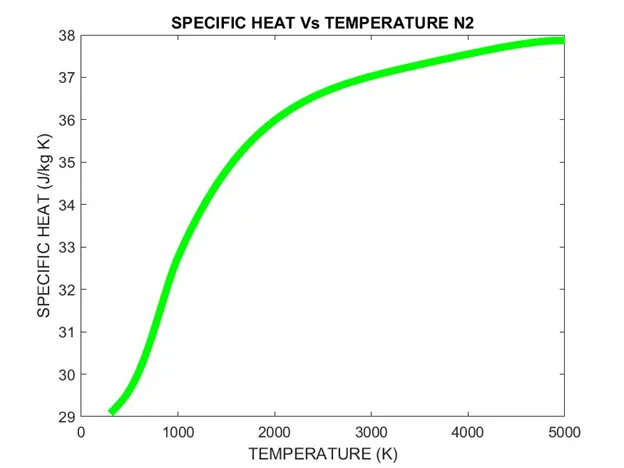
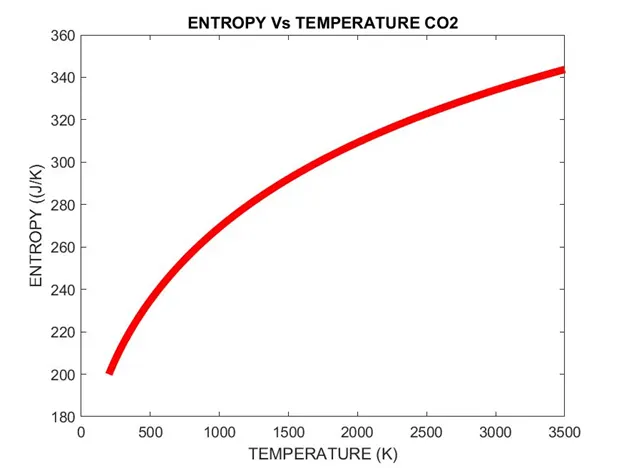
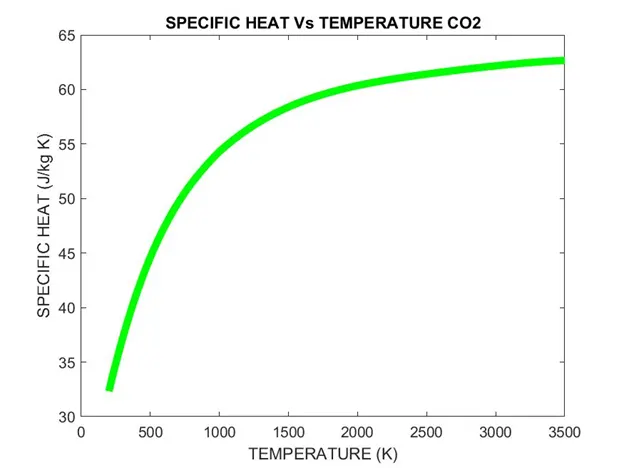
The following other screen shots of the user request for the CO2 species:
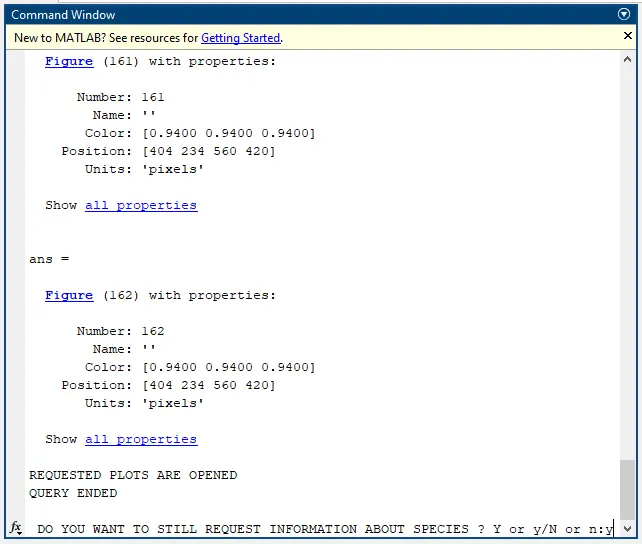
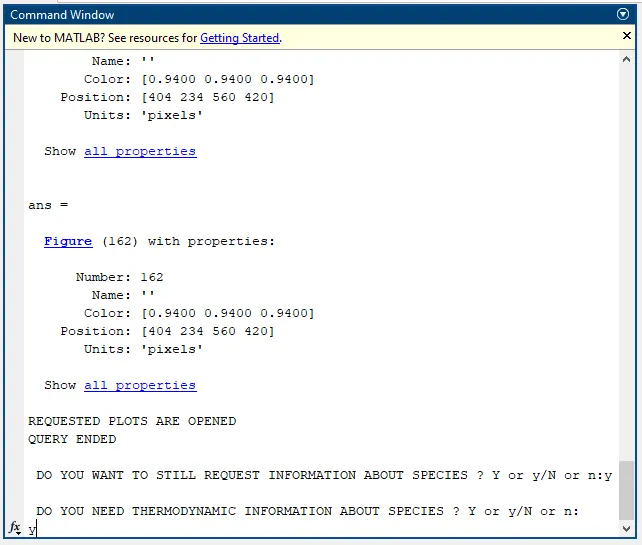
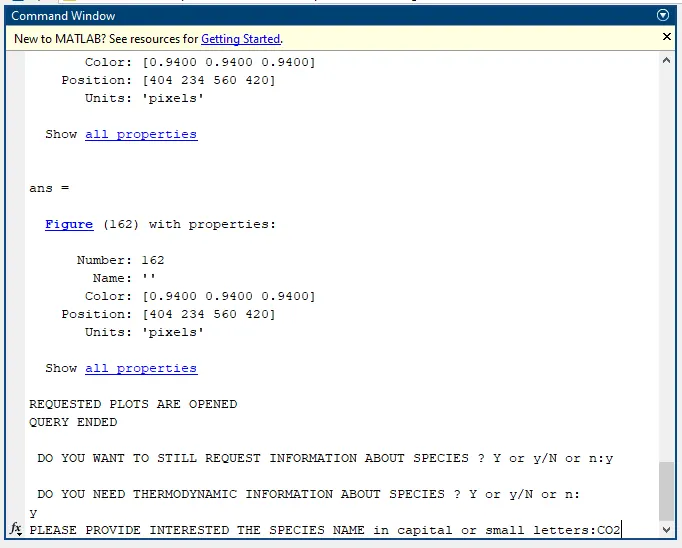
The output generated based user request for CO2 species plots. The below is the screen shots related to that .
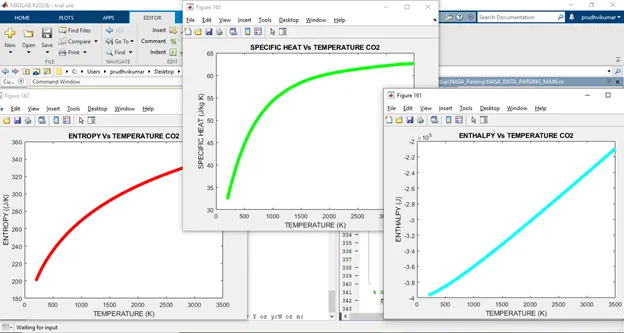
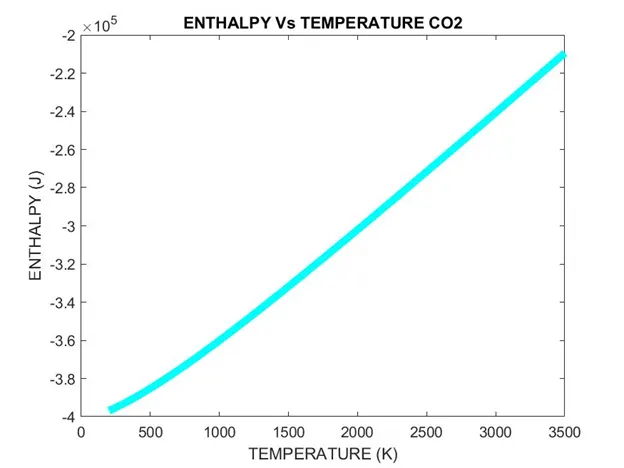
The individual plots for CO2species are below:
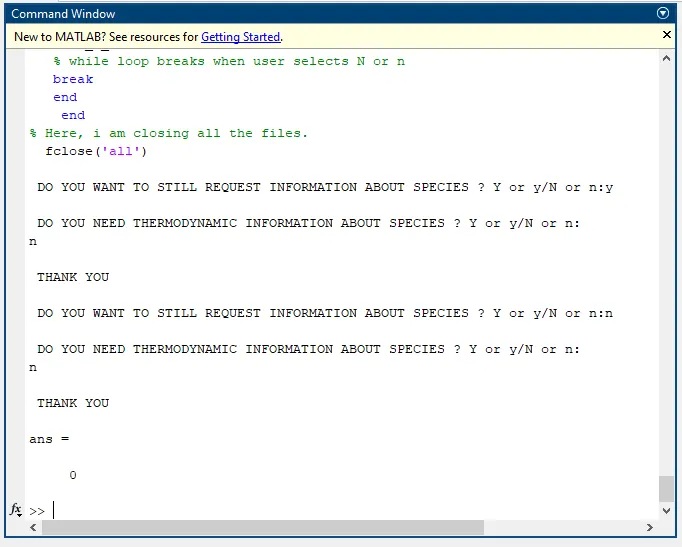
The user does not want to request further any species, so the following is the output.
Finally, if the user does not provide correct species name, code will ask user again to provide correct species name then output is generated. The following are screenshots that depicts output.
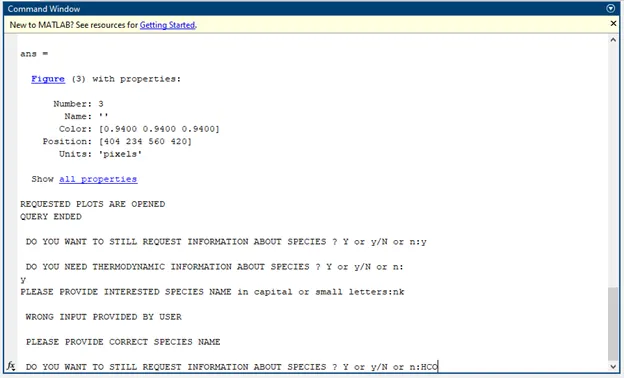
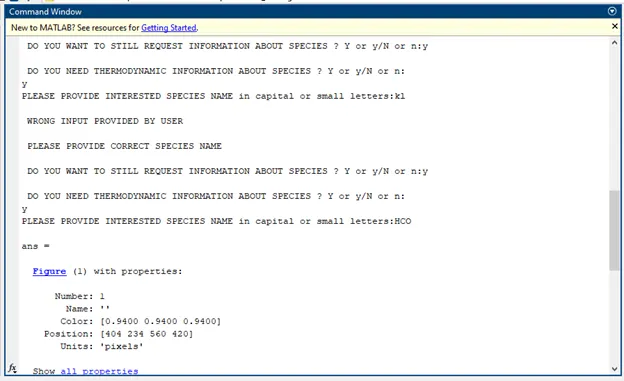
The following is output requested from user:
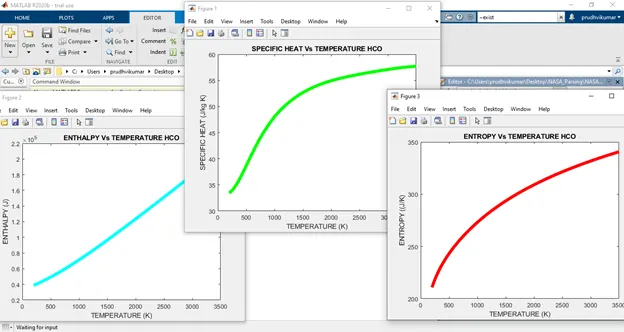
With the help of MATLAB code, I am able to parse the data and utilize it for determining the thermodynamic properties from coefficients and given local temperatures.
With the help of MATLAB code, I am able to parse the data and utilize it for determining the thermodynamic properties from coefficients and given local temperatures. Finally, created all species directories which includes all the requested plots.
The below is the link for all the species directories uploaded on googles drive.
https://drive.google.com/drive/folders/1_FmiC6b7PgDYZuFJZdfaD3PE7kaPaGi-?usp=sharing
References:
- http://www.ece.northwestern.edu/local-apps/matlabhelp/techdoc/ref/fopen.html
- https://en.wikipedia.org/wiki/Gas_constant
- https://www.grc.nasa.gov/WWW/CEAWeb/TP-2002-211556.pdf
- https://www.grc.nasa.gov/WWW/CEAWeb/TP-2002-21556.htm
- https://strives-uploads-prod.s3.us-gov-west-1.amazonaws.com/19940013151/19940013151.pdf?AWSAccessKeyId=AKIASEVSKC45ZTTM42XZ&Expires=1604384579&Signature=Yph8AN4XVMyISq4WzsKo5826aZ8%3D
- http://combustion.berkeley.edu/gri_mech/data/nasa_plnm.html
- https://shepherd.caltech.edu/EDL/PublicResources/sdt/thermo.html
- https://in.mathworks.com/help/matlab/ref/fgetl.html
- https://in.mathworks.com/help/matlab/ref/strsplit.html
- https://in.mathworks.com/matlabcentral/answers/22626-ask-user-to-continue
- https://in.mathworks.com/matlabcentral/answers/163604-looping-until-conditions-met
- https://www.mn.uio.no/astro/english/services/it/help/mathematics/matlab/matlab_prog.pdf
- https://www.uwyo.edu/ceas/resources/current-students/classes/esig%20help/windows%20help%20files/matlab/loop%20types.pdf
- https://in.mathworks.com/help/matlab/ref/fclose.html
- https://in.mathworks.com/help/matlab/ref/fopen.html
- http://www.ece.northwestern.edu/local-apps/matlabhelp/techdoc/ref/fopen.html
- https://in.mathworks.com/help/matlab/ref/fgetl.html
- https://in.mathworks.com/help/matlab/ref/strsplit.html
- https://in.mathworks.com/matlabcentral/answers/364372-how-to-use-the-str2num-for-the-whole-array-at-once
- http://matlab.izmiran.ru/help/techdoc/ref/str2num.html
- https://in.mathworks.com/matlabcentral/answers/45248-fprintf-output-line-break
- https://in.mathworks.com/matlabcentral/answers/36420-fprintf-multiple-lines
- https://in.mathworks.com/matlabcentral/answers/480963-how-to-code-fprintf-on-multiple-lines
- https://in.mathworks.com/matlabcentral/answers/31862-display-an-input-sentence-to-the-user-on-multiple-lines
- https://in.mathworks.com/matlabcentral/answers/384316-set-default-visibility-of-figures-to-on-not-working
- https://in.mathworks.com/matlabcentral/answers/223980-how-to-set-figure-plot-visibility-to-on-by-default
- https://in.mathworks.com/help/matlab/ref/figure.html
- https://in.mathworks.com/help/matlab/ref/sprintf.html
- https://in.mathworks.com/help/matlab/ref/cd.html
- http://www.ece.northwestern.edu/local-apps/matlabhelp/techdoc/ref/saveas.html
- https://en.wikipedia.org/wiki/Enthalpy#:~:text=The%20unit%20of%20measurement%20for,(BTU)%20and%20the%20calorie.
- https://en.wikipedia.org/wiki/Specific_heat_capacity
https://www.dur.ac.uk/physics/students/labs/skills/labskills/constants/
%{
This is Code for Data Parsing From NASA Thermodynamic Data and calculating
Molecular weight of species; determining the specific heat, entropy and
enthalpy and plotting with respective to local temperatures.
%}

%{
'clear all': This function removes all variables, functions and
MEX-files from-memory and leaving workspace empty.
'close all': This function will close all the figure handles are visible
and hidden figure handles
'clc': function clears text from function window

%}
close all
clear all
clc

%{
The gas constant (also known as the molar gas constant, universal gas
constant, or ideal gas constant) is denoted by the symbol R
%}
R=8.314;

%{
Here, I am opening the 'THERMO.DAT' file using 'fopen' function in read
mode 'r' and assigning to file handle variable named as 'NASA'.

Open a file or obtain information about open files.fileID = fopen(filename)
opens the file, filename, for binary read access, and returns an integer
file identifier equal to or greater than 3. MATLAB® reserves file
identifiers 0, 1, and 2 for standard input, standard output (the screen),
and standard error, respectively.

If fopen cannot open the file, then fileID is -1.
%}
NASA=fopen('THERMO.DAT','r');


%{
Now, i use 'fgetl' function to read the line by lines from the data file
using the file handler.Read line from file, removing newline characters.In
this case, 'THERMO' is the word in 1st line of the file is read in to
MATLAB.
%}
HEADER=fgetl(NASA);

%{
At this point, I am reading the Global temperatures in the second line of
data file using function 'fgetl' and assigning to the variable
'GIVEN_GLOBAL_TEMP', then splitting the string into cells by using function
'strsplit' function. This function split string or character vector at
specified delimiter. After that, i converted the charaters in to numerical
by using 'str2num' function.This function converts the string
SPLIT_GIVEN_GLOBAL_TEMP{2}, SPLIT_GIVEN_GLOBAL_TEMP{3},
SPLIT_GIVEN_GLOBAL_TEMP{4} which is an ASCII character representation
of a numeric value to numeric representation.
%}
GIVEN_GLOBAL_TEMP=fgetl(NASA);
SPLIT_GIVEN_GLOBAL_TEMP=strsplit(GIVEN_GLOBAL_TEMP,' ');
LOWER_GLOBAL_TEMP=str2num(SPLIT_GIVEN_GLOBAL_TEMP{2});
MIDDLE_GLOBAL_TEMP=str2num(SPLIT_GIVEN_GLOBAL_TEMP{3});
HIGHER_GLOBAL_TEMP=str2num(SPLIT_GIVEN_GLOBAL_TEMP{4});

%{
Now, i am ignoring the data which not essential, that is
! GRI-Mech Version 3.0 Thermodynamics released 7/30/99
! NASA Polynomial format for CHEMKIN-II
! see README file for disclaimer

by using for loop as it is in the three lines. I assigned that data to a
varible called 'NOT_REQUIRED_DATA'.
%}
for i=1:3
    NOT_REQUIRED_DATA=fgetl(NASA);
end

%{
I will be extracting all the essential 53 coefficients, corresponding
local temperatures, using two functions for calculating the
specific heat, enthalpy, entropy and; molecular weight, and saving plots of
Specific heat, Enthalpy and Entropy against local temperatures in to
species respective to individual folders and creating an output file for
every individual specie which contains species name, molecular weight,
entropy, enthalpy values using 'for' loop and using various functions
like'fgetl','strsplit','linespace','findstr','str2num','set','plot',
'xlabel','ylabel', 'title', 'sprintf', 'fprintf', 'cd', 'mkdir','saveas',
'fopen'.

%}
for j=1:53
    % using 'fgetl' function to read the data in to variable 'DATA'
    DATA=fgetl(NASA);

    % using 'strsplit' splitting the string based on delimiters
    SPLIT_DATA=strsplit(DATA,' ');

    %{
    organizing  the local temperatures in to LOWER_LOCAL_TEMP,
    MID_LOCAL_TEMP, HIGH_LOCAL_TEMP after converting in to numericals by
    using 'str2num' function.
    %}
    LOWER_LOCAL_TEMP=str2num(SPLIT_DATA{end-3});
    MID_LOCAL_TEMP=str2num(SPLIT_DATA{end-1});
    HIGH_LOCAL_TEMP=str2num(SPLIT_DATA{end-2});

    % Extracting the species name and assigning to variable 'SPECIES_NAME'
    SPECIES_NAME=SPLIT_DATA{1};

    % Creating 'TEMP_RANGE' by using 'linspace' function
    TEMP_RANGE=linspace(LOWER_LOCAL_TEMP,HIGH_LOCAL_TEMP,200);

    %{
    In the data file, every specie coefficients are organized in three
    lines and from there, i am assigning to the variables COEFF_LINE_1,
    COEFF_LINE_2 and COEFF_LINE_3 using 'fgetl' function.
    %}
    COEFF_LINE_1=fgetl(NASA);
    COEFF_LINE_2=fgetl(NASA);
    COEFF_LINE_3=fgetl(NASA);

    %{
    For every coefficient, the values have Exponential letter 'E'.
    Initially, using 'findstr' function to find 'E' and then i extracted
    the coefficients and converted in to number and stored in to varibles
    a1, a2, a3, a4, a5 for coefficients of line 1.
    %}
    FIND_LOC_1_E=findstr(COEFF_LINE_1,'E');
    a1=str2num(COEFF_LINE_1(1:FIND_LOC_1_E(1)+3));
    a2=str2num(COEFF_LINE_1(FIND_LOC_1_E(1)+4:FIND_LOC_1_E(2)+3));
    a3=str2num(COEFF_LINE_1(FIND_LOC_1_E(2)+4:FIND_LOC_1_E(3)+3));
    a4=str2num(COEFF_LINE_1(FIND_LOC_1_E(3)+4:FIND_LOC_1_E(4)+3));
    a5=str2num(COEFF_LINE_1(FIND_LOC_1_E(4)+4:FIND_LOC_1_E(5)+3));

    %{
    For every coefficient, the values have Exponential letter 'E'.
    Initially, using 'findstr' function to find 'E' and then i extracted
    the coefficients and converted in to number and stored in to varibles
    a6, a7, a8, a9, a10 for coefficients of line 2.
    %}
    FIND_LOC_2_E=findstr(COEFF_LINE_2,'E');
    a6=str2num(COEFF_LINE_2(1:FIND_LOC_2_E(1)+3));
    a7=str2num(COEFF_LINE_2(FIND_LOC_2_E(1)+4:FIND_LOC_2_E(2)+3));
    a8=str2num(COEFF_LINE_2(FIND_LOC_2_E(2)+4:FIND_LOC_2_E(3)+3));
    a9=str2num(COEFF_LINE_2(FIND_LOC_2_E(3)+4:FIND_LOC_2_E(4)+3));
    a10=str2num(COEFF_LINE_2(FIND_LOC_2_E(4)+4:FIND_LOC_2_E(5)+3));

    %{
    For every coefficient, the values have Exponential letter 'E'.
    Initially, using 'findstr' function to find 'E' and then i extracted
    the coefficients and converted in to number and stored in to varibles
    a11, a12, a13, a14 for coefficients of line 3.
    %}
    FIND_LOC_3_E=findstr(COEFF_LINE_3,'E');
    a11=str2num(COEFF_LINE_3(1:FIND_LOC_3_E(1)+3));
    a12=str2num(COEFF_LINE_3(FIND_LOC_3_E(1)+4:FIND_LOC_3_E(2)+3));
    a13=str2num(COEFF_LINE_3(FIND_LOC_3_E(2)+4:FIND_LOC_3_E(3)+3));
    a14=str2num(COEFF_LINE_3(FIND_LOC_3_E(3)+4:FIND_LOC_3_E(4)+3));

    %{
    Here, i will be calling function 'THERMOPROP' for calculating
    the specific heat, entropy and enthalpy by passing parameters includes
    coefficients, temperature range, and Middle global temperature.
    %}
    [Cp H S]=THERMOPROP(a1,a2,a3,a4,a5,a6,a7,a8,a9,a10,a11,a12,a13,a14,R,TEMP_RANGE,MIDDLE_GLOBAL_TEMP);

    %{
    Here, i will be calling function 'MOLECULAR_MASS' for calculating
    the molecular weight of the given species based on the atomic number.
    %}
    [MOL_WEIGHT(j)]=MOLECULAR_W(SPECIES_NAME);

    %{
    Here using the ' plot' function to plot graphs for Specific Heat,
    Enthalpy and Entropy with respective to local temperatures.
    %}

    %{
    the 'set' function would create a figure that was not visible and
    would make it the active figure, but it would have no effect on later
    figures that you create using figure() without the 'visible' parameter.
    %}
    set(0,'DefaultFigureVisible','off');

    %{
    figure: these objects are the individual windows on the screen in which
    MATLAB displays graphical output. figure creates a new figure object
    using default property values. Here it is stored in 'm'
    %}

    %{
    xlabel(txt) labels the x-axis of the current axes or standalone
    visualization. xlabel command replaces the old label with the new label

    ylabel(txt) labels the y-axis of the current axes or standalone
    visualization. xlabel command replaces the old label with the new label

    zlabel(txt) labels the z-axis of the current axes or standalone
    visualization. xlabel command replaces the old label with the new label
    %}

    %{
    The title is located at the top and in the center of the axes.
    title(' string ') outputs the string at the top and in the center of
    the current axes. title(fname) evaluates the function that returns a
    string and displays the string at the top and in the center of the
    current axes
    %}

    m(1)=figure;
    plot(TEMP_RANGE,Cp,'linewidth',5,'color','g');
    xlabel('TEMPERATURE (K)');
    ylabel('SPECIFIC HEAT (J/kg K)');
    title(['SPECIFIC HEAT Vs TEMPERATURE ',SPECIES_NAME]);


    m(2)=figure;
    plot(TEMP_RANGE,H,'linewidth',5,'color','c');
    xlabel('TEMPERATURE (K)');
    ylabel('ENTHALPY (J)');
    title(['ENTHALPY Vs TEMPERATURE ',SPECIES_NAME]);

    m(3)=figure;
    plot(TEMP_RANGE,S,'linewidth',5,'color','r');
    xlabel('TEMPERATURE (K)');
    ylabel('ENTROPY ((J/K)');
    title(['ENTROPY Vs TEMPERATURE ',SPECIES_NAME]);

    %{
    I am printing the specieis names along with Molecular weight in the
    command window.

    The fprintf function. The fprintf function is used for printing
    information to the screen. The fprintf function prints an array of
    characters to the screen:To "place" a number into this string of
    printed characters we use several formatting options, but they all
    start with a % sign.
    %}
    fprintf('SPECIES NAME:%s    \n',SPECIES_NAME)
    fprintf('MOLECULAR WEIGHT OF SPECIE:%f \n',MOL_WEIGHT(j))

    %{
    Here i am assigning the species name and molecular weight to the
    variable 'Molecular_weight_Data'.

    'sprintf'function creates a string variable. fprintf writes to a file
    or to the command window.
    %}
    Molecular_weight_Data=sprintf('Molecular weight of %s is %f ',SPECIES_NAME,MOL_WEIGHT(j));

    %{
    Now, i am changing my directory to the my interested location where i
    code creates individual folders with respective to species names by
    using function 'cd'.'cd' function changes to location of path or
    current folder
    %}
    cd('C:\Users\prudhvikumar\Desktop\NASA_Parsing');

    %Making or creating the directory/folder using the function 'mkdir'.
    mkdir(SPECIES_NAME);

    % Changing to the directory
     cd(SPECIES_NAME);

    %{
     Here, i am saving all the plots in format of'jpg'. This function saves
     figure or model using specified format.
    %}
    saveas(m(1),'SPECIFIC_HEAT_Vs_TEMPERATURE.jpg');
    saveas(m(2),'ENTHALPY_Vs_TEMPERATURE.jpg');
    saveas(m(3),'ENTROPY_Vs_TEMPERATURE.jpg');

    %{
     Here, i am saving all the plots in format of'fig'.
    %}
    saveas(m(1),'SPECIFIC_HEAT_Vs_TEMPERATURE.fig');
    saveas(m(2),'ENTHALPY_Vs_TEMPERATURE.fig');
    saveas(m(3),'ENTROPY_Vs_TEMPERATURE.fig');

    %{
    At this junction, i am saving extracted and calculated information into
    file named as 'OUTPUT_FILE.txt' by using 'fopen' function with write
    mode 'w'.
    %}
    OUTPUT_DATA=fopen('OUTPUT_FILE.txt','w');
    fprintf(OUTPUT_DATA,'%15s : %15s \n','SPECIES NAMES',SPECIES_NAME);
    fprintf(OUTPUT_DATA,'%15s : %15.3s \n','MOLECULAR WEIGHT',MOL_WEIGHT(j));
    fprintf(OUTPUT_DATA,'FOR THE LOCAL TEMPERATURE RANGE: %3.1fk to %3.1fk \n',LOWER_LOCAL_TEMP,HIGH_LOCAL_TEMP);
    fprintf(OUTPUT_DATA,'%6s %6s %16s %16s \n','TEMPERATURE (K)','SPECIFIC HEAT (J/kg K)','ENTHALPY (J)','ENTROPY (J/K)');
    fprintf(OUTPUT_DATA,'%11.2f %17.2f %19.2f %20.2f \n',TEMP_RANGE,Cp,H,S);

   cd('C:\Users\prudhvikumar\Desktop\NASA_Parsing');
end

    fprintf('\n THE OUTPUT FILE IS STORED');

    %{
    Here, i am using while loop to asking user to utilise based on his
    choice to know about various species from the information
    extracted from data file.
    %}
    while(1)
        % Here i provided options of user such that code case insensitive.
    I_P=input('\n DO YOU WANT TO STILL REQUEST INFORMATION ABOUT SPECIES ? Y or y/N or n:','s');
    I_P_U=upper(I_P);

    % User can enquire about the extracted information
    ENQUIRE=input('\n DO YOU NEED THERMODYNAMIC INFORMATION ABOUT SPECIES ? Y or y/N or n:\n','s');
    ENQUIRE_U=upper(ENQUIRE);

    if strcmpi(ENQUIRE_U,'Y')

        % User provides his input
        NAME_SPECIES=input('PLEASE PROVIDE INTERESTED SPECIES NAME in capital or small letters:','s');
        NAME_SPECIES_U=upper(NAME_SPECIES);

        % Based on input request, checks for extracted info
         cd('C:\Users\prudhvikumar\Desktop\NASA_Parsing');
         %{
           here , i am checking the requested species name is not matching
           in the directory
         %}

         if not(isfolder(NAME_SPECIES_U))
             fprintf('\n WRONG INPUT PROVIDED BY USER \n')
             fprintf('\n PLEASE PROVIDE CORRECT SPECIES NAME\n')
          else
              cd(NAME_SPECIES_U)

        %Based on user choice of species, the below information is provided
            openfig('SPECIFIC_HEAT_Vs_TEMPERATURE.fig','visible')
            openfig('ENTHALPY_Vs_TEMPERATURE.fig','visible')
            openfig('ENTROPY_Vs_TEMPERATURE.fig','visible')
            fprintf('REQUESTED PLOTS ARE OPENED \n')
            fprintf('QUERY ENDED \n')

        end


    elseif strcmpi(ENQUIRE_U,'N')
           fprintf('\n THANK YOU \n')
    else


    end
   if I_P_U=='N'
   % while loop breaks when user selects N or n
   break
   end
    end
% Here, i am closing all the files.
  fclose('all')


 % Functions

%{
This function is for calculating Molecular Weight.
%}
%{
here, i am passing Species names and based on atomic weight, i am
calculating molecular mass of species.
%}
function [MOL_WEIGHT]= MOLECULAR_W(SPECIES_NAME)
ATOMS=['O','H','C','N','S','A'];
ATOMIC_WEIGHT=[16,1,12,14,32,40];
MOL_WEIGHT=0;

%{
i am using for loop and based on the length of species name, i am
 determining weight.
%}
for d=1:length(SPECIES_NAME)
    for e=1:length(ATOMS)

        if strcmp(SPECIES_NAME(d),ATOMS(e))
            MOL_WEIGHT=ATOMIC_WEIGHT(e)+MOL_WEIGHT;
            l=e;
        end
    end

    % converting the string in to double numerical
    g=str2double(SPECIES_NAME(d));

    if g>1
        MOL_WEIGHT=ATOMIC_WEIGHT(l)*(g-1)+MOL_WEIGHT;

    end
end
end


% function2

%{
this is function for determining the Thermal properties based on the given data
%}
function [Cp H S]=THERMOPROP(a1,a2,a3,a4,a5,a6,a7,a8,a9,a10,a11,a12,a13,a14,R,TEMP_RANGE,MIDDLE_GLOBAL_TEMP)

%{
based on for loop with local temperature ranges and with low and high
temperature criteria, the Cp, S, H are calculated.
%}
for t=1:length(TEMP_RANGE)
    if TEMP_RANGE(t)>MIDDLE_GLOBAL_TEMP
        Cp(t)=R.*(a1+(a2.*(TEMP_RANGE(t))+(a3.*(TEMP_RANGE(t)).^2)+(a4.*(TEMP_RANGE(t)).^3)+(a5.*(TEMP_RANGE(t)).^4)));

        H(t)=R.*TEMP_RANGE(t).*((a1)+((a2.*(TEMP_RANGE(t)))./(2))+((a3.*((TEMP_RANGE(t)).^2))./(3))+((a4.*((TEMP_RANGE(t)).^3))./(4))+((a5.*((TEMP_RANGE(t)).^4))./(5))+((a6)./(TEMP_RANGE(t))));


        S(t)=R.*((a1.*log(TEMP_RANGE(t)))+(a2.*(TEMP_RANGE(t)))+((a3.*((TEMP_RANGE(t).^2))./(2)))+((a4.*((TEMP_RANGE(t).^3))./(3)))+((a5.*((TEMP_RANGE(t).^4))./(4)))+(a7));


    else
        Cp(t)=R.*(a8+(a9.*(TEMP_RANGE(t))+(a10.*(TEMP_RANGE(t)).^2)+(a11.*(TEMP_RANGE(t)).^3)+(a12.*(TEMP_RANGE(t)).^4)));


        H(t)=R.*TEMP_RANGE(t).*((a8)+((a9.*(TEMP_RANGE(t)))./(2))+((a10.*((TEMP_RANGE(t)).^2))./(3))+((a11.*((TEMP_RANGE(t)).^3))./(4))+((a12.*((TEMP_RANGE(t)).^4))./(5))+((a13)./(TEMP_RANGE(t))));


         S(t)=R.*((a8.*log(TEMP_RANGE(t)))+(a9.*(TEMP_RANGE(t)))+((a10.*((TEMP_RANGE(t).^2))./(2)))+((a11.*((TEMP_RANGE(t).^3))./(3)))+((a12.*((TEMP_RANGE(t).^4))./(4)))+(a14));


    end
end
end