Project 1 - Parsing NASA thermodynamic data
AIM:
- To Write a function that extracts the 14 co-efficients and calculates the enthalpy, entropy and specific heats for all the species in the data file. You will be reading this file NASA thermodynamic data.
- To Calculate the molecular weight of each species and display it in the command window.
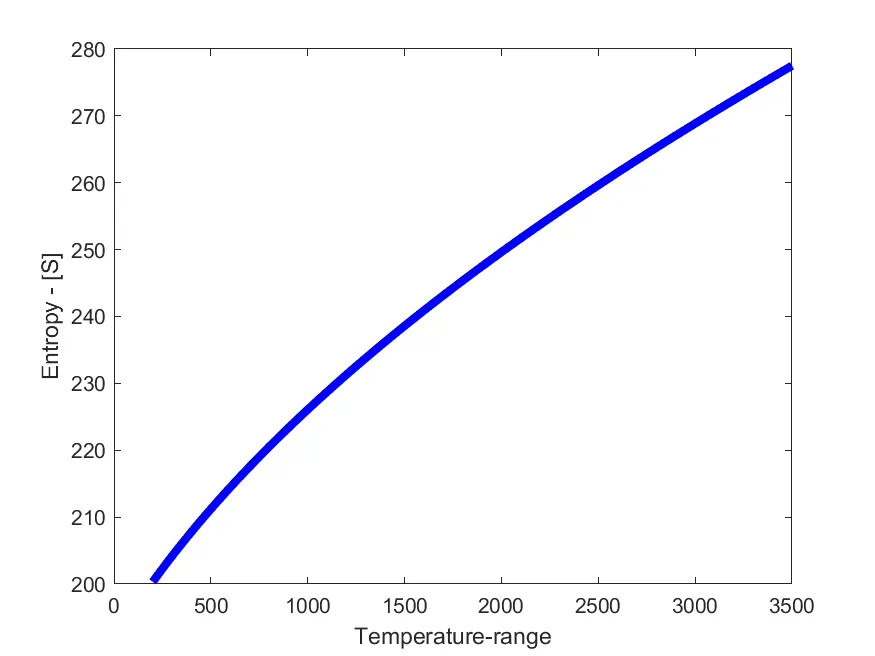
- To Plot the Cp, Enthalpy and Entropy for the local temperature range (low temperature : high temperature) specific for each species.
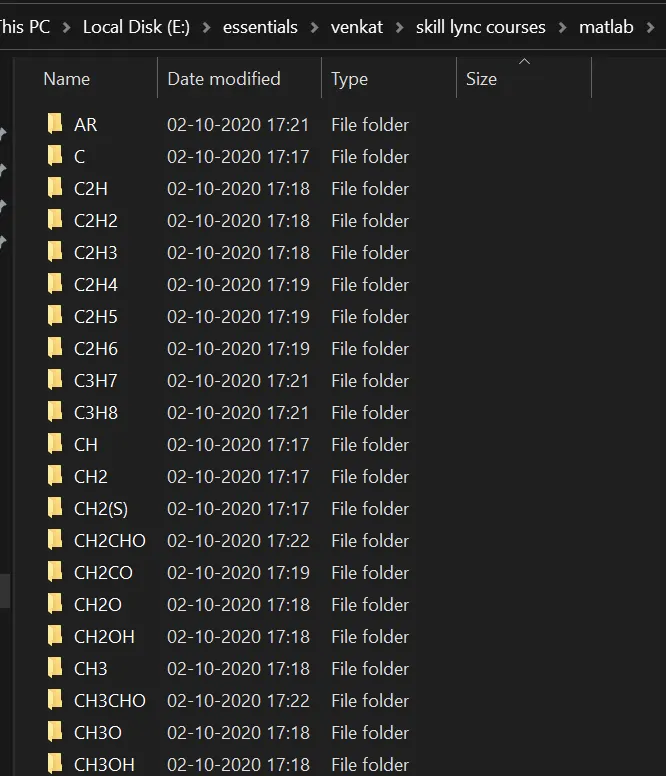
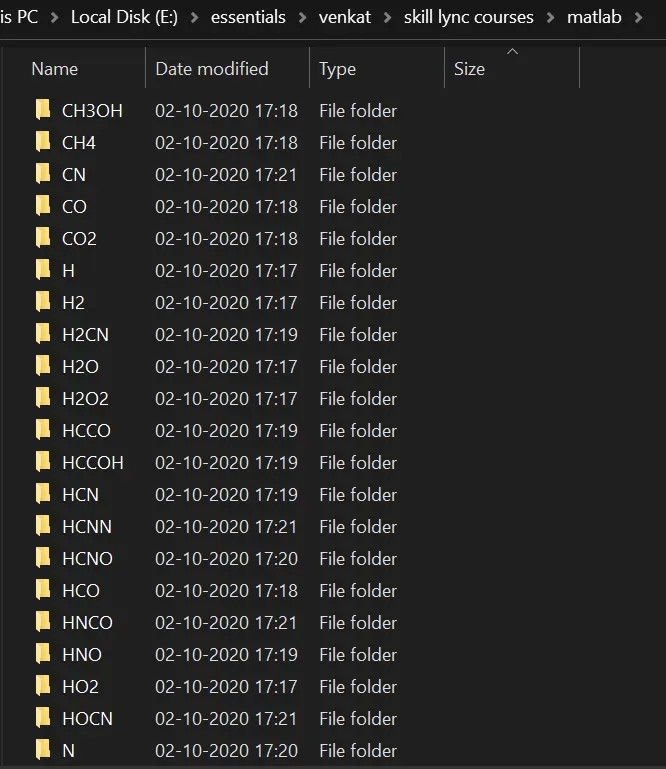
- To Save the plots as images with appropriate names and dump them in separate folders for each species with suitable name. All these should be generated automatically.
OBJECTIVE:
- To Write a function that extracts the 14 co-efficients and calculates the enthalpy, entropy and specific heats for all the species in the data file. You will be reading this file NASA thermodynamic data.
- The main program should just take the "THERMO.dat" file as an input and generate Cp, H and S plots.
- To write a detailed report to describe the logic of the program.
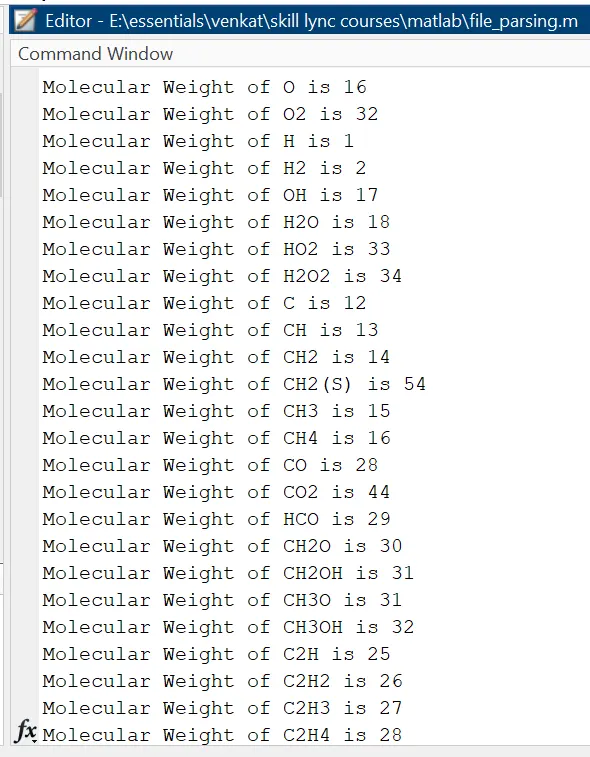
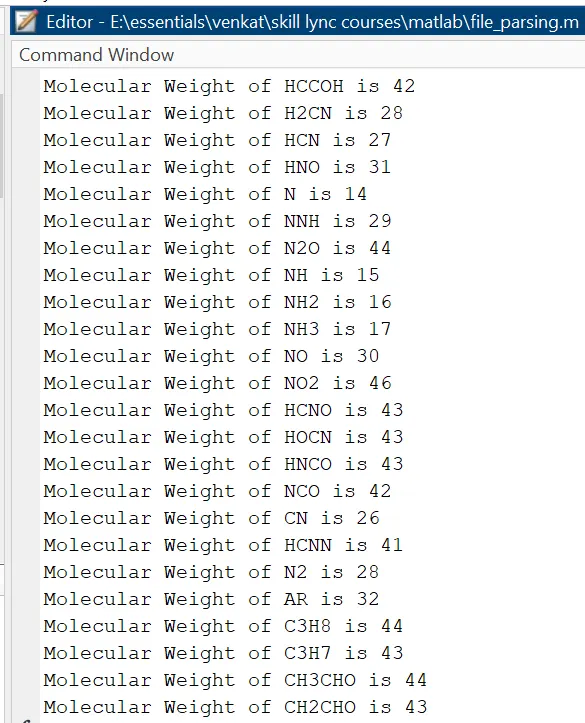
- To Calculate the molecular weight of each species and display it in the command window.
- To Plot the Cp, Enthalpy and Entropy for the local temperature range (low temperature : high temperature) specific for each species.
- To Save the plots as images with appropriate names and dump them in separate folders for each species with suitable name. All these should be generated automatically.
- To show plots for o2, N2 and Co2 species.
Formula:
Here R is the universal gas constant, T is the temeprature,H is Enthalpy,S is Entropy
& Cp is specific heat.
The FIRST 7 coefficients are HIGH-temperature coefficients and the SECOND 7 coefficients are LOW-temperature coefficients.
PROCEDURE(to code):
- Intially we need to write a code to read a file of Thermo and extract values from it.We use commands like fgetl to skip the unwanted lines from the text file,and use other inbuilt matlab commands to find read each and every line of the text file and store the values like a1,a2,a3.....a14 for each and every element in order to find other parameters.
- For finding molecular weight we take individual elements like H,C,N,O..etc using this elements atomic weights we find the molecular weights of the species.
- In order to create seperate folder for each and every species we use cd,mkdir,pwd commands and will create for each and every elements .
- The code for it is shown below:
clear all;
close all;
clc;
%% reading the header of the file
fid = fopen('THERMO.txt');
tline00 = fgetl(fid);
tline1 = fgetl(fid);
%%tline = fgetl(fid);
%% reading second line
z = strsplit(tline1,' ');
GLOBAL_TEMP_HIGH = str2double(z{2});
GLOBAL_TEMP_MEDIUM = str2double(z{3});
GLOBAL_TEMP_LOW = str2double(z{4});

%% skipping the commented lines
for i = 1:3
 skip = fgetl(fid);
end
%% checking for the no. of species
frewind(fid);
tline0 = 0;
while ~feof(fid)
    tline = fgetl(fid);
    %%to check for end
    a = sscanf(tline,'%c');
    b=a(1:3);
    if b == 'END'
        break;
    end
    tline0 = tline0 + 1;
end
%% calculating the no. of species
no_of_species = (tline0-5)/4;
frewind(fid);
%% skipping the first five lines
for j = 1:5
   skip1 = fgetl(fid);
end
%% for each species
for k = 1:no_of_species
    tline6 = fgetl(fid);
    %%for splitting the string
    q = strsplit(tline6,' ');
    species_name1 = q(1);
    species_name = q{1};
    species_name2(k)= species_name1;
    %%finding the location of G
    loc = strfind(tline6,'G');
    %%finding the temperature values
    local_temp_low = str2double(tline6(loc+4:loc+10));
    local_temp_high = str2double(tline6(loc+13:loc+20));
    local_temp_medium = str2double(tline6(loc+23:loc+30));

%% for finding the coefficients in line7
tline7 = fgetl(fid);
loc1 = strfind(tline7,'E');
a1 = str2double(tline7(1:loc1+3));
a2 = str2double(tline7(loc1+4:loc1(2)+3));
a3 = str2double(tline7(loc1(2)+4:loc1(3)+3));
a4 = str2double(tline7(loc1(3)+4:loc1(4)+3));
a5 = str2double(tline7(loc1(4)+4:loc1(5)+3));

%% for finding the coefficients in line8
tline8 = fgetl(fid);
loc2 = strfind(tline8,'E');
a6 = str2double(tline8(1:loc2+3));
a7 = str2double(tline8(loc2+4:loc2(2)+3));
a8 = str2double(tline8(loc2(2)+4:loc2(3)+3));
a9 = str2double(tline8(loc2(3)+4:loc2(4)+3));
a10 = str2double(tline8(loc2(4)+4:loc2(5)+3));

%% for finding the coefficients in line9
tline9 = fgetl(fid);
loc3 = strfind(tline9,'E');
a11 = str2double(tline9(1:loc3+3));
a12 = str2double(tline9(loc3+4:loc3(2)+3));
a13 = str2double(tline9(loc3(2)+4:loc3(3)+3));
a14 = str2double(tline9(loc3(3)+4:loc3(4)+3));

%% value for universal gas constant(j/m*k)
R = 8.314;
%% for calculating cp
temp_range = linspace(local_temp_low,local_temp_high,100);
cp = cp_function(a1,a2,a3,a4,a5,a6,a7,a8,a9,a10,a11,a12,a13,a14,temp_range,R,local_temp_low,local_temp_medium,local_temp_high);
H = enthalphy_function(a1,a2,a3,a4,a5,a6,a7,a8,a9,a10,a11,a12,a13,a14,temp_range,R,local_temp_low,local_temp_medium,local_temp_high);
S = entropy_function(a1,a2,a3,a4,a5,a6,a7,a8,a9,a10,a11,a12,a13,a14,temp_range,R,local_temp_low,local_temp_medium,local_temp_high);
[mol_wt] =molecular_weight(species_name);
%% creating new folder for each species
data = sprintf('%s',species_name);
%% assigning path of the current folder
c_d = pwd;
%% creating new folder
mkdir(data);
%% setting path as current directory for plots
cd(data);
%% plotting graphs for H,S,CP with local temperature ranges
figure(1)
plot(temp_range,H,'color','r','linewidth',4);
xlabel('Temperature-range');
ylabel('Enthalpy  - [H]');
getframe(gcf);
saveas(gcf,'Enthalpy plot.png')
%%subplot(3,1,1);
figure(2)
plot(temp_range,S,'color','b','linewidth',4);
xlabel('Temperature-range');
ylabel('Entropy - [S]');
getframe(gcf);
saveas(gcf,'Entropy plot.png');
%%subplot(3,1,2);
figure(3)
plot(temp_range,cp,'color','y','linewidth',4);
%%subplot(3,1,3);
xlabel('Temperature-range');
ylabel('Specific Heat - [cp]');
getframe(gcf);
saveas(gcf,'cp plot.png');
%% setting again the directory as current directory
cd(c_d);
end
- We use a loop in order to find the no. of species available in the text file which is shown below:
%% checking for the no. of species
frewind(fid);
tline0 = 0;
while ~feof(fid)
    tline = fgetl(fid);
    %%to check for end
    a = sscanf(tline,'%c');
    b=a(1:3);
    if b == 'END'
        break;
    end
    tline0 = tline0 + 1;
end
- After reading the values from the text files using the above we create individual function for calculating Enthalpy,Entropy,cp for the each species element.
- For Cp the below function is used to get values for each element.
function cp = cp_function(a1,a2,a3,a4,a5,a6,a7,a8,a9,a10,a11,a12,a13,a14,temp_range,R,local_temp_low,local_temp_medium,local_temp_high)
t1 = linspace(local_temp_low,local_temp_medium,100);
t2 = linspace(local_temp_medium,local_temp_high,100);
if temp_range>local_temp_medium
    cp =  R*(a1+(a2.*t2)+(a3.*t2.^2)+(a4.*t2.^3)+(a5.*t2.^4));
else
    cp =  R*(a8+(a9.*t1)+(a10.*t1.^2)+(a11.*t1.^3)+(a12.*t1.^4));
end

end- For Enthalpy the below function is used to get values for each element.
function H = enthalphy_function(a1,a2,a3,a4,a5,a6,a7,a8,a9,a10,a11,a12,a13,a14,temp_range,R,local_temp_low,local_temp_medium,local_temp_high)
t1 = linspace(local_temp_low,local_temp_medium,100);
t2 = linspace(local_temp_medium,local_temp_high,100);
if temp_range>local_temp_medium
    H =  (R.*t2).*(a1+(a2.*t2/2)+(a3.*(t2.^2/3))+(a4.*(t2.^3/4))+(a5.*(t2.^4/5))+a6./t2);
else
    H =  (R.*t1).*(a8+(a9.*t1)+(a10.*(t1.^2/3))+(a11.*(t1.^3/4))+(a12.*(t1.^4/5))+a13./t1);
end

end- For Entropy the below function is used to get values for each element.
function S = entropy_function(a1,a2,a3,a4,a5,a6,a7,a8,a9,a10,a11,a12,a13,a14,temp_range,R,local_temp_low,local_temp_medium,local_temp_high)
t1 = linspace(local_temp_low,local_temp_medium,100);
t2 = linspace(local_temp_medium,local_temp_high,100);
if temp_range>local_temp_medium
    S =  R *(a1.*log(t2)+(a2.*t2/2)+(a3.*(t2.^2/3))+(a4.*(t2.^3/4))+(a5.*(t2.^4/5))+a7);
else
    S =  R *(a8.*log(t1)+(a9.*t1)+(a10.*(t1.^2/3))+(a11.*(t1.^3/4))+(a12.*(t1.^4/5))+a14);
end

end
- After this we need to find the molecular weight of the individual species for this i have used a function for finding the molecular weight of species which is shown below
function [mol_wt] = molecular_weight(species_name)
Atomic_Mass = [1,12,14,16,32,40];
Elements = ['H','C','N','O','A','S'];
mol_wt = 0;
position = 0;
for i =1:length(species_name)
    for j = 1:length(Elements)
        if (strcmp(species_name(i),Elements(j))==1)
        mol_wt = mol_wt+Atomic_Mass(j);
        position = j;
        else
            num=str2double(species_name(i));
        end
    end
%%num=str2double(species_name(i));
if num>1
    mol_wt=mol_wt+Atomic_Mass(position)*(num-1);
end
end
fprintf('Molecular Weight of %s is %d\n',species_name,mol_wt);
end
Plots:
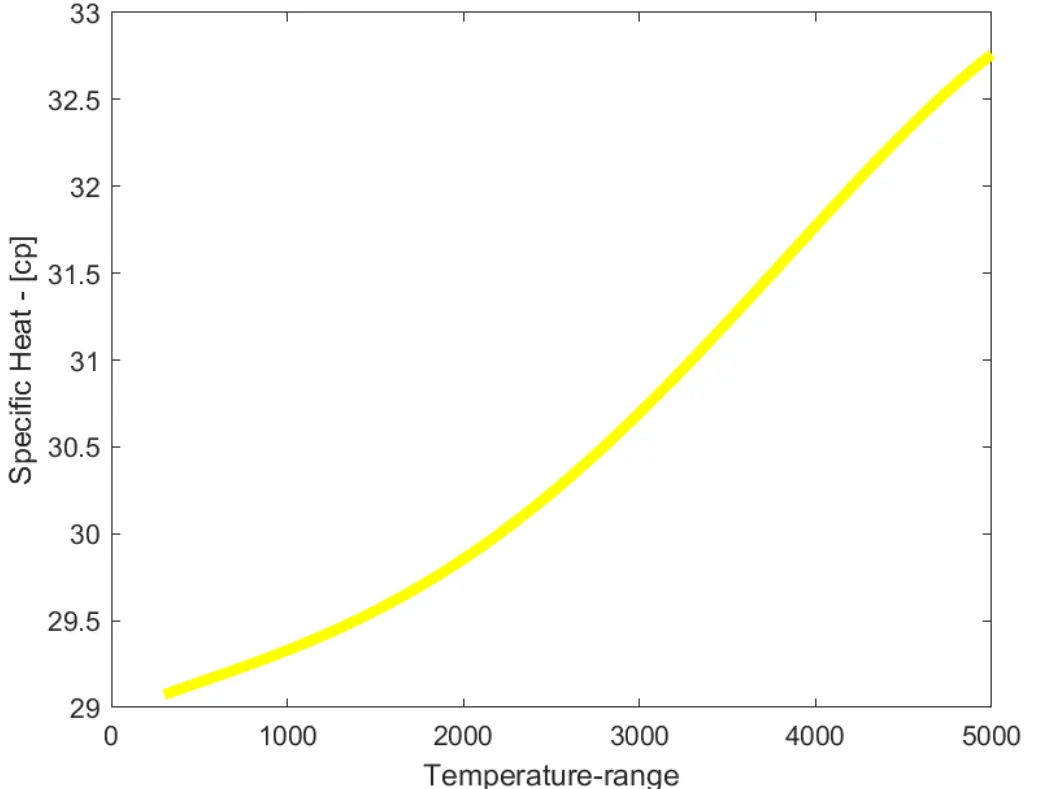
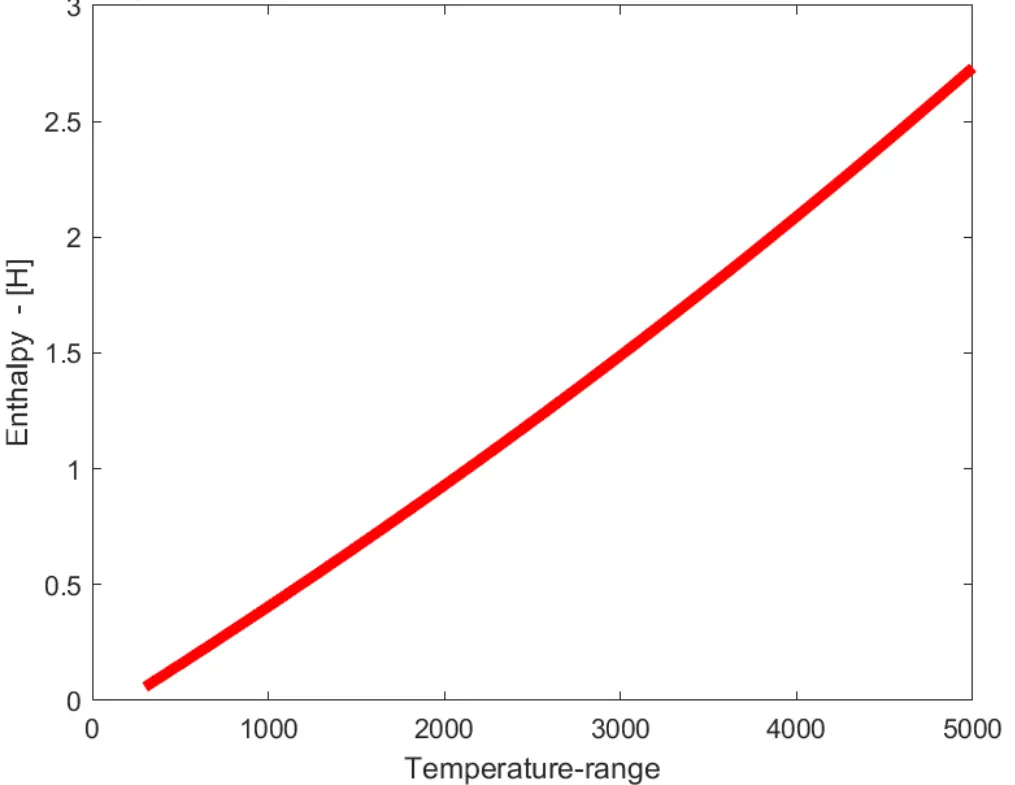
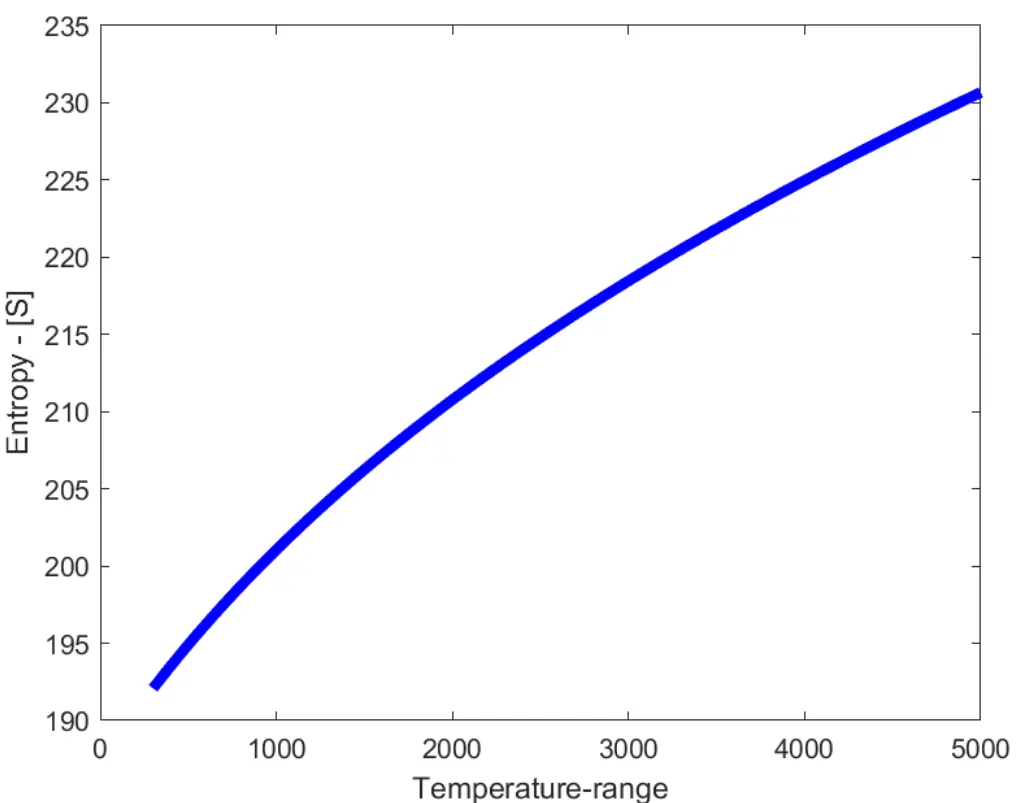
For N2 :
- CP vs Temp:
- Enthalpy vs Temp:
- Entropy vs Temp:
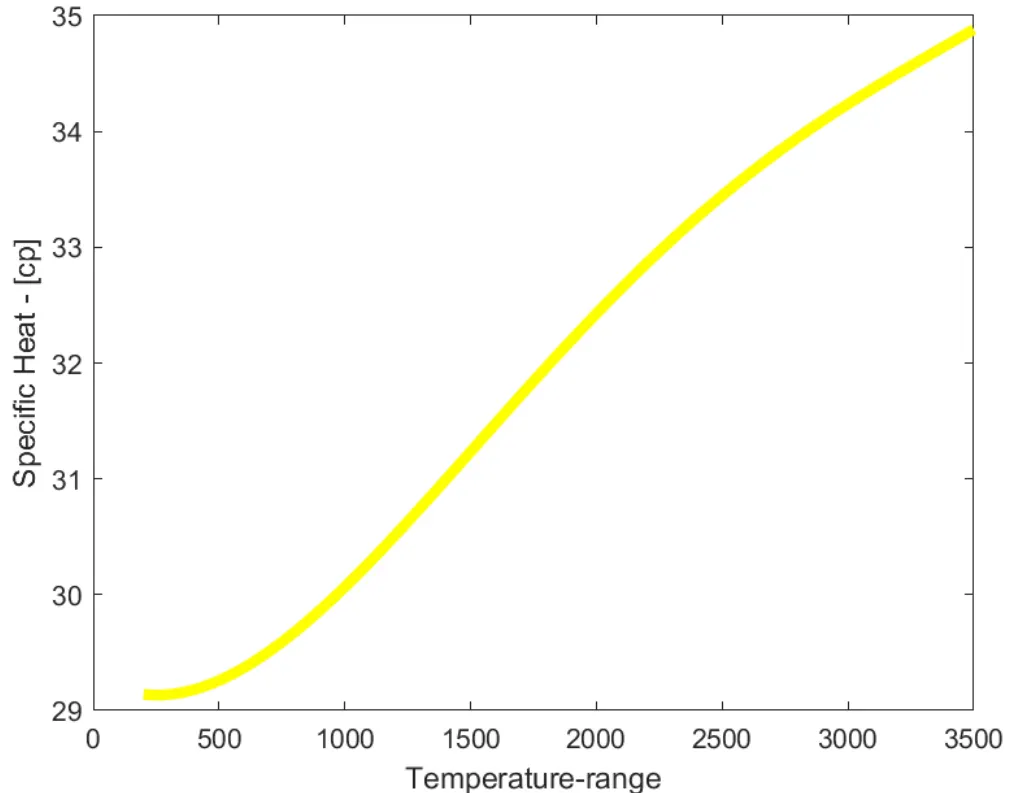
For 02:
- CP vs Temp:
- Enthalpy vs Temp:
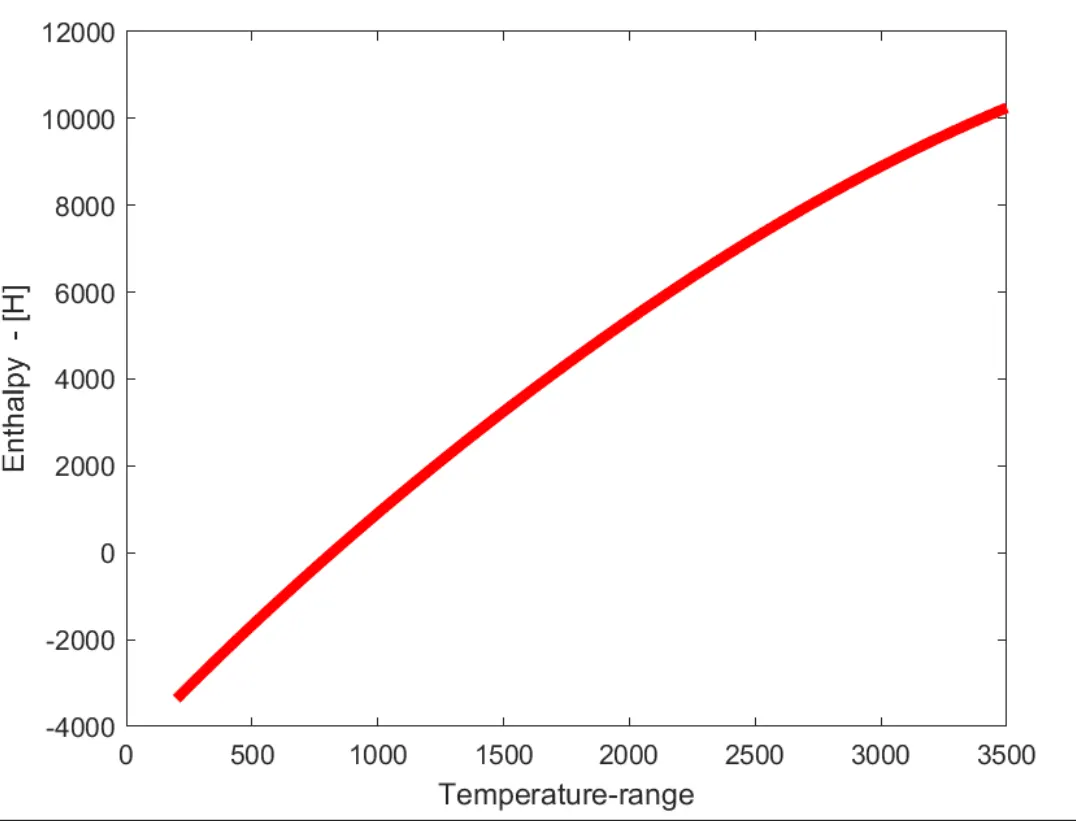
- Entropy vs Temp:
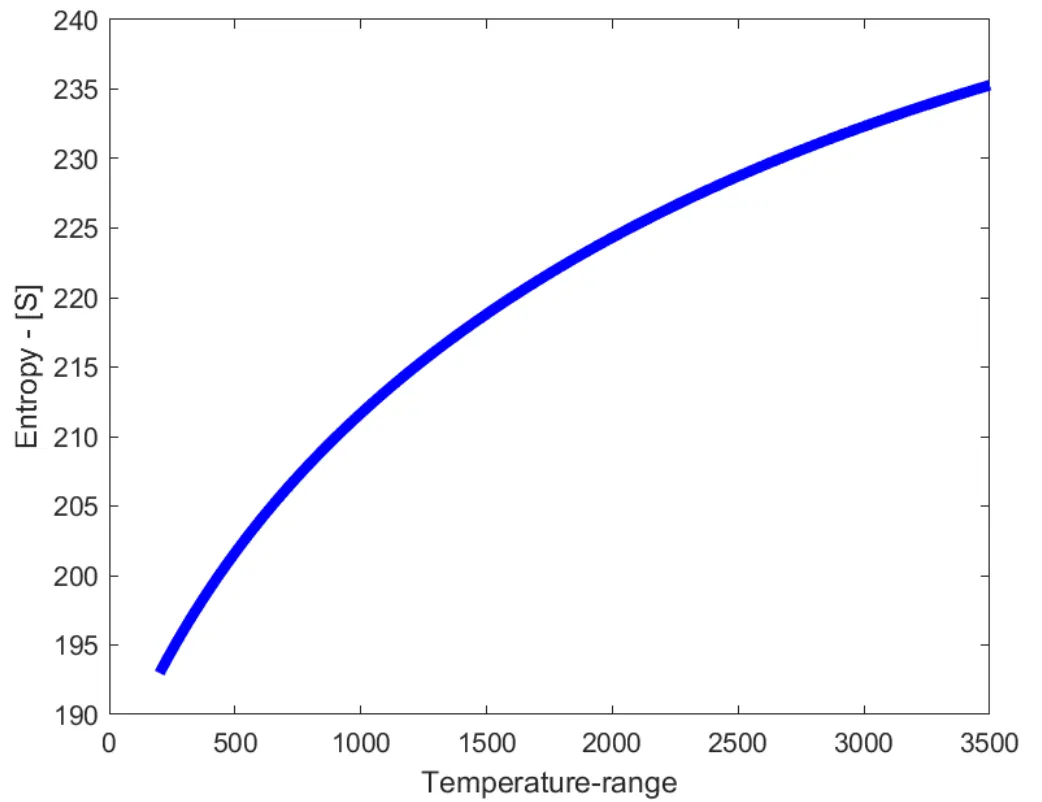
FOR CO2:
- CP vs Temp:
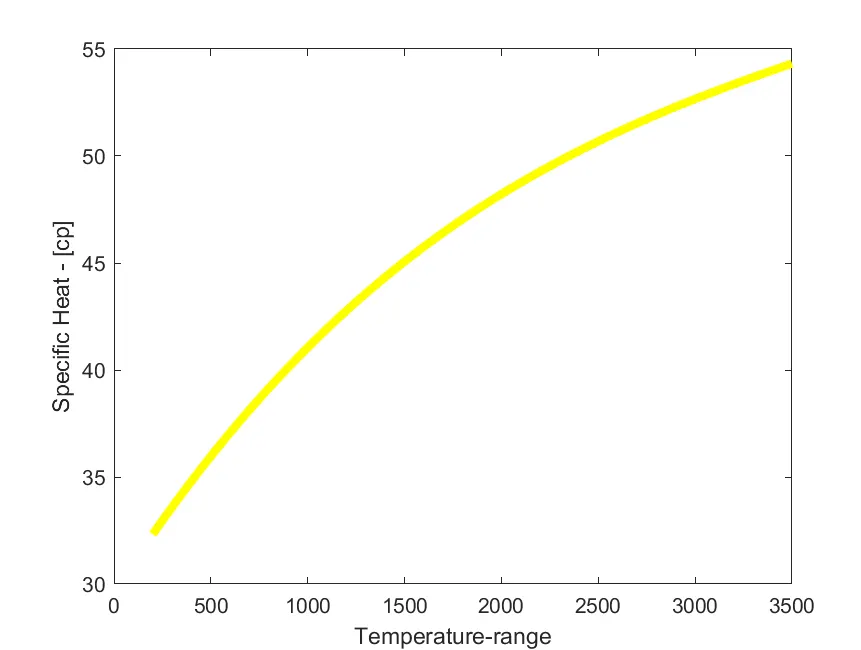
- Enthalpy vs Temp:
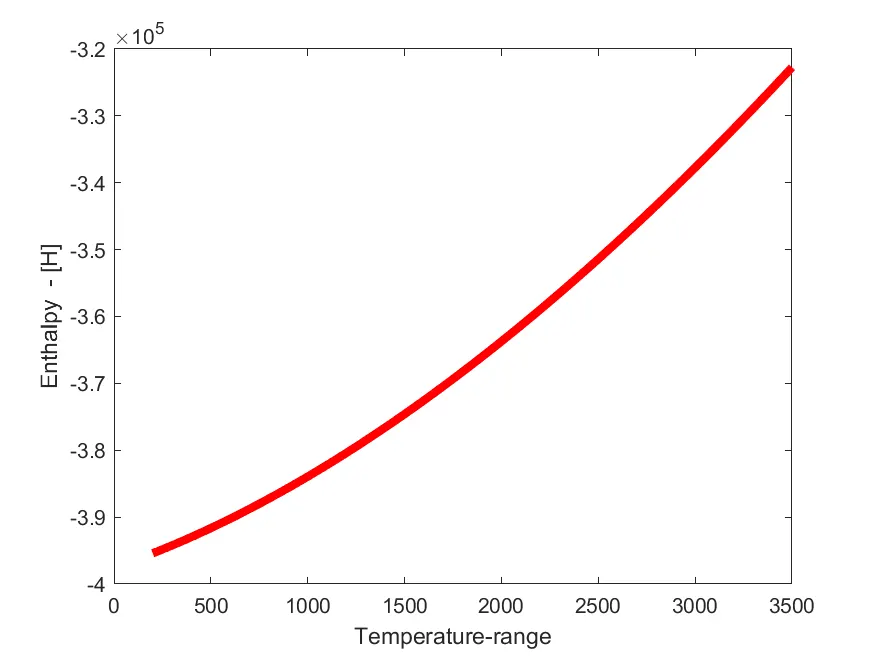
- Entropy vs Temp:
REPORT :
During this i have encountered many problems and i have attached some of the screen shots below:
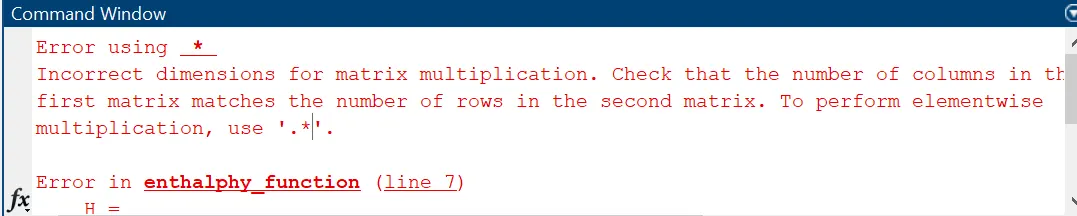
- While finding enthalpy i used normal multiplication which is not possible as the dimension are not same for matrix multiplication so in order to rectify this used .* for element wise multiplication.
RESULT:
- CREATING A SEPERATE FOLDER FOR EACH SPECIES AND STORING THE SPECIFIC PLOTS ARE SHOWN BELOW:

- MOLECULAR WEIGHTS OF THE INDIVIDUAL SPECIES IN THE COMMAND WINDOW IS SHOWN BELOW:
CONCLUSION:
- We have succesfully created a function that extracts the 14 co-efficients and calculates the enthalpy, entropy and specific heats for all the species in the data file.
- We have succesfully plotted the results for each and every species and stored them seperately in their respective folders
- We have succesfully calculated the molecular weight of each and every species.
- We have found Enthalpy,Entropy,Cp for each and every species.