Project 1 - Parsing NASA thermodynamic data
Title: Parsing NASA thermodynamic data
Objective:
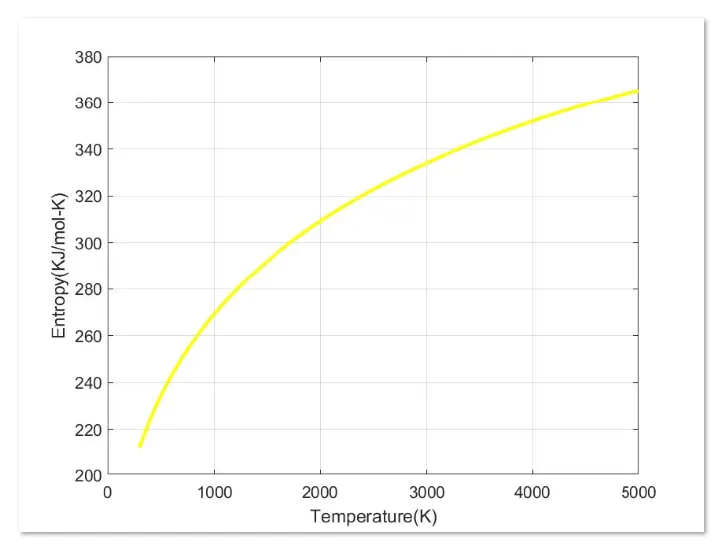
1) - Read and extract data from NASA thermodynamic data.
2) - Calculate the molecular weight of each species.
3) - Calculates the enthalpy, entropy and specific heats for all the species in the data file.
4) - To plot the Cp, H and S using LOCAL TEMPERATURE RANGES which is unique for each individual species, not the GLOBAL TEMPERATURE RANGE.
5) - Calculate molecular weight.
6) - Save all plot for specific spiece in appropriate directory.
The NASA polynomials have the form:
Cp/R = a1 + a2 T + a3 T^2 + a4 T^3 + a5 T^4
H/RT = a1 + a2 T /2 + a3 T^2 /3 + a4 T^3 /4 + a5 T^4 /5 + a6/T
S/R = a1 lnT + a2 T + a3 T^2 /2 + a4 T^3 /3 + a5 T^4 /4 + a7
The FIRST 7 coefficients are HIGH-temperature coefficients and the SECOND 7 coefficients are LOW-temperature coefficients
Main code
clear all
close all
clc
%Input
R = 8.314;
%opening the Nasa Thermodynamic Data file
f1 = fopen('THERMO.dat','r')

%Using "fgetl" command read the first 2 line
line_1= fgetl(f1);
line_2= fgetl(f1);

%Obtaining global temprature values
%Split the line by using "strsplit" command
global_temp_value = strsplit(line_2,' ')

%save global temprature value as a saperate value - convert the string cell into number using str2num
global_low_temp = str2num(global_temp_value{1})
global_mid_temp = str2num(global_temp_value{2})
global_high_temp= str2num(global_temp_value{3})

temp = [global_low_temp global_mid_temp global_high_temp];
%Temperature range
Temp_range = linspace(global_low_temp,global_high_temp,1000);

%reading the line 3,4 and 5
line_3 = fgetl(f1);
line_4 = fgetl(f1);
line_5 = fgetl(f1);

%reading the species%a
%line_6 = fgetl(f1)
% reading the Species
for i = 1:53
    tline = fgetl(f1);

  %split line using "strsplit"
    A = strsplit(tline,' ')
  % reading the species name
    species = (A{1});
   % convert strings cell to number using "strnum2" command
   lowtemp = str2num(A{end-3});
   midtemp = str2num(A{end-2});
   hightemp = str2num(A{end-1});

  %reading next line
   tline1 = fgetl(f1);
   %finding the E using "strfind"

   a = strfind(tline1,'E');
   %Finding the higher and lower temp coefficients
   a1 = tline1(1:a(1)+3);
   a1 = str2num(a1);
   a2 = tline1(a(1)+4:a(2)+3);
   a2 = str2num(a2);
   a3 = tline1(a(2)+4:a(3)+3);
   a3 = str2num(a3);
   a4 = tline1(a(3)+4:a(4)+3);
   a4 = str2num(a4);
   a5 = tline1(a(4)+4:a(5)+3);
   a5 = str2num(a5);

   tline2 = fgetl(f1);
   b = strfind(tline2,'E');
   a6 = tline2(1:b(1)+3);
   a6 = str2num(a6);
   a7 = tline2(b(1)+4:b(2)+3);
   a7 = str2num(a7);
   a8 = tline2(b(2)+4:b(3)+3);
   a8 = str2num(a8);
   a9 = tline2(b(3)+4:b(4)+3);
   a9 = str2num(a9);
   a10 = tline2(b(4)+4:b(5)+3);
   a10 = str2num(a10);

   tline3 = fgetl(f1);
   c = strfind(tline3, 'E');

   a11 = tline3(1:c(1)+3);
   a11 = str2num(a11);
   a12 = tline3(c(1)+4:c(2)+3);
   a12 = str2num(a12);
   a13 = tline3(c(2)+4:c(3)+3);
   a13 = str2num(a13);
   a14 = tline3(c(3)+4:c(4)+3);
   a14 = str2num(a14);

   %a1,a2,a3,a4,a5,a6,a7 = High temperature coefficients
   %a8,a9,a10,a11,a12,a13,a14 = Low temperature coefficients

   % finding the Cp by writing funtion tool
   Cp = Specific_heat(a1,a2,a3,a4,a5,a8,a9,a10,a11,a12,Temp_range,R,temp);

   % finding the S by writing funtion tool
   S = Entropy(a1,a2,a3,a4,a5,a6,a7,a8,a9,a10,a11,a12,a14,Temp_range,R,temp);

   % finding the S by writing funtion tool
   H = Enthalpy(a1,a2,a3,a4,a5,a6,a8,a9,a10,a11,a12,a13,Temp_range,R,temp);

   % finding the W(Molecular weight) by writing funtion tool
   W = molecular_weight(species);

   %writing molecular weight file
   M_weight = fopen('Molecular_weight.txt','w');
   fprintf(M_weight,'Molecular weight of %s is %d',species,W);
   fclose(M_weight);

   %plotting Cp, H and S with Temperature
   %crate new folder and save in that folder
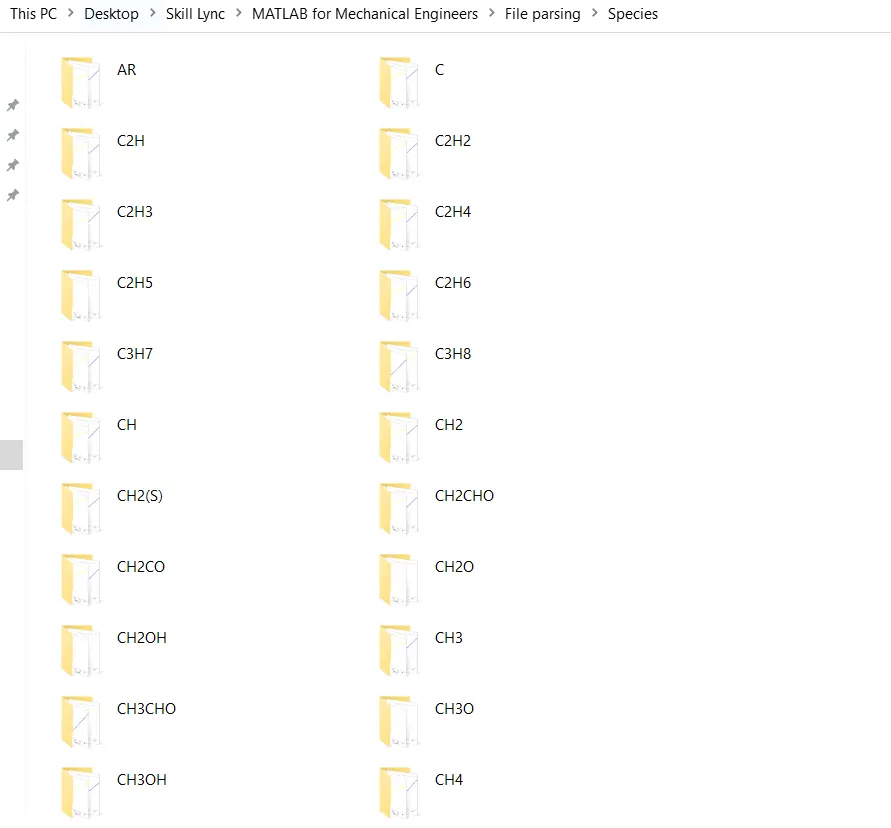
   cd('C:\Users\pkpat\Desktop\Skill Lync\MATLAB for Mechanical Engineers\File parsing\Species')
   mkdir(species);
   cd(species)

   %Plot 1 - Specific heat(Cp) vs Temperature(T)and save in specific folder

   figure(1)
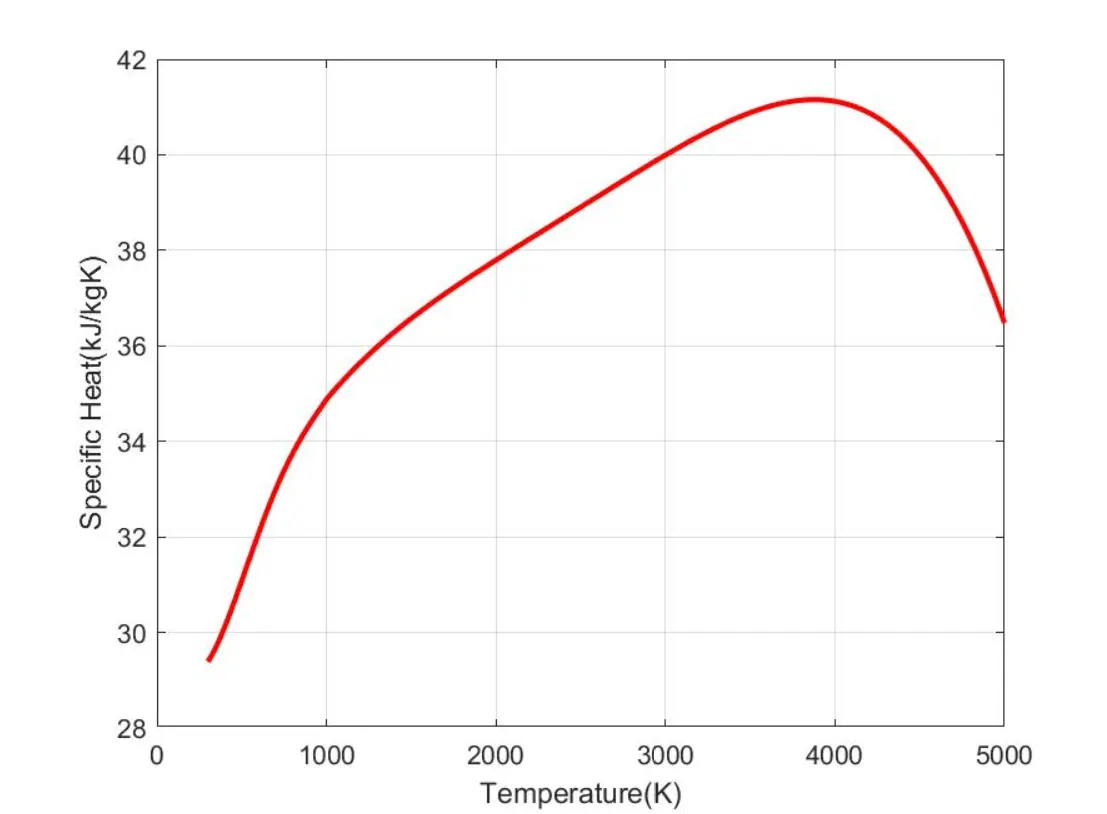
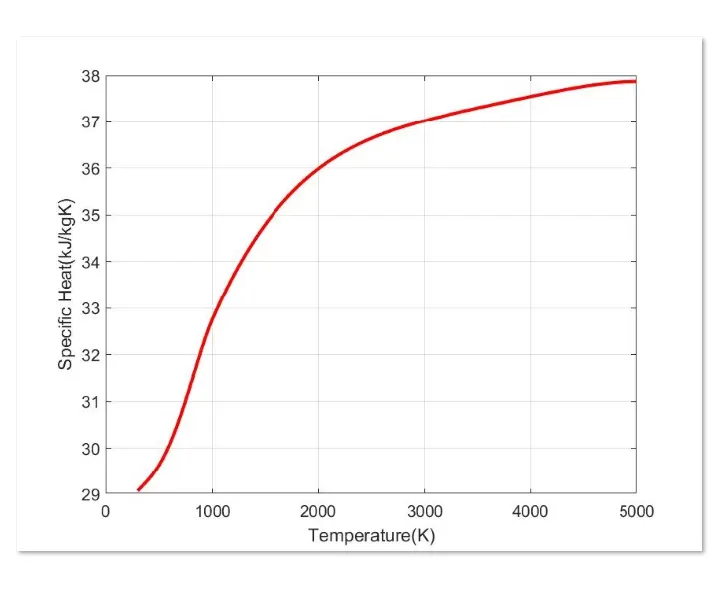
   plot(Temp_range,Cp,'linewidth',2,'color','r');
   xlabel('Temperature(K)');
   ylabel('Specific Heat(kJ/kgK)');
   grid on
   saveas(figure(1),'Specific Heat.jpg');

   %Plot 1 - Enthalpy vs Temperature(T)

   figure(2)
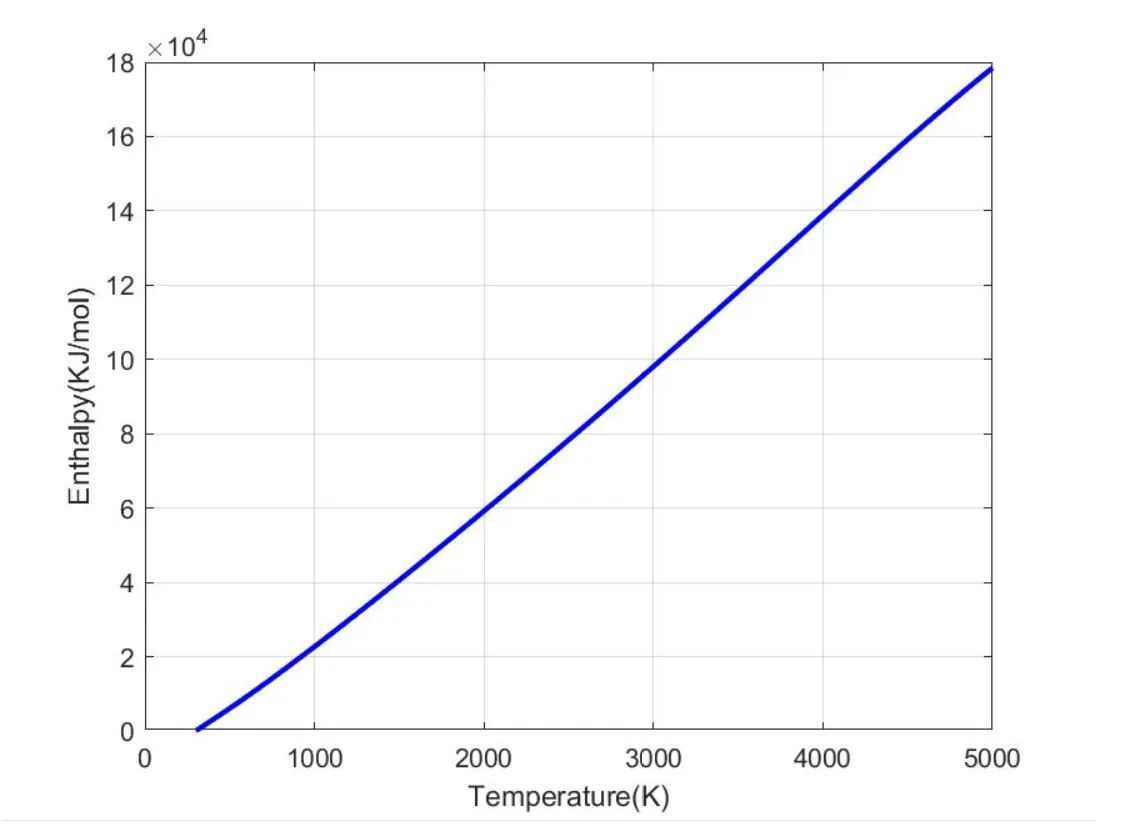
   plot(Temp_range,H,'linewidth',2,'color','b')
   xlabel('Temperature(K)');
   ylabel('Enthalpy(KJ/mol)');
   grid on
   saveas(figure(2),'Enthalpy.jpg');

   %Plot 1 - Entropy(S) vs Temperature(T)
   figure(3)
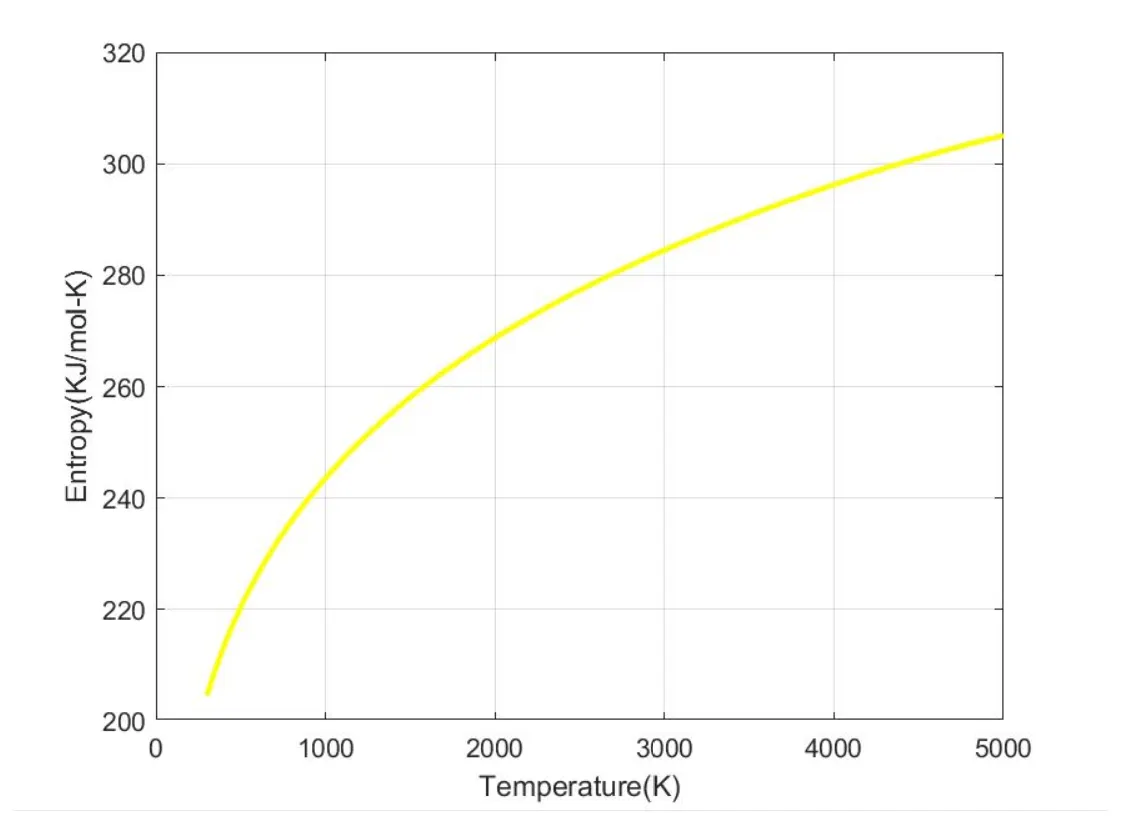
   plot(Temp_range,S,'linewidth',2,'color','y')
   xlabel('Temperature(K)');
   ylabel('Entropy(KJ/mol-K)');
   grid on
   saveas(figure(3),'Entropy.jpg');

   cd('C:\Users\pkpat\Desktop\Skill Lync\MATLAB for Mechanical Engineers\File parsing')

   %display molecular weight in the command window

   W = molecular_weight(species)

end
Specific Heat(Cp) Function
function Cp = Specific_heat(a1,a2,a3,a4,a5,a8,a9,a10,a11,a12,Temp_range,R,temp);


for i = 1:length(Temp_range)
if ( Temp_range(i) <= temp(2))
    Cp(i) = R*(a8 +(a9*Temp_range(i)) + (a10*(Temp_range(i)).^2)+ (a11*(Temp_range(i)).^3)+(a12*(Temp_range(i)).^4));
else
    Cp(i) = R*(a1 + (a2*Temp_range(i))+(a3*(Temp_range(i)).^2)+(a4*(Temp_range(i)).^3)+(a5*(Temp_range(i)).^4));
end

end
Enthalpy(H) Function
function H = Enthalpy(a1,a2,a3,a4,a5,a6,a8,a9,a10,a11,a12,a13,Temp_range,R,temp);
for i = 1:length(Temp_range)
if (Temp_range(i) <= temp(2))
    H(i) = R*(a8.*(Temp_range(i)) + (a9*((Temp_range(i)).^2)/2) + ((a10*(Temp_range(i)).^3)/3) + ((a11*(Temp_range(i)).^4)/4) + ((a12*(Temp_range(i)).^5)/5) + a13);
else
    H(i) = R*(a1*(Temp_range(i)) + (a2*((Temp_range(i)).^2)/2) + ((a3*(Temp_range(i)).^3)/3) + ((a4*(Temp_range(i)).^4)/4) + ((a5*(Temp_range(i)).^5)/5) + a6)
end
end
Entropy(S) Function
function S = Entropy(a1,a2,a3,a4,a5,a6,a7,a8,a9,a10,a11,a12,a14,Temp_range,R,temp);

for i = 1:length(Temp_range)
if Temp_range(i) <= temp
    S(i) = R*((a8.*log(Temp_range(i))) + (a9*Temp_range(i)) + ((a10*(Temp_range(i)).^2)/2) + ((a11*(Temp_range(i)).^3)/3) + ((a12*(Temp_range(i)).^4)/4) + a14);
else
    S(i) = R*(a1.*log(Temp_range(i)) + (a2*Temp_range(i)) + ((a3*(Temp_range(i)).^2)/2) + ((a4*(Temp_range(i)).^3)/3) + ((a5*(Temp_range(i)).^4)/4) + a7)
end
end
Result
1) Plot Cp vs T for O2
2) Plot H vs T for O2
3) Plot S vs T for O2
1) Plot Cp vs T for N2
2) Plot H vs T for N2
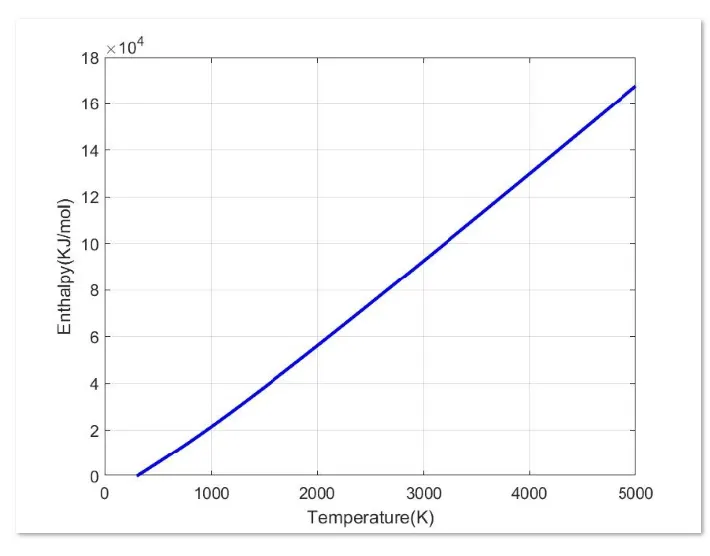
3) Plot S vs T for N2
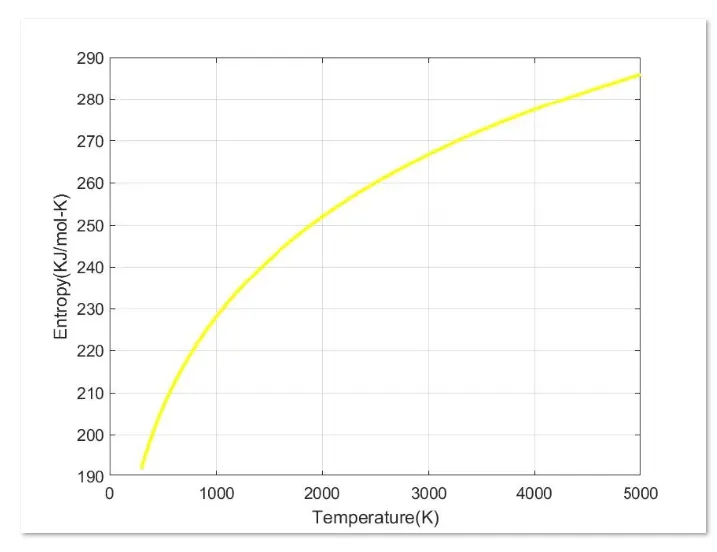
1) Plot Cp vs T for Co2
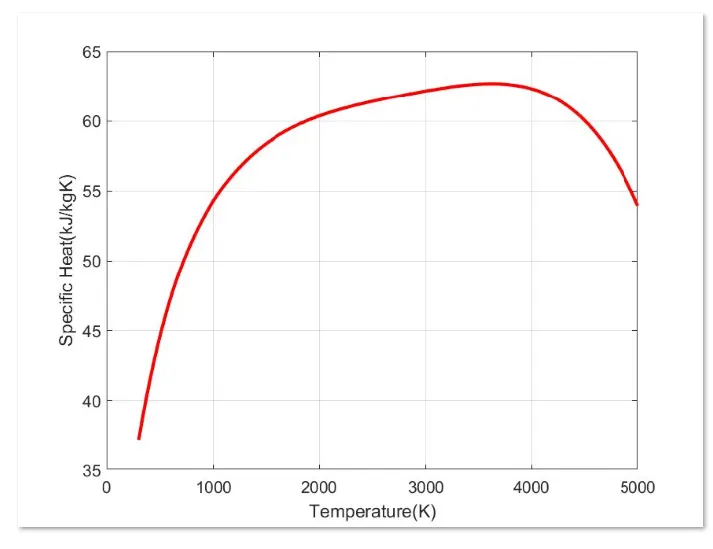
2) Plot H vs T for Co2
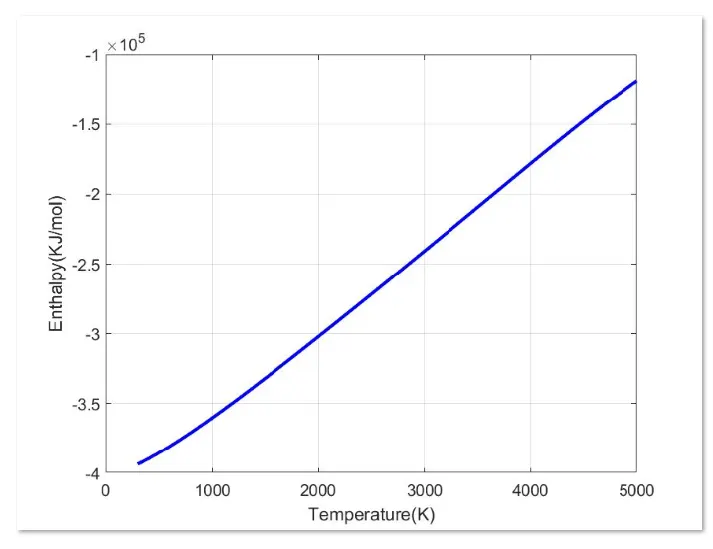
3) Plot S vs T for Co2
Folder Contaning all data for all species.

Error:
1) plot was not showing result
its happen because x-coordinate and y-coordinate was not same
once defien the Tempreature range its work.
Referance:
1)http://combustion.berkeley.edu/gri_mech/data/nasa_plnm.html