Project 1 - Parsing NASA thermodynamic data
Prjoject:--Parsing NASA Thernodynamic Data.
Aim of the project:-- 1) Minutely reading the NASA thermodynamic data, line by line from THERMO.dat file & plotting the three thermodynamical properties (Cp, enthalpy, entropy) at higher & lower temperature for 53 different species. Calculating molecular weight of all those species. Saving those plotes at seperate directory. All these are done automatically through programing by MATLAB & only input is THERMO.dat file.
Brief description of the project:-- In this project we are given the assignment to make code in MATLAB for File parsing of NASA Thermodynamic data. For this we are given THERMO.dat file
Through the program in MATLAB
1) Three thermodynamic properties Cp(Specific heat at constant pressure), H(Enthalpy), S(Entropy) for 53 different species are to be calculated at lower temperature & higher temperature range.
For the calculation of those thermodynamic properties the required fomulas are given below.
Cp/R = a1 + a2 T + a3 T^2 + a4 T^3 + a5 T^4
H/RT = a1 + a2 T/2 + a3 T^2 /3 + a4 T^3 /4 + a5 T^4 /5 + a6 /T
S/R = a1 Log(T) + a2 T + a3 T^2 /2 + a4 T^3 /3 + a5 T^4 /4 + a7
Here, R - Universal gas constant, T - Temperature in kelvin scale, a1, a2, a3 .... a7 are coefficients.
In the Thermo.dat file, values of two sets of co-efficients for 53 nos of species are given.
Values of 1st set of 7 nos of coefficients are used for higher temperature range & values of 2nd set of 7 coefficients are used for lower temperature range.
For these the THERMO.dat file is to be read.
Species names are to be read. Then temperature range of all 53 species & coefficients at lower & higher temperature ranges are to be read. The above mentioned governing fomulas for calculating Cp,H,S are to be put in the code.
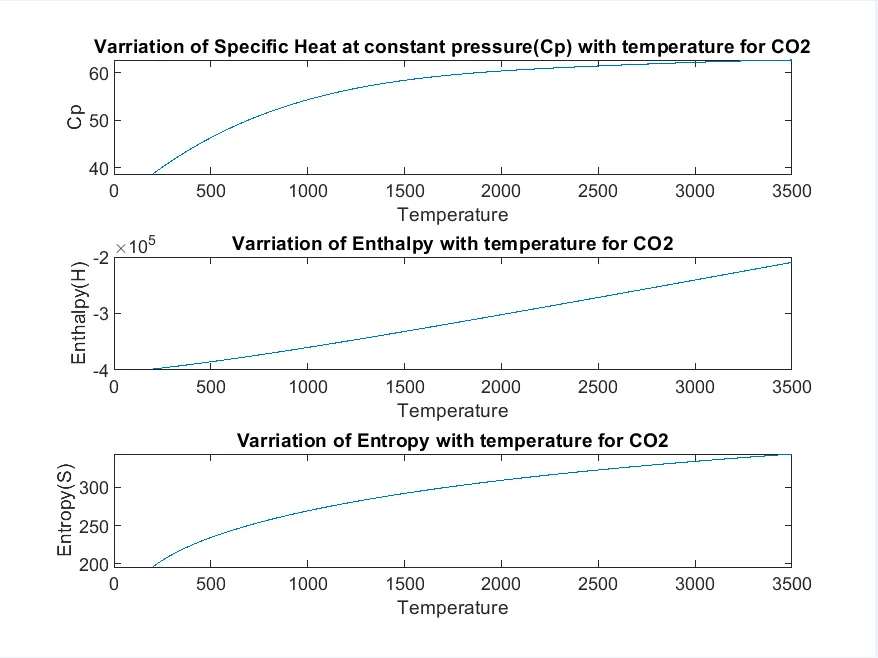
2) The theree thermodynamic properties are to be ploted with temperature for all the 53 nos of species. A new directory is to be craeted & those plots are to be saved in the new directory.
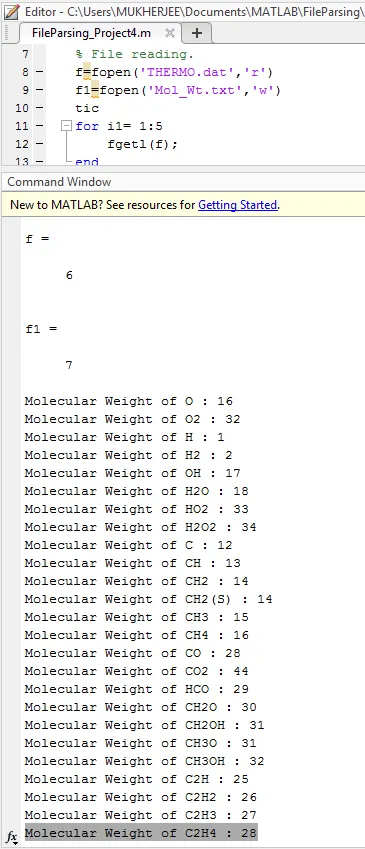
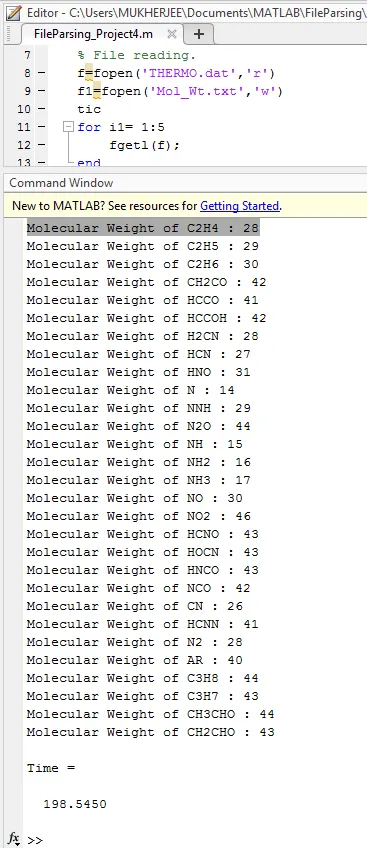
3) Molecular weight of all 53 species are to be calculated by taking no. of atoms of each species from the given .dat file. All the Molecular weight of all 53 species are saved in a .txt file, & are displayed in the command window.
All these are done automatically when the program in MATLAB is run.The only input is the THERMO.dat file.
The code in MATLAB is given below.:--
% Parsing NASA thermodynamic data

clc
clear all

% File reading.
f=fopen('THERMO.dat','r')
f1=fopen('Mol_Wt.txt','w')
tic
for i1= 1:5    % these 5 no. of lines are not very relavent of the project
    fgetl(f);
end

x=['O','H','C','N','AR']; %Array of 5 no of elements which make 53 no of species
y=[16,1,12,14,40]; %Array of atomic weight of 5 no of elements in same order


for i2=1:53  % for 53 number of species, the number of itration of loop is 53


 %Reading Line Number 6 of the THERMO.dat file

l6=fgetl(f);

  %Getting Species name from the THERMO.dat file

s=strsplit(l6,' ');
species=s(1);
SpeciesName=char(species);

   % Getting temperatures from the THERMO.dat file

pnt=strfind(l6,'.');
low_temp=str2num(l6(pnt(1)-3:pnt(1)+3));
mid_temp=str2num(l6(pnt(3)-4:pnt(3)+3));
high_temp=str2num(l6(pnt(2)-4:pnt(2)+3));

% Calculation Molecular Weight
j=25;
Mol_Wt=0;

for i3=1:4
   if j<=40
    k=j+4;
    A=l6(j);

    if  A==' '
      A=0;
     else

      for i4=1:5
      str_com1=strcmp(A,x(i4));
           if str_com1==1
               A=y(i4);
           end
       end
    end

   n=l6(k);
   if n==' '
    n=0;
    else n=str2num(l6(k));
   end

  mass=A*n;
  Mol_Wt=Mol_Wt+mass;

  j=j+5;

  end

end

% Saving Mol_Wt of all 53 spcies in file Mol_Wt.txt

fprintf(f1,'Molecular Weight of');
fprintf(f1,' %s',SpeciesName);
fprintf(f1,' : ');
fprintf(f1,'%d',Mol_Wt);
fprintf(f1,'n');

% Printing Mol_Wt at command window

fprintf('Molecular Weight of ');
fprintf(SpeciesName);
fprintf(' : ');
fprintf('%d',Mol_Wt);
fprintf('n')

%Reading Line Number 7 of the THERMO.dat file

  % Getting 7no. of Coefficients for higher temp range from the THERMO.dat file

l7=fgetl(f);
a=strfind(l7,'E');
cf_ht1=str2num(l7(1:a(1)+3));
cf_ht2=str2num(l7(a(1)+4:a(2)+3));
cf_ht3=str2num(l7(a(2)+4:a(3)+3));
cf_ht4=str2num(l7(a(3)+4:a(4)+3));
cf_ht5=str2num(l7(a(4)+4:a(5)+3));

%Reading Line Number 8 of the THERMO.dat file
l8=fgetl(f);
b=strfind(l8,'E');
cf_ht6=str2num(l8(1:b(1)+3));
cf_ht7=str2num(l8(b(1)+4:b(2)+3));

  % Getting 7no. of Coefficients for lower temp range from the THERMO.dat file
cf_lt1=str2num(l8(b(2)+4:b(3)+3));
cf_lt2=str2num(l8(b(3)+4:b(4)+3));
cf_lt3=str2num(l8(b(4)+4:b(5)+3));

% Reading of Line Number 9 of the THERMO.dat file
l9=fgetl(f);
c=strfind(l9,'E');
cf_lt4=str2num(l9(1:c(1)+3));
cf_lt5=str2num(l9(c(1)+4:c(2)+3));
cf_lt6=str2num(l9(c(2)+4:c(3)+3));
cf_lt7=str2num(l9(c(3)+4:c(4)+3));

% Calculation of Cp, H, S
     % Cp - Specific Heat at constant pressure
     % H - Enthalpy
     % S - Entropy
     % R - Universal Gas Constant
     % T - Temperature in Kelvin

T=linspace(low_temp,high_temp,4000);

R=8.314; %(in J/mole/k)

for i5=1:length(T)

    % Calculating Cp, H, S in lower temp range

    if T<=mid_temp

      Cp=R*(cf_lt1+cf_lt2*T+cf_lt3*T.^2+cf_lt4*T.^3+cf_lt5*T.^4);

      H=R*T.*(cf_lt1+((cf_lt2*T)/2)+((cf_lt3*T.^2)/3)+((cf_lt4*T.^3)/4)+((cf_lt5*T.^4)/5)+(cf_lt6./T));

      S=R*(cf_lt1*(log(T))+cf_lt2*T+((cf_lt3*T.^2)/2)+((cf_lt4*T.^3)/3)+((cf_lt5*T.^4)/4)+cf_lt7);


     % Calculating Cp, H, S in Higher temp range

    else

      Cp=R*(cf_ht1+cf_ht2*T+cf_ht3*T.^2+cf_ht4*T.^3+cf_ht5*T.^4);

      H=R*T.*(cf_ht1+((cf_ht2*T)/2)+((cf_ht3*T.^2)/3)+((cf_ht4*T.^3)/4)+((cf_ht5*T.^4)/5)+(cf_ht6./T));

      S=R*(cf_ht1*(log(T))+cf_ht2*T+((cf_ht3*T.^2)/2)+((cf_ht4*T.^3)/3)+((cf_ht5*T.^4)/4)+cf_ht7);

    end
end


% Plotting of Cp, H, S with temperature

figure(1);  % Three plots for Cp,H, S of a species are created in a figure
subplot(3,1,1);  % So three subplots are created in a figure
plot(T,Cp);
title(['Varriation of Specific Heat at constant pressure(Cp) with temperature for ',SpeciesName]);
xlabel('Temperature');
ylabel('Cp');

subplot(3,1,2);
plot(T,H);
title(['Varriation of Enthalpy with temperature for ',SpeciesName]);
xlabel('Temperature');
ylabel('Enthalpy(H)');

subplot(3,1,3);
plot(T,S);
title(['Varriation of Entropy with temperature for ',SpeciesName]);
xlabel('Temperature');
ylabel('Entropy(S)');


%Creating new directory "Plot' & saving the plots in the new directory

mkdir(['C:UsersMUKHERJEEDocumentsMATLABFileParsingNASAPlot',SpeciesName]);
cd (['C:UsersMUKHERJEEDocumentsMATLABFileParsingNASAPlot',SpeciesName]);
saveas(gcf,'Plot.png');
cd C:UsersMUKHERJEEDocumentsMATLABFileParsingNASA; % back to working directory 'NASA'


end

Time=toc
Explanation of the code:--
1) The THERMO.dat file is open to read it. Mol_Wt.txt file is also open to write the molecular weight of all 53 species.
2) The first first 5 no. line of the .dat file is read out.
One row vector 'x' is declared as array of symbol of 5 no. of elements which makes the all 53 species.
Another row vector 'Y' is declared as array of atomic mass of those 5 elements is same order.
3) After studying the THERMO.dat file, it is understood that related data of all 53 species are given in same fashion.
If we consider the 1st species 'O', we find that all related data are given in four line (line 6 to line to line 9). 1st line (line 6) gives symbol of constituent elements, the number of atom of different elements in which they are present the the species, low, mid & high temperature for that species etc. Next three lines gives the values of coefficients (1st 7 coefficients for high temperature range & 2nd 7 coefficients are for low temperature range).So calculation of three thermodynamic properties(Cp,H,S) for the species 'O', ploting of Cp, H, S with respect with temperature(T), saving those plots in a seperate directory, calculation of Molecular_Wt of the species 'O' & saving that in a .txt file & displaying in the command window, all these can be done by reading these fourlines (line 6 to line 9).
For the next species 'O2', all this can be done by reading next four lines(line10 to line 13). So there a for loop "i2=1:53" is used for all these activities for all 53 species.
4) By reading line 6, species name is picked up, here 'strsplit' command is used. Here the total string of lin6 is splited on the basis of ' ' that is NULL. By using indexing of the string seperated by ' ', the species name is picked by using command 'species=s(1)' & stored the species name (ie 'O') in the varriable 'SpciesName'.
5)Then by using indexing of each string of line 6 low, mid & high temperatures of that species ('O') are obtained (these are obtained as string) & stored in varriables low_temp,mid_temp, high_temp by converting the the string in to number. Here the command 'strfind' is used to find '.' in the line6. With respect to '.', indexing of charecter is used to pick up temperature in string form. Then the string is converted in to number to get the temperatures(low_temp, mid_temp, high_temp)in number form (double).
6) Calculatiom of Molecular Weight of species.
By studying the THERMO.dat file, we find that for all the species, symbol of constitune elements & the no. of atoms of those elements present in a species are in same indexing number (position of the string in the line) of a line, For example, in line number 174 of the THERMO.dat file, the species is 'HOCN'. In that line, the index no. of the the symbol of constituent elements, 'H', 'O', 'C', 'N' are 25th,30th,35th & 40th respectively, so here difference is 5 & the no. of atoms of those elements are at index no. 29th,34th, 39th, 44th respectively in the line 6. So index no of no. atom is greater by 4 than the index no. of the symbol of that element.
For all 53 species, symbol of constituent element & its number of atom present in the species, are kept in same maner in the respective line in the THERMO .dat file. Maximum no. of elements in a species is 4. In case of species having lesser no. of elements, remaining positions in the line are vacant , that is NULL (' '). For example , for the species 'O2', at the index no.30th, 35th, 40th for symbol of elements & coresponding index no. 34th, 39th,44th for no. of atom of elements , are vacant, that is NULL(' ').
So in the coding, a varriable 'j' is declared for the index no. of the symbol of element & initial value of that is 25 as explained earlier. Another varriable 'k' is declared for the index no. of the number of atom of the element present in the species. As explained earlier, value of 'k' is alway greater than value of 'j' by 4. As there are maximum 4 number of elements present in a species, so there is a loop ' i3=1:4 ' is run. As there are 5 no of different elements in all 53 species & symbols of these 5 no. of elements form the row vector 'X' , so a loop ' i4=1:5 ' is run. During reading line 6, symbol of element picked up by the control & stored in varriable 'A' is compared with the symbol of elemnts present in the row-vector 'X'. Here 'strcmp' command is used. With this the respective atomic mass is picked from the row vector 'Y'. By the varriable 'k' the number of atom of the element present in the species is picked from line no.6 & stored the the varriable 'n'. If it is numerical value in string form,so it is converted in to number. Now multiplying n with A the mass is determined & by runing the the loop, ' i3=1:4 ' the molecular weight (Mol_Wt) of the species is calculated. The Mol_Wt is written in the text file Mol_Wt.txt.
7) Calculation of Cp, H, S :--Through reading the line number 7, 8, 9 we get the coefficient by using index of the charecter & then convert in to number . Here we use 'fgetl' command to read the line. 'strfind' command is used to get the charecter 'E'. With respect to the charecter "E' , index number of sourrounding charecters are used to pick up the one coefficient in string form & then it is converted into number by 'str2num' command. The 1st 7 coefficients picked up are designated as coefficients for high temperature range(cf_ht1, cf_ht2... cf_ht7) & 2nd 7 coefficients are designated as the coefficients for lower temperature range(cf_lt1, cf_lt2.....cf_lt7). After that, the formulas given earlier to find out the Cp, H,S are put in to MATLAB code. Values of those coefficients, temperatue, value of universal gas contant 'R' are feed in to those formulas to find out the values of Cp, H, S for each temperature in the range from low_temp to high_temp. 4000 temperatures are created in that range from low_temp to high_temp by using ' 'linspace' command. Low temperature range is designated from low_temp to mid_temp & higher temperature range is denoted as the temperatures higher than mid_temp to high_temp.
8) Plotting of Cp, H, S with respect to temperature:-- Values of Cp, H , S obtained for each temperature in the range low_temp to high_temp, are ploted with temperaure. Here a 'figure' & in that figure three sub-figures are created. So one figure represents one species & in that figure three sub-figures represents plots of Cp, H & S respectively.
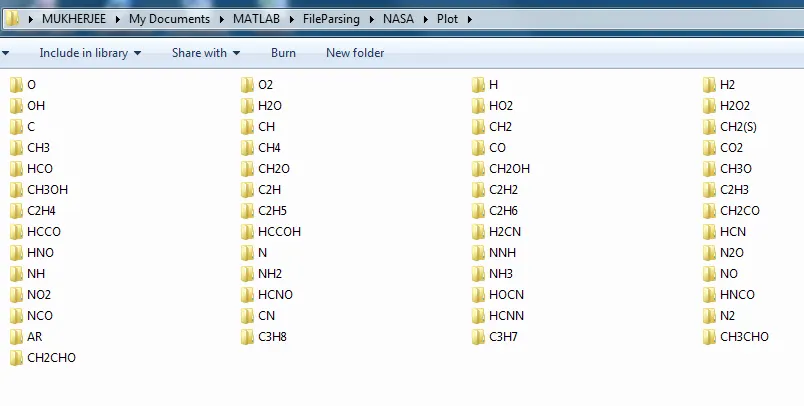
9) Crating a seperate directory:-- By using the 'mkdir'command , a seperate directory called 'Plot' is craeted under the working directory 'NASA'. All figures cerated for each species are saved in a sperate folders having name of those species.
So up to this for the species 'O' all the activities are executed by runing one loop of the for-loop ' for i2=1:53'. So for remaining other 52 no of species out of total 53, the for loop is to be run for 53 times further.
Display of molecular weight of ech species in command window:--
Screenshot of window where folders for plots are saved:--
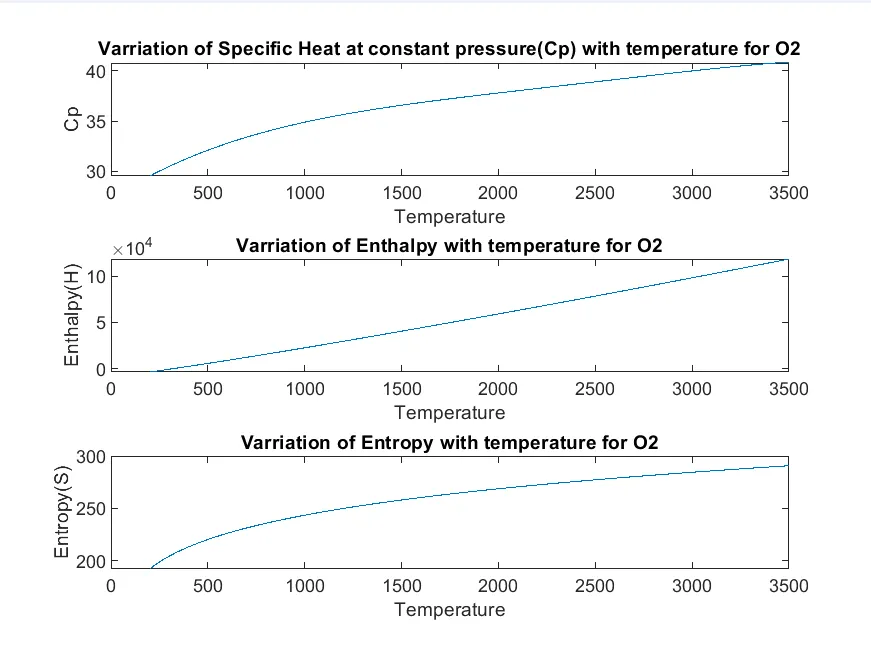
Plot for O2:--
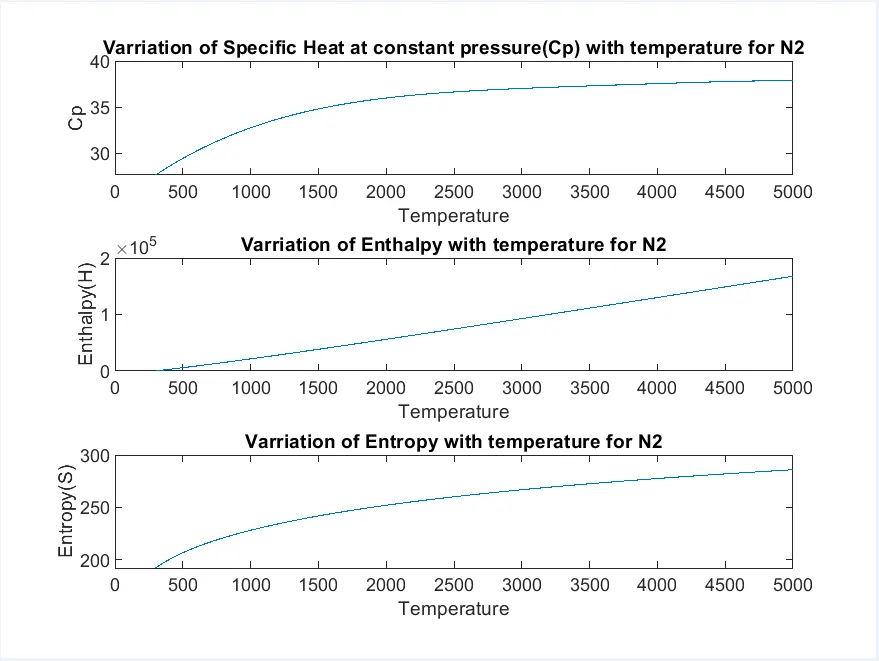
Plot for N2 :--
Plot for CO2:--