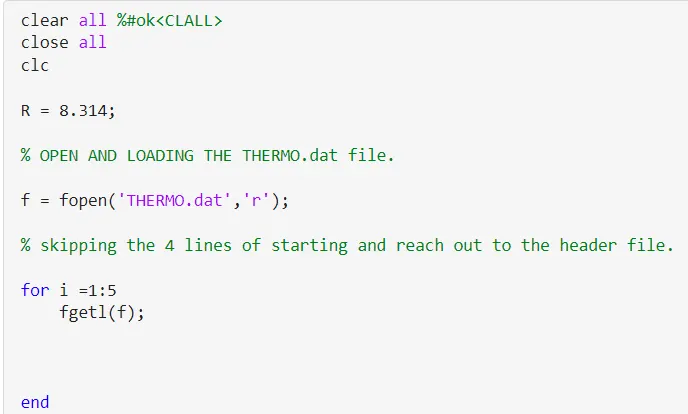
% OPEN AND LOADING THE THERMO.dat file.
f = fopen('THERMO.dat','r');
% skipping the 4 lines of starting and reach out to the header file.
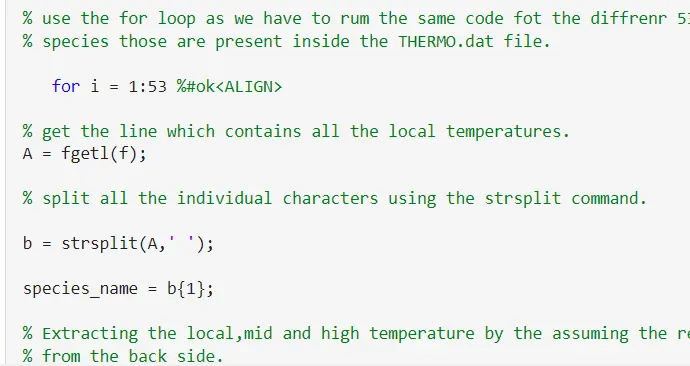
% use the for loop as we have to rum the same code fot the diffrenr 53
% species those are present inside the THERMO.dat file.
% get the line which contains all the local temperatures.
% split all the individual characters using the strsplit command.
% Extracting the local,mid and high temperature by the assuming the referce
low_local_temp =str2num(b{length(b)-3}); %#ok
mid_local_temp = str2num(b{length(b)-1}); %#ok
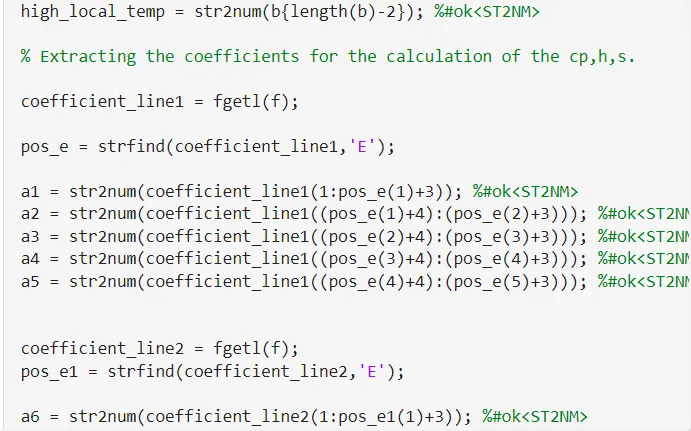
high_local_temp = str2num(b{length(b)-2}); %#ok
% Extracting the coefficients for the calculation of the cp,h,s.
coefficient_line1 = fgetl(f);
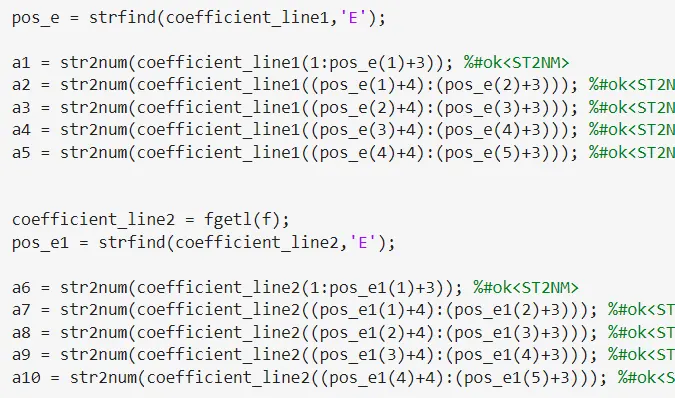
pos_e = strfind(coefficient_line1,'E');
a1 = str2num(coefficient_line1(1:pos_e(1)+3)); %#ok
a2 = str2num(coefficient_line1((pos_e(1)+4):(pos_e(2)+3))); %#ok
a3 = str2num(coefficient_line1((pos_e(2)+4):(pos_e(3)+3))); %#ok
a4 = str2num(coefficient_line1((pos_e(3)+4):(pos_e(4)+3))); %#ok
a5 = str2num(coefficient_line1((pos_e(4)+4):(pos_e(5)+3))); %#ok
coefficient_line2 = fgetl(f);
pos_e1 = strfind(coefficient_line2,'E');
a6 = str2num(coefficient_line2(1:pos_e1(1)+3)); %#ok
a7 = str2num(coefficient_line2((pos_e1(1)+4):(pos_e1(2)+3))); %#ok
a8 = str2num(coefficient_line2((pos_e1(2)+4):(pos_e1(3)+3))); %#ok
a9 = str2num(coefficient_line2((pos_e1(3)+4):(pos_e1(4)+3))); %#ok
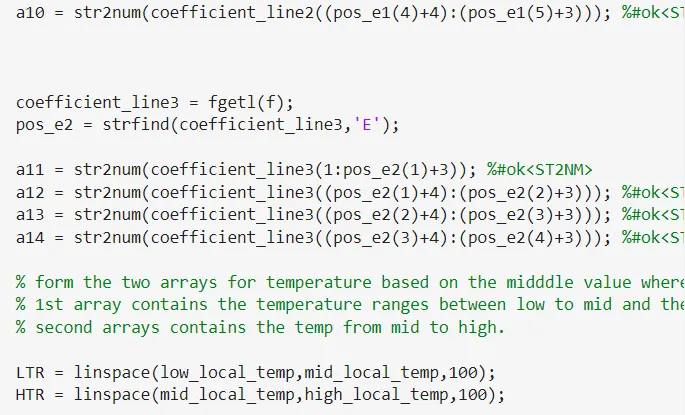
a10 = str2num(coefficient_line2((pos_e1(4)+4):(pos_e1(5)+3))); %#ok
coefficient_line3 = fgetl(f);
pos_e2 = strfind(coefficient_line3,'E');
a11 = str2num(coefficient_line3(1:pos_e2(1)+3)); %#ok
a12 = str2num(coefficient_line3((pos_e2(1)+4):(pos_e2(2)+3))); %#ok
a13 = str2num(coefficient_line3((pos_e2(2)+4):(pos_e2(3)+3))); %#ok
a14 = str2num(coefficient_line3((pos_e2(3)+4):(pos_e2(4)+3))); %#ok
% form the two arrays for temperature based on the midddle value where the
% 1st array contains the temperature ranges between low to mid and the
% second arrays contains the temp from mid to high.
LTR = linspace(low_local_temp,mid_local_temp,100);
HTR = linspace(mid_local_temp,high_local_temp,100);
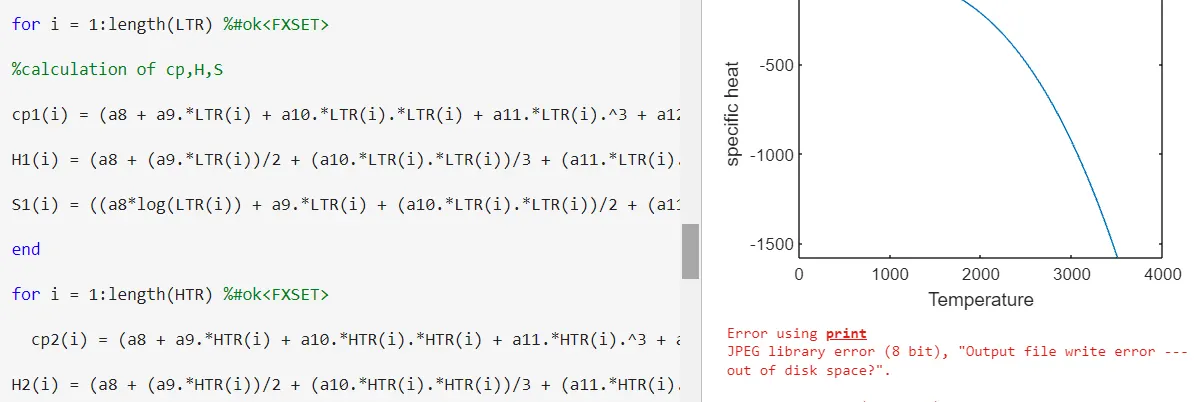
for i = 1:length(LTR) %#ok
cp1(i) = (a8 + a9.*LTR(i) + a10.*LTR(i).*LTR(i) + a11.*LTR(i).^3 + a12.*LTR(i).*4)*R; %#ok
H1(i) = (a8 + (a9.*LTR(i))/2 + (a10.*LTR(i).*LTR(i))/3 + (a11.*LTR(i).^3)/4 + (a12.*LTR(i).*4)/5 + a13*LTR(i))*LTR(i); %#ok
S1(i) = ((a8*log(LTR(i)) + a9.*LTR(i) + (a10.*LTR(i).*LTR(i))/2 + (a11.*LTR(i).^3)/3) + ((a12.*LTR(i).*4)/4) + a13)*R; %#ok
for i = 1:length(HTR) %#ok
cp2(i) = (a8 + a9.*HTR(i) + a10.*HTR(i).*HTR(i) + a11.*HTR(i).^3 + a12.*HTR(i).*4)*R; %#ok
H2(i) = (a8 + (a9.*HTR(i))/2 + (a10.*HTR(i).*HTR(i))/3 + (a11.*HTR(i).^3)/4 + (a12.*HTR(i).*4)/5 + a13*HTR(i))*HTR(i); %#ok
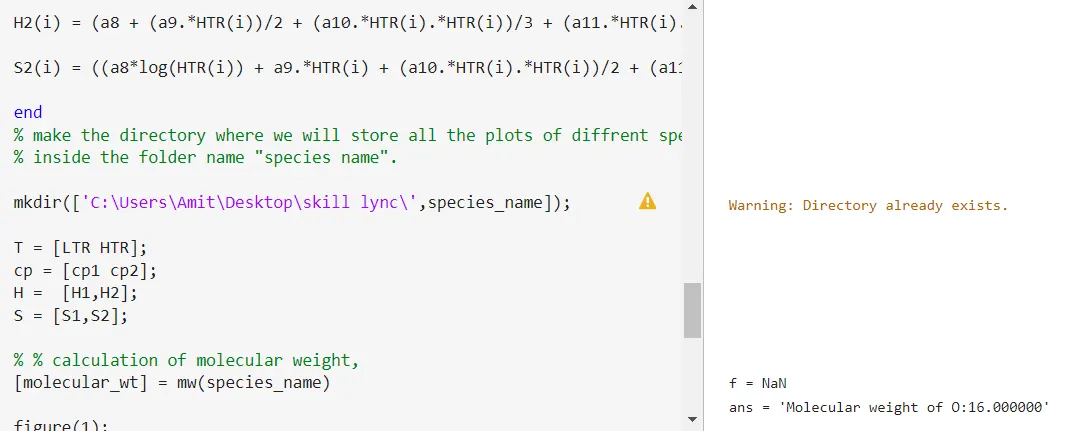
S2(i) = ((a8*log(HTR(i)) + a9.*HTR(i) + (a10.*HTR(i).*HTR(i))/2 + (a11.*HTR(i).^3)/3) + ((a12.*HTR(i).*4)/4) + a13)*R; %#ok
% make the directory where we will store all the plots of diffrent species
% inside the folder name "species name".
mkdir(['C:\Users\Amit\Desktop\skill lync\',species_name]);
% �lculation of molecular weight,
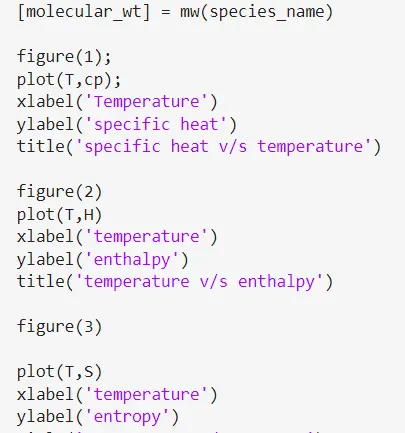
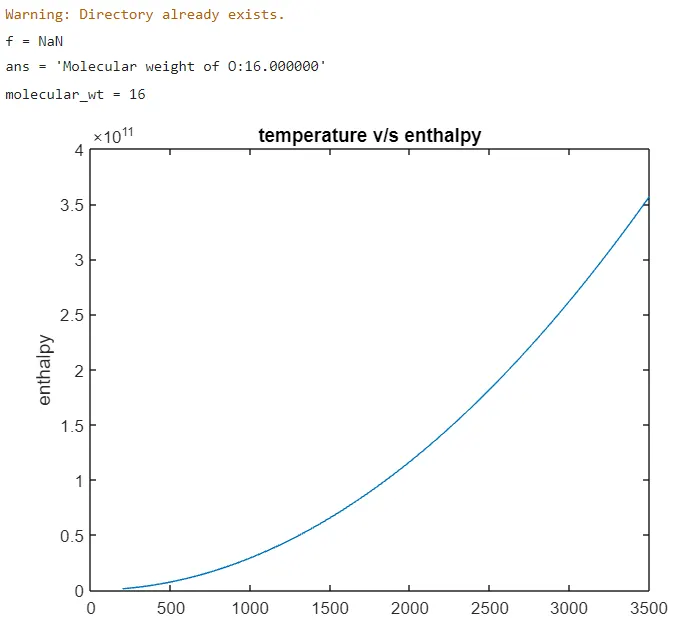
[molecular_wt] = mw(species_name)
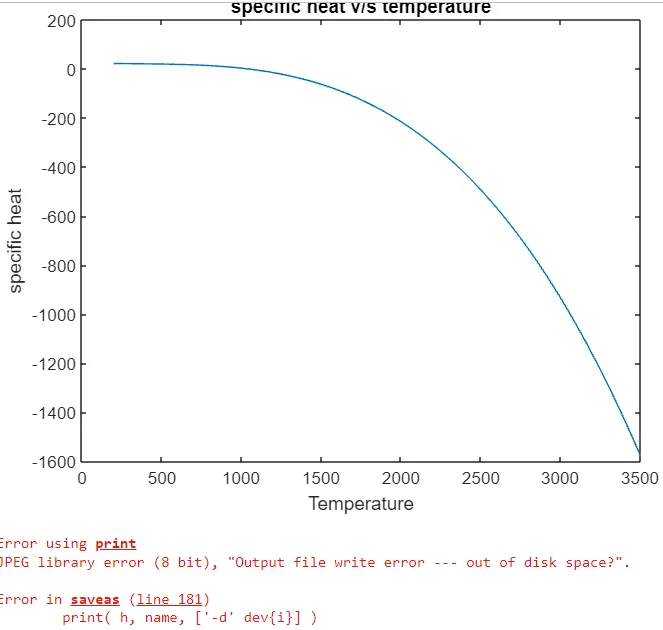
title('specific heat v/s temperature')
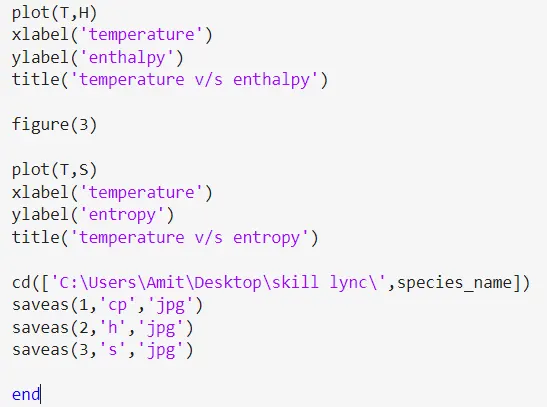
title('temperature v/s enthalpy')
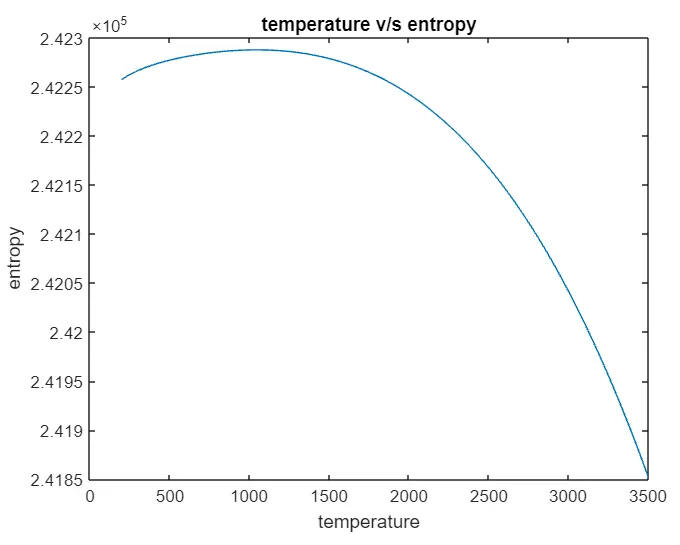
title('temperature v/s entropy')
cd(['C:\Users\Amit\Desktop\skill lync\',species_name])